
A Modified and Simplified Behavioral System Associated with Management Procedures for Assessing and Managing the Aggression Level of Free Roaming Dogs


A Modified and Simplified Behavioral System Associated with Management Procedures for Assessing and Managing the Aggression Level of Free Roaming Dogs
Amal H. Mostafa, Mohammed Y. Matoock, Heba M. A. Khalil*

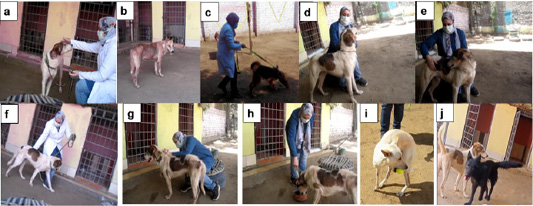
Representative images of behavioral assessments approach. A, Friendly greeting test; b, Room behavior test; c, Leash manner test; d, Look test; e, Sensitivity test; f, Tag test; g, Squeeze test; h, Food behavior test; i, Toy behavior test; j, Dog to dog test.

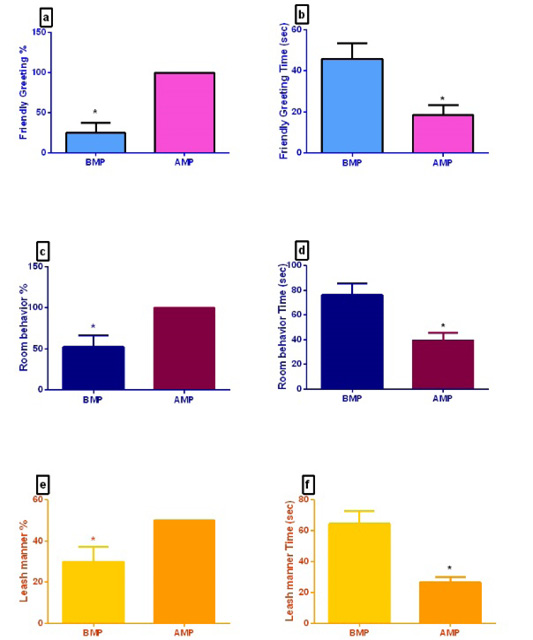
Effect of MPs on FRD’s behavior and the duration spent in each test. a, b, Friendly greeting test % and its time consumed; c, d, Room behavior test % and its time consumed; e, f, Leash manner test % and its time consumed. Data are presented as mean± S.E.M using paired T-test; SPSS, * means significant difference at 0.05

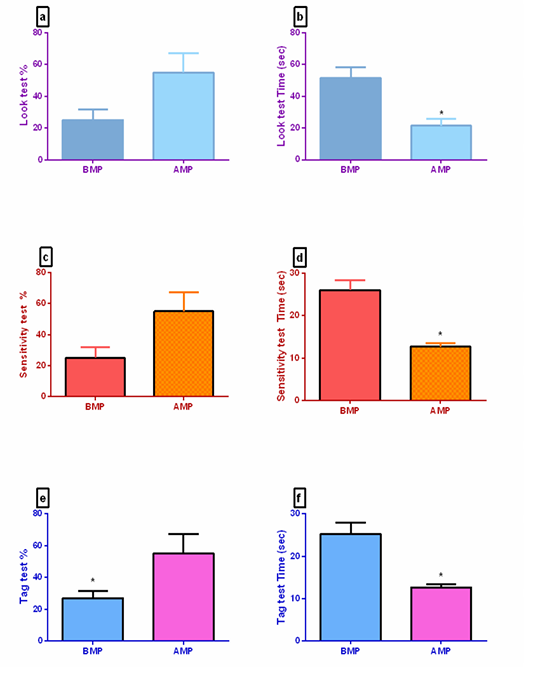
Effect of MPs on FRD’s behavior and the duration spent in each test. a, b, Look test % and its time consumed; c, d, Sensitivity test % and its time consumed; e, f, Tag test % and its time consumed. Data are presented as mean± S.E.M using paired T-test; SPSS, * means significant difference at 0.05.

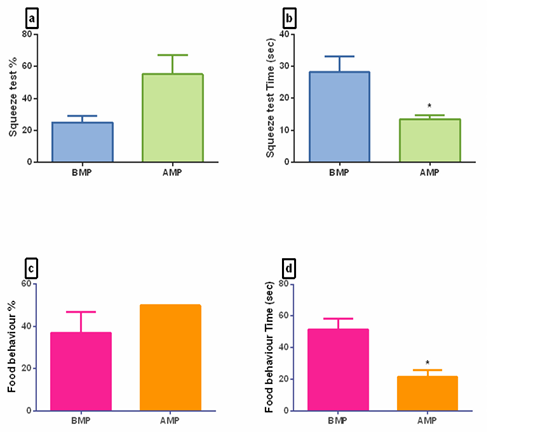
Effect of MPs on FRD’s behavior and the duration spent in each test. a, b, Squeeze test % and its time consumed; c, d, Food behavior test % and its time consumed. Data are presented as mean± S.E.M using paired T-test; SPSS, * means significant difference at 0.05.

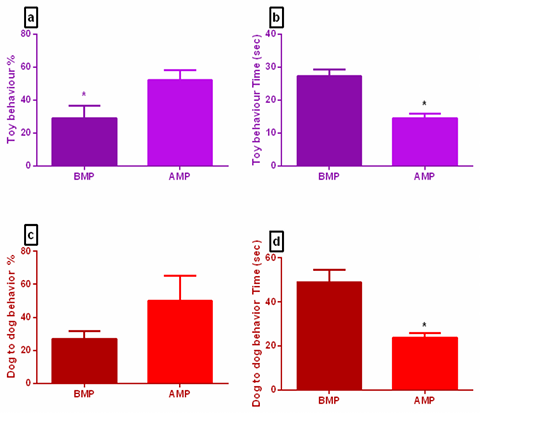
Effect of MPs on FRD’s behavior and the duration spent in each test. a, b, Toy behavior test % and its time consumed; c, d, Dog to dog test % and its time consumed. Data are presented as mean± S.E.M using paired T-test; SPSS, * means significant difference at 0.05.
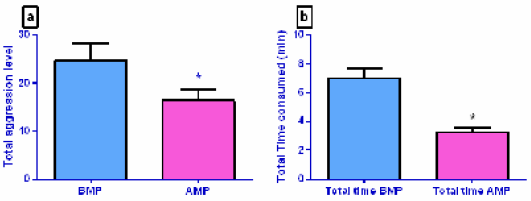
Effect of MPs on total aggression level and total time consumed during behavioral assessment of FRD. Data are presented as mean± S.E.M using paired T-test; SPSS, * means significant difference at 0.05.

