
This study aims to assess morphological variation of the ring-necked or common pheasant Phasianus colchicus across mainland China in response to environmental factors. We collected 399 pheasant and divided them into two groups: high altitude (>1500m) and low altitude (<1500m). The results that all morphological size measures of males were significantly higher than those of females (P<0.05). Most measures of size at low altitude significantly greater than those at high altitudes, including body weight, body length, and wing length for males (P<0.05), and body weight and wing length for females. The results showed that males and females are different in response to environmental factors. The body weight, wing length, tarsus, skull length and interorbital distance in females were significantly correlated with atmospheric pressure (P<0.05), along with body weight, body length, rictus, wing length, tarsus and skull length in males (P<0.05). A significant positive correlation was observed between wing length of males and wind speed (P=0.017). Conversely, body weight, body length, wing length and tail length in males were significantly negatively correlated with air temperature (P<0.05). Many measures of body size (wing length and tail length for males; tail length for females) increased with latitude after controlling for altitude, indicating that the body size of this species, especially in males, is significantly larger at high latitudes. It is the common pheasant’s adaptability to considerable environmental change that has facilitated the vast distribution of this species.
Research Article · Volume 53, Issue 2, 27 February 2021 · Open Access
The Effect of Environmental Factors on the Morphological Variation of the Common Pheasant, Phasianus colchicus in China
· · · ·
Affiliations & Notes ⌄
- 1Key Laboratory of Sichuan Institute for Protecting Endangered Birds in the Southwest Mountains, College of Life Sciences, Leshan Normal University, Leshan, Sichuan, 614004, China 2Department of Integrative Biology, University of Guelph, Guelph, Ontario, N1G 2WI, Canada 3Centre for Conservation Ecology, Department of Zoology, M.E.S Mampad College, Malappuram, Kerala, India, 676 542. , * Corresponding author: lywen02@126.com
Article Info ⌄
- Journal:
- Pakistan Journal of Zoology
- Published:
- 27 February 2021

From the article
- Our study indicates that body size is greater in males than females.
- It is common that pheasant family exhibits significant sexual dimorphism.
- It also performs a feature that male body size is greater than female.
Selected from the article's own text.
Abstract
INTRODUCTION
Geographic variation in morphology is a common occurrence in species of birds, and widespread patterns are often explained within an adaptive framework . Intraspecific geographic variation in body size is assumed to reflect adaptation to local environmental conditions, such as altitude, latitude and ambient temperature ; ; Sun et al., 2017). Altitudinal variation in body size has been well-documented ; ; . For instance, animals inhabiting higher altitudes generally have higher energy demands for cold surroundings ; . The body size is significantly negative correlated with altitude (P<0.01) in tree sparrow . Although latitudinal and altitudinal gradients show similar trends in temperature decline , some climate factors, such as solar radiation and lower temperatures, are often accompanied by decreased atmospheric pressure and constant, strong wind. Thus, these climatic components are more strongly associated with variation in altitude than latitude , 2010; . Similarly, limited oxygen availability may decrease digestive efficiency, thus eliciting a negative effect on body size; the mechanism of which has been demonstrated in geographic size variation in some lizards and mammals ; . Previous studies have demonstrated a positive relationship between body size and latitude in some species of birds and mammals ; ; ; . Associated morphological adaptations in birds and mammals are known to include variations related to body size ; .
The common pheasant (Phasianus colchicus) belongs to the genus Phasianus of the family Phasianidae, under the order Galliformes. A significant degree of sexual dimorphism exists in this species, which ranges across most of China . Therefore, it is an ideal species to understand morphological variation in different geographical locations. The study of this species has largely been focused on phylogeography ; ; , distribution of subspecies , physiology and biochemistry ; , heavy metal accumulation in tissues , as well as breeding ecology ; . However, the morphological variation of this species in response and adaptation to environmental factors is unknown. In this study, we collected 399 samples both from male and female common pheasants, across differing altitudinal and samples sites distributions in mainland China. Our objectives are to determine: 1) the difference in response to environmental effects between male and female conspecifics; 2) whether there is significant difference in morphology along the altitudinal gradient; and 3) the environmental factors which significantly affect the morphological size, by analyzing the relationship between size and environmental factors.
MATERIALS AND METHODS
A total of 399 individuals were obtained from: the Institute of Zoology, Chinese Academy of Sciences (CAS); the Kunming Institute of Zoology, CAS; the South China Institute for Endangered Animals; or collected from the wild. We used a Vernier caliper (0.1mm) to measure the morphological size of males and females, including: body length, tail length, culmen, rictus, wing length, tarsus, skull length, skull width, interorbital distance and so forth. Body mass was measured by an electric balance (0.1g). The sample sites were situated from 76.17°E - 129.17°E and 18.53°N - 52.97°N, while the region’s altitude spanned from 2m - 4472m (Tables I, II). Two populations were devised from the sample sites according to altitude: a high altitude population (>1500m) and a low altitude population (<1500m). The high altitude population consisted of 130 males and 65 females, while 136 males and 68 females comprised the low altitude population. We analyzed the correlation between environmental factors and morphological size of both males and females using the principal component analysis method, respectively. Twenty one environmental factors included: longitude, latitude, altitude, extreme minimum atmospheric pressure, extreme maximum atmospheric pressure, average atmospheric pressure, extreme minimum wind speed, average wind speed, extreme maximum wind speed, extreme maximum air temperature, extreme minimum air temperature, average air temperature, average maximum temperature, average minimum temperature, precipitation, average vapour pressure, average relative humidity, daily precipitation, maximum daily precipitation, sunshine duration, and percentage of sunshine. All the meteorological data was obtained from national meteorological data center of China. We used the independent sample T-test method, and analysis of the morphological differences between males and females, and high altitude and low altitude populations for male and female, respectively. All data were analyzed in SPSS 20.0 software.
RESULTS
Sexual size dimorphism
The results of the independent sample T-test illustrated that all the morphological size measures of males were significantly greater than those of females (P<0.05) (Table III).
Relationship with environmental factors
From principal component analysis, four principal components were obtained: PC1 (-0.966) (atmospheric pressure factor), PC2 (0.927) (precipitation factor), PC3 (0.916) (air temperature factor), and PC4 (0.887) (wind speed factor). The four principal components can explain 92% of the total variance in 21 environmental factors analyzed. Based on analysis of environmental factors and morphological characteristics, the results indicated that body weight, wing length, tarsus, skull length and interorbital distance had significant positive correlations with the atmospheric pressure factor in females (P<0.05). There was no significant correlation observed between any measure of morphological size and the wind speed factor neither in females, nor for female morphological size and the precipitation factor (P>0.05) (Table IV). Following the analysis of environmental components and morphological traits in males, the results illustrated that body weight, body length, rictus, wing length, tarsus and skull length had a significant positive correlation with the atmospheric pressure factor (P<0.05). Conversely, body weight, body length, wing length and tail length had significant negative correlations with the air temperature factor (P<0.05). Additionally, a significant positive correlation between wing length and the wind speed factor was revealed, while no significant correlation was observed between any morphological size measure and the precipitation factor for males (P>0.05) (Table IV).
Table I. Sampling sites of males of Phasianus colchicus.
| Sites | Gender | Date | Sampling size | Longitude | Latitude | Altitude (m) |
| Wuhu, Anhui | ♂ | 1908 | 1 | 118.43 | 31.35 | 11 |
| Yuexi, Anhui | ♂ | 2013 | 8 | 116.36 | 30.85 | 694 |
| Beijing | ♂ | 1932/1 966/ 1980 /1954 /1965 | 8 | 116.41 | 39.90 | 48 |
| Dangchang, Gansu | ♂ | 2013 | 2 | 104.39 | 34.05 | 2350 |
| Minqin, Gansu | ♂ | 2013 | 6 | 102.99 | 38.58 | 1384 |
| Minxian, Gansu | ♂ | 2013 | 9 | 104.04 | 34.44 | 2428 |
| Pingliang, Gansu | ♂ | 2013 | 9 | 106.65 | 35.22 | 1580 |
| Wuwei, Gansu | ♂ | 2013 | 6 | 102.64 | 37.93 | 1537 |
| Zhangxian, Gansu | ♂ | 2013 | 5 | 104.47 | 34.85 | 2034 |
| Lianyang, Guangdong | ♂ | 1959 | 3 | 111.18 | 23.72 | 372 |
| Shaoguan,Guangdong | ♂ | 2013 | 2 | 113.04 | 24.69 | 722 |
| Anshun, Guizhong | ♂ | - | 1 | 105.89 | 25.99 | 1398 |
| Tongren, Guizhong | ♂ | - | 2 | 109.05 | 25.83 | 425 |
| Chengde, Hebei | ♂ | 1927/ 1932/ 1960 | 9 | 117.91 | 40.95 | 338 |
| Dongling, Hebei | ♂ | 1929/ 1930/ 1935 | 14 | 117.66 | 40.18 | 108 |
| Harbin, Heilongjiang | ♂ | 1922/ 1952/ 1960 | 4 | 129.21 | 48.24 | 370 |
| Jishou, Hunan | ♂ | - | 2 | 109.70 | 28.26 | 378 |
| Yizhang, Hunan | ♂ | 1955/ 1956 | 5 | 113.02 | 28.21 | 38 |
| Xianghai, Jilin | ♂ | 2013 | 2 | 122.35 | 45.03 | 162 |
| Nanjing, Jiangsu | ♂ | 1960/ 1929 | 3 | 120.44 | 32.07 | 4 |
| Nanchang, Jiangxi | ♂ | 1960 | 1 | 115.86 | 28.68 | 21 |
| Aohan Banner, Inner Mongolia | ♂ | 2013 | 8 | 120.39 | 42.13 | 601 |
| Haggin Banner, Inner Mongolia | ♂ | 2013 | 5 | 108.74 | 39.83 | 1394 |
| Wuhai, Inner Mongolia | ♂ | 1960 | 9 | 106.80 | 39.66 | 1093 |
| Jingyuan, Ningxia | ♂ | 2013 | 3 | 106.33 | 35.50 | 1935 |
| Longde, Ningxia | ♂ | 2013 | 15 | 106.11 | 35.63 | 2106 |
| Guide, Qinghai | ♂ | 2013 | 6 | 101.43 | 36.04 | 2301 |
| Huzhu, Qinghai | ♂ | 2013 | 7 | 101.96 | 36.84 | 2762 |
| Menyuan, Qinghai | ♂ | 1960 | 6 | 101.62 | 37.36 | 3435 |
| Sites | Gender | Date | Sampling size | Longitude | Latitude | Altitude (m) |
| Minhe, Qinghai | ♂ | 1959 | 1 | 102.78 | 36.12 | 2277 |
| Woodhong, Qinghai | ♂ | 1959/ 2013 | 4 | 96.44 | 36.38 | 2857 |
| Tongren, Qinghai | ♂ | 1960/ 2013 | 9 | 102.02 | 35.52 | 2549 |
| Golmud, Qinghai | ♂ | 2013 | 6 | 93.16 | 36.91 | 2875 |
| Xining, Qinghai | ♂ | 1959 | 8 | 101.78 | 36.62 | 2270 |
| Zeku, Qinghai | ♂ | 1960 | 2 | 101.79 | 35.20 | 3473 |
| Zequ, Qinghai | ♂ | 2013 | 1 | 101.47 | 35.04 | 3662 |
| Qixia, Shandong | ♂ | 1964 | 8 | 121.07 | 37.19 | 216 |
| Lishi, Shanxi | ♂ | 1964/ 2013 | 2 | 111.15 | 37.52 | 942 |
| Qinshui, Shanxi | ♂ | 1960/ 1962 | 4 | 112.19 | 35.69 | 856 |
| Taiyuan, Shanxi | ♂ | 2013 | 1 | 112.33 | 37.47 | 778 |
| Yicheng, Shanxi | ♂ | 1962 /2013 | 5 | 111.72 | 35.74 | 623 |
| Foping, Shaanxi | ♂ | 1957/ 2013 | 2 | 107.99 | 33.52 | 1008 |
| Ningshan, Shaanxi | ♂ | 2013 | 1 | 108.30 | 33.65 | 1611 |
| Xi’an, Shaanxi | ♂ | 1957 | 5 | 108.94 | 34.34 | 383 |
| Yangxian, Shaanxi | ♂ | 1957 | 2 | 107.55 | 33.22 | 482 |
| Shanghai | ♂ | 1957 | 2 | 121.55 | 31.22 | 7 |
| Hongyuan, Sichuan | ♂ | 1961 | 1 | 102.46 | 32.51 | 3612 |
| Huidong, Sichuan | ♂ | 1960 | 2 | 102.58 | 26.63 | 2135 |
| Meigu, Sichuan | ♂ | 1960 | 1 | 103.13 | 28.60 | 2255 |
| Muli, Sichuan | ♂ | - | 1 | 101.28 | 27.93 | 3461 |
| Pingwu, Sichuan | ♂ | 1969 | 2 | 104.53 | 32.41 | 1209 |
| Ruoergai, Sichuan | ♂ | - | 1 | 102.96 | 33.58 | 3490 |
| Mangkang, Tibet | ♂ | 1976 | 2 | 98.59 | 29.68 | 4283 |
| Aksu, Xinjiang | ♂ | 1958 | 1 | 80.26 | 41.17 | 1108 |
| Yuli, Xinjiang | ♂ | - | 1 | 86.25 | 41.36 | 931 |
| Baoshan, Yunnan | ♂ | - | 2 | 98.49 | 25.02 | 1810 |
| Dali, Yunnan | ♂ | - | 1 | 100.58 | 25.83 | 1651 |
| Honghe, Yunnan | ♂ | - | 3 | 103.36 | 23.40 | 1310 |
| Kunming, Yunnan | ♂ | 1962 | 5 | 102.61 | 25.06 | 2166 |
| Lijiang, Yunnan | ♂ | 1960 | 5 | 100.23 | 26.86 | 2405 |
| Luxi, Yunnan | ♂ | 1965 | 2 | 98.59 | 24.45 | 907 |
| Simao, Yunnan | ♂ | - | 1 | 100.83 | 24.45 | 1337 |
| Yuxi, Yunnan | ♂ | - | 1 | 102.41 | 24.17 | 1642 |
| Zhaotong, Yunnan | ♂ | - | 5 | 103.72 | 27.34 | 1921 |
| Zhongdian, Yunnan | ♂ | 1981/ 1959 | 3 | 103.23 | 25.23 | 1799 |
| Haiyan, Zhejiang | ♂ | 1925 | 2 | 120.95 | 30.53 | 5 |
Table II. Sampling sites of females of Phasianus colchicus.
| Sites | Gender | Date | Sampling size | Longitude | Latitude | Altitude (m) |
| Yuexi, Anhui | ♀ | 2013 | 8 | 116.36 | 30.85 | 694 |
| Beijing | ♀ | 1965/ 1966 | 4 | 116.41 | 39.90 | 48 |
| Dangchang, Gansu | ♀ | 2013 | 4 | 104.39 | 34.05 | 2350 |
| Minqin, Gansu | ♀ | 2013 | 5 | 102.99 | 38.58 | 1384 |
| Minxian, Gansu | ♀ | 2013 | 4 | 104.04 | 34.44 | 2428 |
| Pingliang, Gansu | ♀ | 2013 | 3 | 106.65 | 35.22 | 1580 |
| Wuwei, Gansu | ♀ | 2013 | 4 | 102.64 | 37.93 | 1537 |
| Zhangxian, Gansu | ♀ | 2013 | 5 | 104.47 | 34.85 | 2034 |
| Lianyang, Guangdong | ♀ | 1959 | 2 | 111.18 | 23.72 | 372 |
| Shaoguan,Guangdong | ♀ | 2013 | 4 | 113.04 | 24.69 | 722 |
| Anshun, Guizhong | ♀ | - | 1 | 105.89 | 25.99 | 1398 |
| Qianxi, Guizhou | ♀ | - | 1 | 104.90 | 25.09 | 1353 |
| Chengde, Hebei | ♀ | 1960/ 1974 | 2 | 117.91 | 40.95 | 338 |
| Dongling, Hebei | ♀ | 1935 | 4 | 117.66 | 40.18 | 108 |
| Harbin, Heilongjiang | ♀ | 1960 | 2 | 129.21 | 48.24 | 370 |
| Yichang, Hunan | ♀ | 1959 | 1 | 113.02 | 28.21 | 38 |
| Xianghai, Jilin | ♀ | 2013 | 3 | 122.35 | 45.03 | 162 |
| Nanchang, Jiangxi | ♀ | 1960 | 1 | 115.86 | 28.68 | 21 |
| Aohan Banner, Inner Mongolia | ♀ | 2013 | 8 | 120.39 | 42.13 | 601 |
| Haggin Banner, Inner Mongolia | ♀ | 2013 | 5 | 108.74 | 39.83 | 1394 |
| Wuhai, Inner Mongolia | ♀ | 1963/ 1964 | 3 | 106.80 | 39.66 | 1093 |
| Longde, Ningxia | ♀ | 2013 | 14 | 106.11 | 35.63 | 2106 |
| Guide, Qinghai | ♀ | 2013 | 6 | 101.43 | 36.04 | 2301 |
| Guinan, Qinghai | ♀ | 1959 | 2 | 100.75 | 35.58 | 3412 |
| Menyuan, Qinghai | ♀ | 1959 | 1 | 101.62 | 37.36 | 3435 |
| Tongren, Qinghai | ♀ | 1960 | 3 | 102.02 | 35.52 | 2549 |
| Xining,Qinghai | ♀ | 1959 | 4 | 101.78 | 36.62 | 2270 |
| Qixia, Shandong | ♀ | 1964 | 1 | 121.07 | 37.19 | 216 |
| Qinshui, Shanxi | ♀ | 1962 | 1 | 112.19 | 35.69 | 856 |
| Yicheng, Shanxi | ♀ | 1962 | 2 | 111.72 | 35.74 | 623 |
| Foping, Shaanxi | ♀ | 1957 | 1 | 107.99 | 33.52 | 1008 |
| Sites | Gender | Date | Sampling size | Longitude | Latitude | Altitude (m) |
| Xi’an, Shaanxi | ♀ | 1957 | 2 | 108.94 | 34.34 | 383 |
| Yangxian, Shanxi | ♀ | 1957 | 1 | 107.55 | 33.22 | 482 |
| Batang, Sichuan | ♀ | 1960 | 1 | 99.11 | 30.00 | 4687 |
| Hongyuan, Sichuan | ♀ | 1961 | 2 | 102.46 | 32.51 | 3612 |
| Muli, Sichuan | ♀ | 1959 | 2 | 101.28 | 27.93 | 3461 |
| Pingwu, Sichuan | ♀ | 1969 | 1 | 104.53 | 32.41 | 1209 |
| Wanyuan, Sichuan | ♀ | 1958 | 1 | 108.03 | 32.08 | 1033 |
| Mangkang, Tibet | ♀ | 1976 | 1 | 98.59 | 29.68 | 4283 |
| Aksu, Xinjiang | ♀ | 1958 | 1 | 80.26 | 41.17 | 1108 |
| Kunming, Yunnan | ♀ | 1962 | 3 | 102.61 | 25.06 | 2166 |
| ♀ | 1960 | 2 | 100.23 | 26.86 | 2405 | |
| Yuxi, Yunnan | ♀ | - | 2 | 102.41 | 24.17 | 1642 |
| Zhaotong, Yunnan | ♀ | - | 1 | 103.72 | 27.34 | 1921 |
| Zhongdian, Yunnan | ♀ | - | 1 | 103.23 | 25.23 | 1799 |
| Haiyan, Zhejiang | ♀ | 1925 | 3 | 120.95 | 30.53 | 5 |
Table III. Sexual size dimorphism in common pheasant, Phasianus colchicus.
| Male | Female | t | df | P | |
| Bodyweight | 1050.42± 33.12 | 804.47± 33.54 | 5.146 | 87 | <0.001 |
| Body length | 76.75±1.14 | 53.72±0.99 | 15.250 | 107 | <0.001 |
| Culmen | 3.29±0.04 | 2.84±0.05 | 7.145 | 108 | <0.001 |
| Rictus | 3.29±0.02 | 2.91±0.02 | 10.969 | 102 | <0.001 |
| Wing length | 23.84±0.50 | 20.67±0.19 | 5.069 | 108 | <0.001 |
| Tail length | 44.02±1.04 | 25.76±0.64 | 14.939 | 93.856 | <0.001 |
| Tarsus | 6.34±0.12 | 5.72±0.08 | 3.904 | 109 | <0.001 |
| Claw | 1.24±0.02 | 1.07±0.02 | 5.749 | 81 | <0.001 |
| Skull length | 4.06±0.04 | 3.64±0.05 | 6.364 | 81 | <0.001 |
| Skull width | 2.78±0.04 | 2.59±0.04 | 3.578 | 81 | <0.001 |
| Interorbital distance | 2.37±0.04 | 2.00±0.04 | 5.912 | 81 | <0.001 |
| Wing-spans | 71.71±1.13 | 64.45±1.02 | 4.763 | 20 | <0.001 |
| Toe length | 4.92±0.15 | 4.35±0.13 | 2.802 | 20 | 0.011 |
Note: Bold font represents a statistically significant size difference between male and female pheasants at the significance level of 0.001
Furthermore, we analyzed the relationship between morphological size and latitude after controlling for altitude, as well as the relationship between morphological size and altitude after controlling for latitude. The results showed that female tail length had a significant positive correlation with latitude when controlling for altitude (P<0.05), while female body weight and skull length had significant negative correlation with altitude when controlling
Table IV. The correlation of principal environmental factors with morphology of Phasianus colchicus of male and female.
| Statistical | Body | Body length | Culmen | Rictus | Wing length | Tail length | Tarsus | Skull length | Skull width | Interorbital | ||
| parameters | weight | distance | ||||||||||
| Fe ma le | PC1 | r | 0.515 | 0.222 | -0.156 | 0.067 | 0.324 | 0.135 | 0.367 | 0.451 | -0.047 | 0.341 |
| df | 37 | 46 | 46 | 46 | 46 | 45 | 46 | 34 | 34 | 34 | ||
| P | 0.001 | 0.138 | 0.301 | 0.656 | 0.028 | 0.377 | 0.012 | 0.007 | 0.792 | 0.048 | ||
| PC2 | r | -0.026 | -0.160 | 0.231 | -0.127 | -0.034 | -0.228 | 0.174 | 0.014 | -0.274 | 0.128 | |
| df | 37 | 46 | 46 | 46 | 46 | 45 | 46 | 34 | 34 | 34 | ||
| P | 0.878 | 0.289 | 0.122 | 0.400 | 0.824 | 0.132 | 0.247 | 0.939 | 0.116 | 0.472 | ||
| PC3 | r | 0.299 | -0.167 | 0.024 | -0.107 | -0.184 | -0.479 | 0.042 | -0.161 | 0.089 | -0.314 | |
| df | 37 | 46 | 46 | 46 | 46 | 45 | 46 | 34 | 34 | 34 | ||
| P | 0.072 | 0.269 | 0.877 | 0.479 | 0.221 | <0.001 | 0.781 | 0.362 | 0.616 | 0.070 | ||
| PC4 | r | 0.202 | 0.109 | 0.079 | -0.027 | 0.081 | -0.066 | 0.152 | -0.216 | 0.082 | -0.023 | |
| df | 37 | 46 | 46 | 46 | 46 | 45 | 46 | 34 | 34 | 34 | ||
| P | 0.231 | 0.471 | 0.6002 | 0.859 | 0.591 | 0.669 | 0.312 | 0.219 | 0.643 | 0.895 | ||
| Ma le | PC1 | r | 0.395 | 0.260 | 0.033 | 0.259 | 0.293 | 0.215 | 0.598 | 0.407 | 0.129 | 0.136 |
| df | 49 | 64 | 65 | 59 | 64 | 60 | 65 | 49 | 49 | 49 | ||
| P | 0.005 | 0.038 | 0.797 | 0.048 | 0.019 | 0.098 | <0.001 | 0.004 | 0.376 | 0.350 | ||
| PC2 | r | 0.123 | -0.001 | 0.141 | -0.197 | -0.129 | -0.046 | 0.008 | 0.253 | 0.164 | -0.038 | |
| df | 49 | 64 | 65 | 59 | 64 | 60 | 65 | 49 | 49 | 49 | ||
| P | 0.399 | 0.991 | 0.262 | 0.134 | 0.309 | 0.729 | 0.949 | 0.080 | 0.260 | 0.798 | ||
| PC3 | r | -0.437 | -0.407 | 0.196 | -0.252 | -0.256 | -0.500 | -0.177 | -0.039 | -0.110 | -0.163 | |
| df | 49 | 64 | 65 | 59 | 64 | 60 | 65 | 49 | 49 | 49 | ||
| P | 0.002 | <0.001 | 0.117 | 0.055 | 0.041 | 0.159 | 0.791 | 0.454 | 0.263 | |||
| PC4 | r | 0.098 | -0.047 | 0.042 | -0.073 | 0.297 | -0.100 | 0.027 | -0.059 | -0.134 | 0.029 | |
| df | 49 | 64 | 65 | 59 | 64 | 60 | 65 | 49 | 49 | 49 | ||
| P | 0.503 | 0.71 | 0.7409 | 0.582 | 0.017 | 0.449 | 0.833 | 0.686 | 0.359 | 0.845 | ||
Note: PC1: atmospheric pressure factor; PC2: precipitation factor; PC3: air temperature factor; PC4: wind speed factor. Bold font represents a statistically significant correlation between the environmental factor and the size of the trait measured, at the significance level of 0.05.
for latitude (P<0.05) (Table V). Our analysis also showed that male body weight, rictus, wing length and tail length had significant positive correlations with latitude when controlling for altitude (P<0.05). Conversely, male tarsus and skull length had significant negative correlations with altitude when controlling for latitude (P<0.05) (Table V).
Variation of morphology with altitude
The results indicated that most measures of morphological size at low altitude sites were significantly greater than those at high altitude sites, including body weight, body length, culmen, rictus, wing length, tarsus, and skull length for males (P<0.05), as well as body weight, wing length, tarsus, and skull length for females (Fig. 1, Table VI).
DISCUSSION
Sexual selection is one of the evolutionary motive forces, and the selection pressures affecting mating opportunities and mating competitiveness have led to sexual dimorphism in animals ; . Our study indicates that body size is greater in males than females. It is common that pheasant family exhibits significant sexual dimorphism. It also performs a feature that male body size is greater than female. The morphology size is the weapons or reliable signals of male quality directed both to females and rivals in pheasants . The superior body condition of males ensures better offspring viability in birds, such as barn swallow Hirundo rustica ; Petrie, 1994; . Therefore, we believe that this characteristic is
Table V. The partial correlation analysis of altitude and latitude with morphology of Phasianus colchicus of male and female.
| Variable | Body weight | Body length | Culmen | Rictus | Wing length | Tail length | Tarsus | Skull length | Skull width | Intero rbitald istance | ||
| Altitude (F) | r | -0.04 | 0.3 | -0.291 | -0.157 | 0.212 | 0.638 | -0.05 | 0.219 | 0.082 | 0.193 | |
| Latitude | df | 23 | 23 | 23 | 23 | 23 | 23 | 23 | 23 | 23 | 23 | |
| P | 0.85 | 0.145 | 0.159 | 0.455 | 0.308 | 0.001 | 0.811 | 0.293 | 0.696 | 0.356 | ||
| Latitude (F) | r | -0.546 | 0.111 | -0.028 | -0.256 | -0.142 | 0.248 | -0.295 | -0.435 | -0.076 | -0.241 | |
| Altitude | df | 23 | 23 | 23 | 23 | 23 | 23 | 23 | 23 | 23 | 23 | |
| P | 0.005 | 0.599 | 0.893 | 0.216 | 0.497 | 0.232 | 0.153 | 0.03 | 0.718 | 0.246 | ||
| Altitude (M) | r | 0.339 | 0.212 | -0.089 | 0.528 | 0.44 | 0.336 | 0.286 | -0.123 | 0.189 | ||
| Latitude | df | 37 | 37 | 37 | 37 | 37 | 37 | 37 | 37 | 37 | 37 | |
| P | 0.035 | 0.196 | 0.59 | 0.001 | 0.005 | 0.037 | 0.078 | 0.51 | 0.457 | 0.248 | ||
| Latitude (M) | r | -0.216 | -0.177 | -0.274 | -0.274 | -0.27 | 0.012 | -0.649 | -0.481 | -0.195 | -0.136 | |
| Altitude | df | 37 | 37 | 37 | 37 | 37 | 37 | 37 | 37 | 37 | 37 | |
| P | 0.187 | 0.282 | 0.091 | 0.092 | 0.096 | 0.943 | <0.001 | 0.002 | 0.234 | 0.41 | ||
Note: Bold font indicates a significant correlation between altitude or latitude and the morphological measure in question, at the significance level of 0.05. F: female, M: male.
Table VI. Morphological variations between high and low altitude regions for male and female pheasants of Phasianus colchicus.
| Body weight /g | Body length /cm | Culmen /cm | Rictus /cm | Wing length /cm | Tail length /cm | Tarsu s/cm | Skull length /cm | Skull width /cm | Interor bitaldi stance /cm | ||
| Fem ale | Low Altit-ude | 824.90± 26.29 | 54.82± 0.74 | 2.91± 0.06 | 2.89± 0.05 | 21.18± 0.20 | 26.17± 0.45 | 5.94± 0.13 | 3.73± 0.07 | 2.60± 0.04 | 2.05± 0.05 |
| High Altit-ude | 692.79± 30.21 | 52.38± .00 | 2.77± 0.09 | 2.88± 0.04 | 20.05± 0.30 | 26.02± 1.09 | 5.55± 0.12 | 3.50± 0.06 | 2.57± 0.06 | 1.92± 0.07 | |
| t | 3.30 | 1.14 | 1.36 | 0.05 | 3.26 | 0.13 | 2.18 | 2.26 | 0.38 | 1.46 | |
| df | 35.00 | 24.19 | 44.00 | 44.00 | 44.00 | 24.12 | 44.00 | 32.00 | 32.00 | 32.00 | |
| P | 0.002 | 0.266 | 0.181 | 0.964 | 0.002 | 0.898 | 0.034 | 0.031 | 0.704 | 0.154 | |
| Male | Low Altit-ude | 1094.63± 32.24 | 79.00± 1.54 | 3.39± 0.05 | 3.33± 0.04 | 23.71± 0.16 | 45.25± 1.28 | 6.66± 0.07 | 4.16± 0.05 | 2.81± 0.06 | 2.38± 0.05 |
| High Altit ude | 949.36± 36.62 | 74.36± 1.59 | 3.19± 0.05 | 3.23± 0.03 | 22.96± 0.17 | 42.42± 1.71 | 6.19± 0.11 | 3.93± 0.06 | 2.75± 0.05 | 2.35± 0.08 | |
| t | 2.99 | 2.09 | 2.88 | 2.09 | 3.18 | 1.36 | 3.65 | 2.71 | 0.72 | 0.27 | |
| df | 47.00 | 61.76 | 63.00 | 57.00 | 61.32 | 58.00 | 63.00 | 47.00 | 47.00 | 47.00 | |
| P | 0.004 | 0.041 | 0.005 | 0.041 | 0.002 | 0.180 | 0.001 | 0.009 | 0.477 | 0.788 |
Note: Bold font indicates a statistically significant difference in size at the significance level of 0.05.
an important result of its wide distribution in evolutionary adaptation.
The most measures of morphological size are significantly greater at low altitudes than at high altitudes both for male and female common pheasants. Some researchers have shown that in the Galerida, body size does not increase with altitude in G. cristata . Also, Lu et al. (2009) reported two sympatric Montifringilla snow finch species (M. taczanowskii and M. ruficollis) in a higher altitude region, and compared the data with those of their lower altitude conspecifics. Their results indicated that relative to their lower altitude conspecifics, the higher altitude snow finches had smaller body sizes. Similarly, in some mammal species, such as the Daurian pika (Ochotona daurica), skull size is negatively correlated with altitude . The body size of avian fauna is affected by the availability of food and interspecific competition ; .
Individual size is significantly positive correlated with the degree of primary productivity in any environment . Although latitudinal and altitudinal gradients show similar temperature decline trends , some climate factors such as solar radiation and lower temperatures, which are often accompanied by decreased atmospheric pressure and constant strong wind are more strongly associated with variation in altitude than latitude , 2010; ; ; . The body size patterns observed may be attributed to constraints on individual growth by climate severity, food scarcity and hypoxia at higher altitudes . The body size of avian could be affected on food available and interspecies competition . The primary productivity is positively correlated with body size in any environments ; . The body size, such as body weight, wing length and tarsus, could be significantly smaller at higher altitude areas due to lower level of primary productivity and few air (P<0.01) . We argue that body size tends to decrease with altitude in common pheasant due to the harsh conditions brought forth by environmental factors at high altitudes.
The results indicated that the atmospheric pressure factor and the air temperature factor had significant effects on both male and female body size. Atmospheric pressure and temperature are often associated with a significant decrease with rising elevation; for every additional 100m above sea level, temperature drops by 0.6℃, while atmospheric pressure is reduced by 0.67 KPa. However, male body weight, body length, wing length and tail length had significant negative correlations with the air temperature factor (P<0.05). Usually, air temperature decreases with rising altitude and latitude. The overall pheasant body size (such as weight, wings length, etc.) is larger with increasing latitude. Essentially, the body size of the common pheasant is significantly larger at high latitudes in colder regions than at low latitudes of warmer regions (Table VI). Conversely, some measures of body size, such as skull length, decrease as the altitude rises. That is to say that the body size of the common pheasant is significantly smaller at high altitudes than at low altitudes (Table VI). Therefore, altitude is the primary factor of morphological variation in different areas, as compared to latitude. Furthermore, the wind speed factor had a significant effect on male wing length (P=0.017) (Table IV), thus indicating that the greater the wind speed in a given area, the longer the wing length of male common pheasants situated in said region. Longer wings have increased flight ability and allow for easier acclimation to the environment, in order to survive. Therefore, geographic variation in body size is assumed to reflect adaptation to local environmental conditions for conspecifics ; ; . It is the common pheasant’s adaptability in response to environmental changes that has facilitated the vast distribution of this species.
ACKNOWLEDGEMENTS
We wish to thank Professor Lei Fumin from the Institute of Zoology, Chinese Academy of Sciences (CAS); Professor Yang Xiaojun from the Kunming Institute of Zoology, CAS; and Professor Zou Fasheng, the South China Institute for Endangered Animals, for kindly assisting in the collection of samples. This research was funded by the National Natural Science Foundation of China (No.31372171), as well as the Building Plan for Scientific Research Innovation Team of Leshan Normal University.
Statement of conflict of interest
The authors declare that “there is no conflict of interests regarding the publication of this article”.
Figures
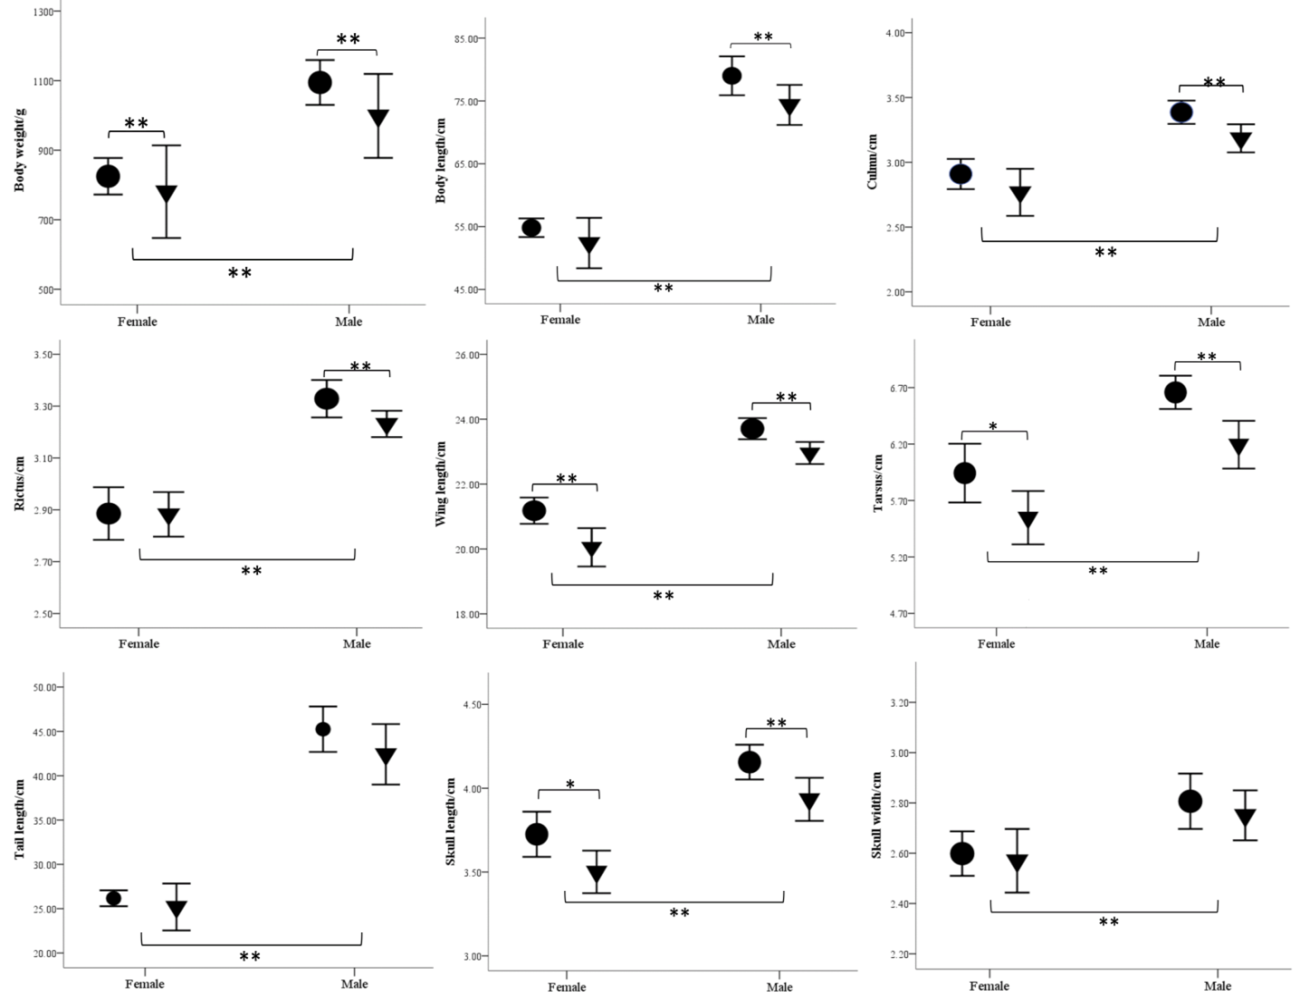
Sexual size dimorphism and variation of morphology of Phasianus colchicus compared at differing altitudes.
Note: Black circles represent the lower altitude population (<1500m); while black triangles represent the higher altitude population (>1500m); Additionally, * represents statistical significance at a 0.05 significance level; while statistical significane at the level of 0.01 is represnted by **.
References
- Alban, G., Jean, B.F., Eric, D., Bernard, G. and Pierre, A.C., 2008. Testing Bergmann’s rule in the presence of potentially confounding factors: A case study with three species of Galerida larks in Morocco. J. Biogeogr., 35: 579-591.
- Andersson, M., 1994. Sexual selection. Princeton University Press. United States of America.
- Ashton, K.G., 2002. Do amphibians follow Bergmann’s rule? Canadian J. Zool., 80: 708-716. https://doi.org/10.1139/z02-049[CrossRef]
- Ashton, K.G. and Feldman, C.R., 2003. Bergmann’s rule in nonavian reptiles: turtles follow it, lizards and snakes reverse it. Evolution., 57: 1151-1163. https://doi.org/10.1111/j.0014-3820.2003.tb00324.x[CrossRef]
- Blackburn, T.M., Gaston, K.J. and Loder, N., 1999. Geographic gradients in body size: a clarification of Bergmann’s rule. Div. Distrib., 5: 165-174. https://doi.org/10.1046/j.1472-4642.1999.00046.x[CrossRef]
- Blackburn, T.M. and Ruggiero, A., 2001. Latitude, elevation and body mass variation in Andean passerine birds. Global Ecol. Biogeogr., 10: 245-259. https://doi.org/10.1046/j.1466-822X.2001.00237.x[CrossRef]
- Braasch, T., Pes, T., Michel, S. and Jacken, H., 2011. The subspecies of the common pheasant Phasianus colchicus in the wild and captivity. World Pheasant Assoc., 2: 6-13.
- Bulgarella, M., Wilson, R.E., Kopuchian, C., Valqui, T.H. and McCracken, K.G., 2007. Elevatio- nal variation in body size of crested ducks (Lophonetta specularioides) from the central high Andes, Mendoza, and Patagonia. Ornitol. Neotrop., 18: 587-602.
- dos Santos Schmidt, E.M., Paulillo, A.C., Santin, E., Dittrich, R.L. and de Oliveira, E.G., 2007. Hematological and serum chemistry values for the ring-necked pheasant (Phasianus colchicus): variation with sex and age. Int. J. Poult. Sci., 6: 137-139. https://doi.org/10.3923/ijps.2007.459.461[CrossRef]
- Dzugan, M., Zielinska, S., Heclik, J., Pieniazek, M. and Szostek, M., 2012. Evaluation of heavy metals environmental contamination based on their concentrations in tissues of wild pheasant (Phasianus colchicus L.). J. Microbiol. Biotechnol. Fd. Sci., 2: 238.
- Gardner, J.L., Heinsohn, R. and Joseph, L., 2009. Shifting latitudinal clines in avian body size correlate with global warming in Australian passerines. Proc. R. Soc. Lond. B: Biol. Sci., rspb20091011. https://doi.org/10.1098/rspb.2009.1011[CrossRef]
- Healy, S. and Price, T., 2008. Speciation in Birds. Genet. Res., 90: 293. https://doi.org/10.1017/S0016672308009403[CrossRef]
- Jin, Y., Liu, N. and Li, J., 2007. Elevational variation in body size of Phrynocephalus vlangalii in the North Qinghai-Xizang (Tibetan) Plateau. Belgian J. Zool., 137: 197-202..
- Kayvanfar, N. and Aliabadian, M., 2014. Distribution, density and biological breeding of white wing pheasant (Phasianus colchicus principalis, Sclater, 1885) in Northeast of Iran. Res. Linguist., 5: 33-45.
- Kececi, T. and ÇÖL, R., 2011. Haematological and biochemical values of the blood of pheasants (Phasianus colchicus) of different ages. Turkish J. Vet. Anim. Sci., 35: 149-156.
- Körner, C., 2007. The use of ‘altitude’ in ecological research. Trends Ecol. Evolut., 22: 569-574. https://doi.org/10.1016/j.tree.2007.09.006[CrossRef]
- Lan, M., Fan, L., Liu, F., Wen, L., Jing, X., Zhu, C., Wang, L., Hu, M. and Zu, X. 2018. The adaptive evolution of the Tree Sparrow (Passer montanus) phenotype to environment factors. Acta Ecol. Sin., 38: 1392-1400. https://doi.org/10.5846/stxb201612152585[CrossRef]
- Liao, J.C., Zhang, Z.B. and Liu, N.F., 2006. Altitudinal variation of skull size in Daurian pika (Ochotona daurica Pallas, 1868). Acta Zool. Acad. Scient. Hung., 52: 319-329.
- Liao, J., Wang, Y., Zhao, L. and Liu, N., 2010. Effects of environmental factors on organ mass of midday gerbil (Meriones meridianus Pallas, 1773). Mammal. Biol. Z. Säuge-tierk., 75: 381-388. https://doi.org/10.1016/j.mambio.2009.11.003[CrossRef]
- Liu, Y., Zhan, X., Wang, N., Chang, J. and Zhang, Z., 2010. Effect of geological vicariance on mitochondrial DNA differentiation in Common Pheasant populations of the Loess Plateau and Eastern China. Mol. Phylogen. Evolut., 55: 409-417. https://doi.org/10.1016/j.ympev.2009.12.026[CrossRef]
- Lu, X., Ke, D.H., Zeng, X.H. and Yu, T.L., 2009. Reproductive ecology of two sympatric Tibetan snow finch species at the edge of their altitudinal range: response to more stressful environments. J. Arid Environ., 73: 1103-1108. https://doi.org/10.1016/j.jaridenv.2009.06.011[CrossRef]
- Mateos, C., 1998. Sexual selection in the ring-necked pheasant: a review. Ethol. Ecol. Evolut., 10: 313-332. https://doi.org/10.1080/08927014.1998.9522846[CrossRef]
- Mayr, E., 1956. Geographical character gradients and climatic adaptation. Evolution, 10: 105-108. https://doi.org/10.1111/j.1558-5646.1956.tb02836.x[CrossRef]
- McNab, B.K., 1971. On the ecological significance of Bergmann’s rule. Ecology, 52: 845-854. https://doi.org/10.2307/1936032[CrossRef]
- Meiri, S. and Dayan, T., 2003. On the validity of Bergmann’s rule. J. Biogeogr., 30: 331-351. https://doi.org/10.1046/j.1365-2699.2003.00837.x[CrossRef]
- Millien, V., Kathleen Lyons, S., Olson, L., Smith, F.A., Wilson, A.B. and Yom-Tov, Y., 2006. Ecotypic variation in the context of global climate change: revisiting the rules. Ecol. Lett., 9: 853-869. https://doi.org/10.1111/j.1461-0248.2006.00928.x[CrossRef]
- Møller, A.P., 1994. Male ornament size as a reliable cue to enhanced offspring viability in the barn swallow. Proceed. natl. Acad. Sci., 91: 6929-6932.
- Musil, D.D. and Connelly, J.W., 2009. Survival and reproduction of pen-reared vs. translocated wild pheasants Phasianus colchicus. Wildl. Biol., 15: 80-88. https://doi.org/10.2981/07-049[CrossRef]
- Olson, V.A., Davies, R.G., Orme, C.D.L., Thomas, G.H., Meiri, S., Blackburn, T.M., Gaston, K.J., Owens, I. P.F. and Bennett, P.M., 2009. Global biogeography and ecology of body size in birds. Ecol. Lett., 12: 249-259. https://doi.org/10.1111/j.1461-0248.2009.01281.x[CrossRef]
- Petrie, M., 1994. Improved growth and survival of offspring of peacocks with more elaborate trains. Nature, 371: 598-599.
- Qu, J., Liu, N., Bao, X. and Wang, X., 2009. Phylogeography of the ring-necked pheasant (Phasianus colchicus) in China. Mol. Phylogen. Evolut., 52: 125-132. https://doi.org/10.1016/j.ympev.2009.03.015[CrossRef]
- Rosenzweig, M.L., 1968. Net primary productivity of terrestrial communities: prediction from climatological data. Am. Natural., 102: 67-74. https://doi.org/10.1086/282523[CrossRef]
- Scholander, P.F., 1955. Evolution of climatic adaptation in homeotherms. Evolution, 9: 15- 26. https://doi.org/10.1111/j.1558-5646.1955.tb01510.x[CrossRef]
- Sheldon, B.C., Merilö, J., Qvarnström, A., Gustafsson, L. and Ellegren, H., 1997. Paternal genetic contribution to offspring condition predicted by size of male secondary sexual character. Proceed. R. Soc. London B: Biol. Sci., 264: 297-302.
- Storz, J.F., 2007. Hemoglobin function and physiological adaptation to hypoxia in high- altitude mammals. J. Mammal., 88: 24-31. https://doi.org/10.1644/06-MAMM-S-199R1.1[CrossRef]
- Storz, J.F., Runck, A.M., Moriyama, H., Weber, R.E. and Fago, A., 2010. Genetic differences in hemoglobin function between highland and lowland deer mice. J. exp. Biol., 213: 2565-2574. https://doi.org/10.1242/jeb.042598[CrossRef]
- Sun, Y.F., Ren, Z.P., Wu, Y.F., Lei, F.M., Dudley, R. and Li, D.M., 2016. Flying high: limits to flight performance by sparrows on the Qinghai-Tibet Plateau. J. exp. Biol., 219: 3642-3648. https://doi.org/10.1242/jeb.142216[CrossRef]
- Sun, Y., Li, M., Song, G., Lei, F., Li, D. and Wu, Y., 2017. The role of climate factors in geographic variation in body mass and wing length in a passerine bird. Avian Res., 8: 1. https://doi.org/10.1186/s40657-016-0059-9[CrossRef]
- Williams, G.C., 1992. Natural selection: domains, levels, and challenges. Oxford University Press. Britain.
- Yom-Tov, Y. and Geffen, E., 2011. Recent spatial and temporal changes in body size of terrestrial vertebrates: probable causes and pitfalls. Biol. Rev., 86: 531-541. https://doi.org/10.1111/j.1469-185X.2010.00168.x[CrossRef]
- Zhang, L., An, B., Backström, N. and Liu, N. 2014. Phylogeography-based delimitation of subspecies boundaries in the common pheasant (Phasianus colchicus). Biochem. Genet., 52: 38-51. https://doi.org/10.1007/s10528-013-9626-5[CrossRef]
- Zheng, G., 2011. A checklist on the classification and distribution of the birds of China, second edition. Science Press. China.
Services
Article usage statistics
Loading…