
Different cancer cell lines display altered–either decreased or increased– proliferation rates when cultivated as 3D tumor spheroids. The presented work aimed to study the interplay between cell proliferation rates and metabolic stress in 2D and 3D cell culture systems. Two cell line models (HepG2; liver cancer cell line and HCT-116; colorectal cancer cell line) were selected that showed inverse proliferation trends under 2D and 3D cell culture systems: HCT-116 displays decreased, while HepG2 displays increased proliferation rates under 3D system. The presented data indicated that the proliferative capacity of the given cell line was associated with its ability to deal with metabolic stress under 2D or 3D system. HCT-116 cells coped better with metabolic stress in 2D system while HepG2 in 3D system.
Short Communication · Volume 52, Issue 1, 8 January 2020 · Open Access
The Ability to Deal with Metabolic Stress Correlates with Cell Proliferation Rates under 2D or 3D Cell Culture System
Affiliations & Notes ⌄
- 1University of the Punjab, Microbiology and Molecular Genetics, Lahore, Pakistan 2Hormone Lab Lahore, Pakistan , * Corresponding author: rimsha.munir08@gmail.com
Article Info ⌄
- Journal:
- Pakistan Journal of Zoology
- Published:
- 8 January 2020

From the article
- HepG2 cells on the other hand were more sensitive to metabolic stress under 2D cell culture system, while the growth of HepG2 tumor spheroids was not significantly affected by serum-deprivation or hypoxia (Fig. 2b).
- This data indicated that the proliferation capacity of the given cell lines was associated with the ability to deal with metabolic stress under 2D or 3D systems.
- HepG2 cells in 3D spheroids display significantly lower levels of TG in comparison to 2D-cultured cells (Supplementary Fig. 1b).
- This increased lipid-load in HCT-116 spheroids could be attributed to increase metabolic stress in these cells under 3D system.
Selected from the article's own text.
Abstract
Materials and methods
HCT-116 (Colon Adenocarcinoma Cell Line) and HepG-2 (Liver Hepatocellular Carcinoma) cell lines were purchased from the American Type Culture Collection (ATCC). Cell lines were cultivated in standard cell culture conditions according to the ATCC guidelines. For low-serum culture conditions RPMI 1640 medium was supplemented with 2%, 4% and 6% FBS. For inducing hypoxia cell culture plates were sealed with paraffin film and placed in anaerobic jar (Oxoid, HP0011) and incubated at 37 °C. Monolayers of cells (2D) were cultured in 24-wells culture plates. Multicellular tumor spheroids (MCTS) were generated by liquid overlay method in flat bottom 96-wells plates.
DNA was extracted using Trizol reagent according to manufacturer’s guidelines. For DNA quantification absorbance was measured using Nanodrop spectrophotometer (Thermo Scientific NanoDrop Lite spectrophotometer). Protein was extracted using NP40 buffer and quantified by Bradford method (Merck Bradford Kit, 110306) according to manufacturer’s guidelines.
For tracking of spheroid growth diameters of 3-6 spheroids were measured for each condition at alternate days (Day 3, 5, and 7). Spheroids were imaged via IRMECO IM-200 inverted light microscope and their diameters were assessed by Scope image 9.0(X5) software.
For determination of triglyceride content Lipids were extracted from cell pellets using a methanol/chloroform extraction method and was spectrophotometrically determined using commercially available kit (Analyticon Biotechnologies AG, Catalogue # 5052) against a calibration-curve generated using known concentrations of triglyceride standard (SUPELCO, 17811-1AMP).
GraphPad Prism version 6 was used for statistical analysis.
Results and discussion
Previous studies have shown that colorectal cancer cells display decreased , while HepG2 cells display increased proliferation rates under 3D system . In order to reconfirm this phenomenon both HCT-116 and HepG2 cells were cultured in 2D and 3D cell culture systems. In accordance with previous studies, HCT-116 cells display decreased proliferation rates in 3D than in 2D cell culture system (Fig. 1a). Cell proliferation rates gave similar trends at three different time-points (day 3, 5 and 7). Conversely, HepG2 cells display increased proliferation rates under 3D cell culture system (Fig. 1b).
Next, the impact of metabolic stress–induced by oxygen- and serum-deprivation– on cell proliferation rates in the selected cancer cell lines was assessed. The cell proliferation rates in these metabolically stressed conditions were compared to that in normoxic full-serum (10%) growth conditions. Interestingly, HCT-116 cells –that also displayed better proliferative capacity in 2D system– were less sensitive to metabolic stress under 2D cell culture system (Fig. 2a). However, the growth of HCT-116 tumor spheroids was significantly reduced under serum-deprived conditions but not under hypoxic conditions. HepG2 cells on the other hand were more sensitive to metabolic stress under 2D cell culture system, while the growth of HepG2 tumor spheroids was not significantly affected by serum-deprivation or hypoxia (Fig. 2b). In this study the impact of metabolic stress on diameter of HCT-116 (Fig. 2c) and HepG2 cells (Fig. 2d) was also studied. The data on spheroids diameter mostly followed the similar trends as above i.e. metabolic stress induced reduced growth of HCT-116 spheroids but not of HepG2 spheroids. This data indicated that the proliferation capacity of the given cell lines was associated with the ability to deal with metabolic stress under 2D or 3D systems. HCT-116 coped better with metabolic stress in 2D system while HepG2 in 3D system. It has been previously reported that cancer cells cultivated under nutrient-deprivation try to up-regulate their metabolic
pathways to compensate for reduced supply of nutrients ; . Only the cell-types capable of sufficiently compensating for limited nutrient supply–via de novo synthesis or activation of alternate pathways– maintain their proliferation rates under metabolic stress.
(Abbreviations: Nor, normal growth conditions; Hyp, hypoxia; LS, low-serum growth conditions).
HepG2 cells are known to display high number of lipid-droplets (LD) under normoxic conditions and are frequently used as a model for studying LD biogenesis. When compared to HCT-116 cells the baseline levels of triglycerides –one of the major components of LDs– were six-fold higher in HepG2 cells (Supplementary Fig. 1a). This high lipid-load in HepG2 cells may also affect their proliferation rates in 3D cell culture system. TG-content in HepG2 cells cultivated under 3D and 2D cell culture systems was compared. HepG2 cells in 3D spheroids display significantly lower levels of TG in comparison to 2D-cultured cells (Supplementary Fig. 1b). It has been proposed that LDs support cancer-cell survival/tumor progression under nutrient-deprivation and the nutrient-deprived cancer cells mobilize lipids from intracellular stores . Cancer cells across a 3D spheroid have differential access to nutrients including lipids –that are abundantly required for cancer cell proliferation and progression. Hence, nutrient-deprived cells within the core of spheroids would have been able to mobilize the stored lipids in LD causing decrease in lipid-deposits in 3D-cultured cells. HCT-116 cells–that have lower baseline TGs–displayed higher TG-content in 3D cultured cells in comparison to 2D-cultured cells (Supplementary Fig. 1c). Previous research reports have shown that cancer cells display increased lipid-load under metabolic stress conditions (Daniëls et al., 2014; . This increased lipid-load in HCT-116 spheroids could be attributed to increase metabolic stress in these cells under 3D system.
Conclusion
The presented work shows that cells’ capability to deal with metabolic stress affects its proliferative capacity under 2D or 3D system. Further, studies are required to understand the molecular mechanisms deriving cell proliferation rates under 2D or 3D systems.
Acknowledgement
Work was supported by Higher Education Commission of Pakistan (Project # 2505/R&D/11-2670).
Supplementary material
There is supplementary material associated with this article. Access the material online at: https://dx.doi.org/10.17582/journal.pjz/2020.52.1.sc8
Statement of conflict of interest
The author declares that they have no conflict of interests.
Figures
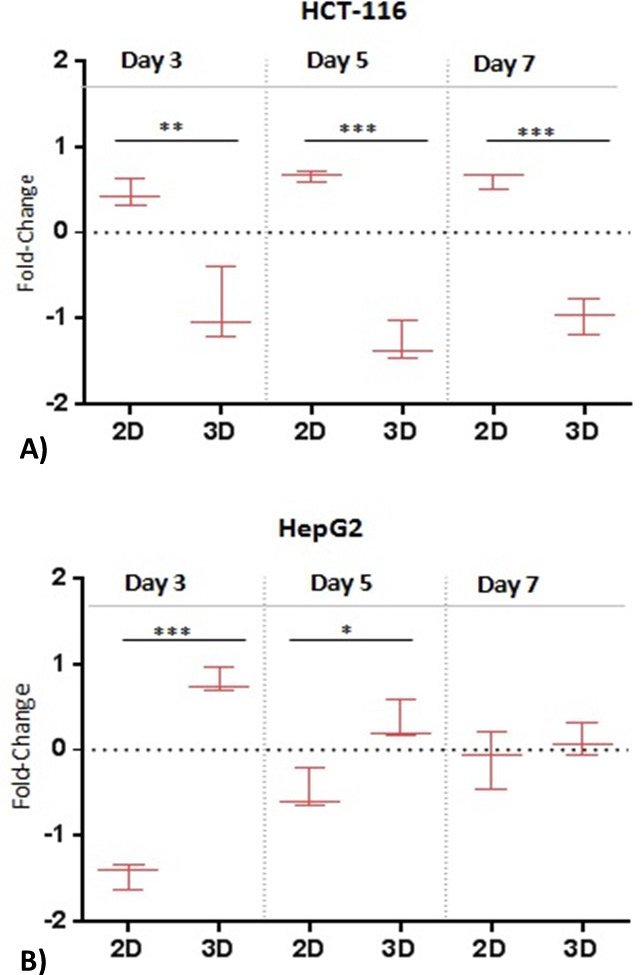
Comparison of proliferation rates in 2D and 3D cell culture systems. (A) HCT-116 and (B) HepG2 cells were cultivated (seeding density; 3x10⁴ cells) in 2D and 3D cell culture systems for 3, 5 or 7 days. At each time point DNA/protein quantification assays were performed to determine cell number. Data were median normalized and LOG2 transformed. Data are representative of three independent experiments. Significance was determined by unpaired t-test. *Significantly different (*p ≤ 0,05; **p ≤ 0,01; ***p≤ 0,001), n.s not significant (p > 0,05).
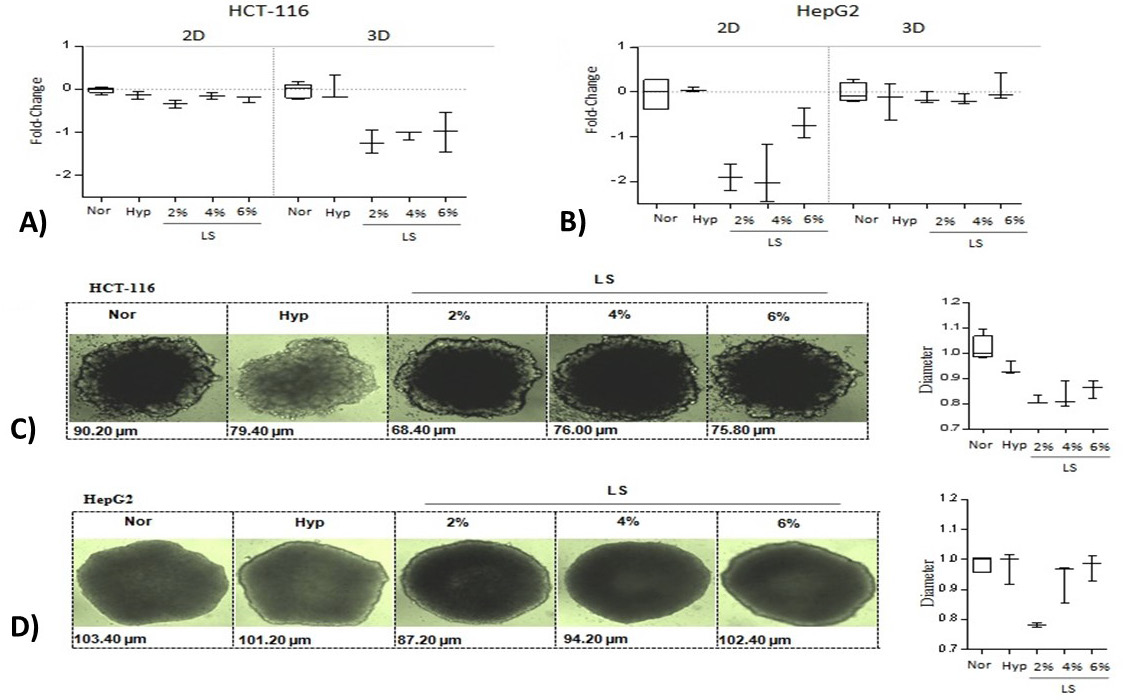
Impact of metabolic stress on cell proliferation rates in 2D and 3D cell culture systems. (A) HCT-116 and (B) HepG2 cells were cultivated (seeding density; 3x10⁴ cells) in 2D and 3D cell culture systems under normal growth conditions (10% FBS; 20% Oxygen), hypoxia (10% FBS; 0% Oxygen) or low-serum growth conditions (2, 4, or 6% FBS; 20% Oxygen). DNA/protein quantification assays were performed to determine cell number. Data were normalized to normal conditions and LOG2 transformed. Data are representative of three independent experiments. Representative microscopy images of (C) HCT-116 and (D) HepG2 spheroids generated in aforementioned culture conditions. The panels on the right compare diameters of the corresponding cell line spheroids. Data were normalized with median of the normal condition.
(Abbreviations: Nor, normal growth conditions; Hyp, hypoxia; LS, low-serum growth conditions).
References
- Baenke, F., Peck, B., Miess, H. and Schulze, A., 2013. Dis. Model Mech., 6: 1353-1363. https://doi.org/10.1242/dmm.011338[CrossRef]
- Casey, R.C., Burleson, K.M., Skubitz, K.M., Pambuccian, S.E., Oegema, T.R., Ruff, L.E. and Skubitz, A.P., 2001. Am. J. Pathol., 159: 2071-2080. https://doi.org/10.1016/S0002-9440(10)63058-1[CrossRef]
- Chang, T.T. and Hughes-Fulford, M., 2008. Tissue Engin. Part A., 15: 559-567. https://doi.org/10.1089/ten.tea.2007.0434[CrossRef]
- Chitcholtan, K., Sykes, P.H. and Evans, J.J., 2012. J. Transl. Med., 10: 38. https://doi.org/10.1186/1479-5876-10-38[CrossRef]
- Daniels, V.W., Smans, K., Royaux, I., Chypre, M., Swinnen, J.V. and Zaidi, N., 2014. PLoS One, 9: e106913. https://doi.org/10.1371/journal.pone.0106913[CrossRef]
- De Schrijver, E., Brusselmans, K., Heyns, W., Verhoeven, G. and Swinnen, J.V., 2003. Cancer Res., 63: 3799-3804.
- Fallica, B., Maffei, J.S., Villa, S., Makin, G. and Zaman, M., 2012. PLoS One, 7: e48024. https://doi.org/10.1371/journal.pone.0048024[CrossRef]
- Gurski, L.A., Petrelli, N.J., Jia, X., Farach-Carson, M.C., 2010. Oncol. Issu., 25: 20-25. https://doi.org/10.1080/10463356.2010.11883480[CrossRef]
- Kamphorst, J.J., Chung, M.K., Fan, J. and Rabinowitz, J.D., 2014. Cancer Metabol., 2: 23. https://doi.org/10.1186/2049-3002-2-23[CrossRef]
- Lin, R.Z. and Chang, H.Y., 2008. Biotechnol. J., 3: 1172-1184. https://doi.org/10.1002/biot.200700228[CrossRef]
- Luca, A.C., Mersch, S., Deenen, R., Schmidt, S., Messner, I., Schafer, K.L., Baldus, S.E., Huckenbeck, W., Piekorz, R.P., Knoefel, W.T., Krieg, A. and Stoecklein, N.H., 2013. PLoS One, 8: e59689. https://doi.org/10.1371/journal.pone.0059689[CrossRef]
- Maria, O.M., Maria, O., Liu, Y., Komarova, S.V. and Tran, S.D., 2011. Int. J. Biochem. Cell. Biol., 43: 622-631. https://doi.org/10.1016/j.biocel.2011.01.001[CrossRef]
- Noreen, A., Bukhari, D.A. and Rehman, A., 2018. Pakistan J. Zool., 50:1601-1998. http://dx.doi.org/10.17582/journal.pjz/2018.50.5.1951.1963[Full text][CrossRef]
- Wong, S., El, A., Griffin, P., Nishi, Y., Pease, F. and Plummer, J., 2007. Monolithic 3D integrated circuits, VLSI technology, systems and applications, VLSITSA 2007. International Symposium on. IEEE., pp: 1-4. https://doi.org/10.1109/VTSA.2007.378923[CrossRef]
Supplementary material
Cited by 1 article
In journals published by ResearchersLinks.
Services
Article usage statistics
Loading…