
Stable isotope analysis of feathers is widely used in bird ecology. Generally, studied birds should be captured to collect feather samples in a way that clarifies the attribution of feather samples. As some endangered birds cannot be captured, feather sampling is the only feasible method for isotopic research. However, whether it can be used for research on individuals remains to be clarified. In this study, the values of δ13C and δ15N of the rachises and barbules of 27 feathers from 3 pigeons were measured, and cluster analysis of these samples was carried out by using the system clustering method. The results showed a significant difference between the isotope values of the rachis and barbules from the same feather. In addition, the isotope values of the rachises and barbules differed between individuals, although the food sources of the samples might be slightly different. Based on the above results, the cluster analysis was able to distinguish individuals, with the highest accuracy of 85%; the more factors that were used, the higher the accuracy of the clustering.
Short Communication · Volume 55, Issue 3, 20 April 2023 · Open Access
Stable Isotope Analysis of Feathers as a Potential Method for Distinguishing Individual Birds
· · · · ·
Affiliations & Notes ⌄
- 1College of Life Science, Jilin Normal University, Siping 136000, Jilin Province, P.R. China 2College of Tourism and Geographical Science, Jilin Normal University, Siping 136000, Jilin Province, P.R. China. * Corresponding author: guodongyi@126.com
Article Info ⌄
- Journal:
- Pakistan Journal of Zoology
- Published:
- 20 April 2023

From the article
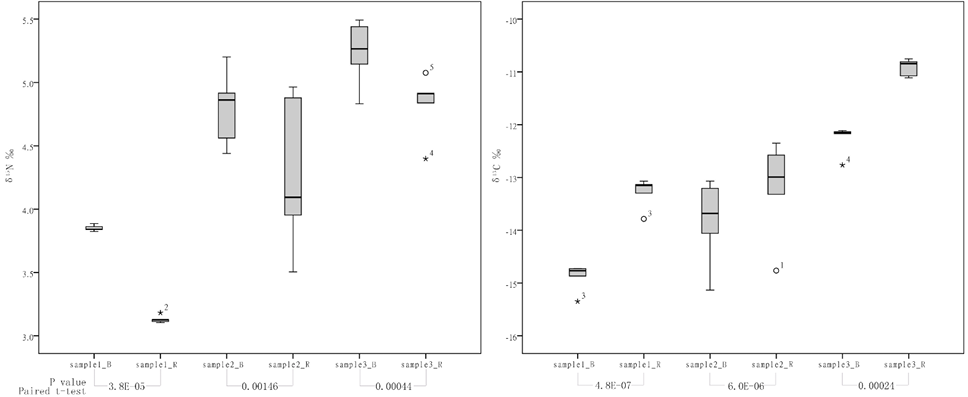
- Paired t-tests were carried out on the δ15N and δ13C values in the barbules and rachis of each feather sample, and the results showed that all p values were less than 0.01, indicating that the stable isotope values of different parts of the same feather were significantly different (Fig. 1).
- Further analyses (paired t-test) of the isotope values of barbules and rachis samples from different pigeons showed that there were significant differences in the isotope values between the different individuals because most of the p values of either the barbules or rachises were less than 0.01.
- All feather samples from individual 3 were grouped into one cluster, and the clustering accuracy was 85.2% (Fig. 2B).
- Stable isotopes might be used to distinguish the individuals since there are differences in isotope values in different genders, ages and types of bird feathers.
Selected from the article's own text.
Abstract
Materials and methods
Feather samples were clipped from the flight feathers of three pigeons, which were the experimental materials of the zoology department at Jilin Normal University, who purchased them from pigeon farmers. These pigeons were fed only corn when they were in the dovecote. However, these pigeons might also have had other dietary supplements because they were usually set free and allowed to fly over the city.
After these pigeons were dissected, several primaries were selected. Each feather sample was soaked in 1 M HCl acid for 2 h to remove inorganic carbon from the feather surface. It was rinsed in distilled water several times after acidification and dried in an oven at 50 °C. Then, the barbules were separated from the rachis of each feather and divided into an average of two groups of separated barbules and rachises as carbon dioxide samples and nitrogen samples for analyses of the carbon isotopes and nitrogen isotopes, respectively. Each carbon dioxide sample was washed in 0.25 M NaOH solution for degreasing, rinsed in distilled water, dried in an oven at 50 °C again to constant weight, and ground to fine powder using a liquid nitrogen cooled impactor mill. After filtration with a 100-mesh sieve, 0.35 mg of feather material was weighed into silver capsules. Each nitrogen sample was ground to a fine powder using a liquid nitrogen cooled impactor mill and filtered with a 100-mesh sieve. The feather material (0.35 mg) was weighed into silver capsules and combusted under helium flow in a Thermo Scientific ITQ 700™ (Thermo Fisher Scientific, USA) at 1350 °C. Stable isotope enrichment was expressed in conventional notation as follows:
δ X = 1,000 (Rsample/Rstandard-1)
where X is 13C or 15N, and R is the corresponding ratio of 13C/12C or 15N/14N. The values for Rstandard of 13C and 15N are PDB and atmospheric nitrogen from air, respectively.
The differences in isotopic content between the different samples were analysed by two tailed t-tests of the paired samples. The box diagram of the sample number and the scatter diagram of the different samples were drawn by SPSS 21 software (IBM, USA). The cluster analysis of the samples was completed by using the hierarchical clustering method and SPSS 21 software. The ratios of δ13C to δ15N were used as the clustering factors, and the number of clustering groups was 3.
Results
The feather isotope values of the three pigeons were obtained (Fig. 1). The maximum value of δ15N in the barbule samples was 5.492%, and the minimum value was 3.529%. In contrast, the maximum and minimum values in the rachis samples were 5.072% and 2.951% respectively. The maximum value of δ13C in the barbule samples was -12.112%, and the minimum value was -15.621%. The maximum value in the rachis samples was -10.755%, and the minimum value was -14.764%. Paired t-tests were carried out on the δ15N and δ13C values in the barbules and rachis of each feather sample, and the results showed that all p values were less than 0.01, indicating that the stable isotope values of different parts of the same feather were significantly different (Fig. 1).
Further analyses (paired t-test) of the isotope values of barbules and rachis samples from different pigeons showed that there were significant differences in the isotope values between the different individuals because most of the p values of either the barbules or rachises were less than 0.01. The only exception was that there was no significant difference between sample 1 and sample 2 in the δ13C values of the rachises, and the P value was greater than 0.05. In addition, the P value of the difference in the δ15N of the barbules from sample 2 and sample 3 was less than 0.05 but greater than 0.01 (Table I).
According to the scatter diagram with δ13C and δ15N of different parts of the feather as the horizontal and vertical coordinates, it can be seen that three samples could basically cluster together (Fig. 2A). Further analysis was conducted with the values of δ13C and δ15N as the clustering factors. The feather samples from individual 1 were clustered into one cluster, while feather samples 1, 6, 9 and 10 from individual 2 were clustered together with the feather samples from individual 1, and the rest were grouped into another cluster. All feather samples from individual 3 were grouped into one cluster, and the clustering accuracy was 85.2% (Fig. 2B). When only the value of δ15N was used as a clustering factor, feather samples 1, 6, 9 and 10 from individual 2 and all samples from individual 1 were clustered together, and the remaining samples of individual 2 and sample 4 in individual 3 were grouped into one cluster, with a slightly lower accuracy of 81.5% (Fig. 2C). However, when only the value of δ13C was used as a clustering factor, samples 2 and 4 from individual 2 were grouped together, and the remaining samples from individual 2 were clustered with all samples from individual 1. Although all samples from individual 3 were grouped together, the accuracy was only 70.4% using this method (Fig. 2D).
Table I. Two tailed t-tests of δ13C and δ15N in different parts of the feathers between different samples.
| Samples | Barbule_δ15N | Barbule_δ13C | Rachis_δ15N | Rachis_δ13C |
| sample1/sample2 | 8.64E-06 | 0.0033 | 0.0004 | 0.4979 |
| sample1/sample3 | 6.44E-05 | 4.78E-05 | 0.0016 | 2.38E-06 |
| sample2/sample3 | 0.0245 | 9.44E-09 | 1.61E-06 | 2.18E-10 |
Discussion
Isotopic effects are often present in chemical, physical and biological processes . After an animal consumes food, the isotopes from the food are fractionated in the tissues by metabolism . Due to the diversity of fractionation in the different tissues and differences in the stable isotopic compositions of the diets at different times and in different places, variations and changes in stable isotope ratios are often found in tissues from the same individual and even in different parts of the same tissue . In avian feathers, the stable isotopic compositions can often be related predictably to the isotopic ratios of the local environment during nutrient uptake at the nestling stage or later during the annual moult . Because obtaining feather samples is relatively easy and does little harm to birds, it has become very common in ecological research. A study on the northern fulmar showed that there is considerable variation in both the δ13C and δ15N values of some types of feathers but no significant difference between the δ13C and δ15N values of the tips and the bases of primaries 2, 6 and 10 . In our study, isotopic signatures differed markedly between the rachises and barbules of pigeons, suggesting that different parts of the feathers from some birds had varying fractionation ratios. The maximum difference in the δ13C value between the barbules and the rachis reached 2.431%, which even exceeds the threshold for distinguishing samples from different regions in some studies, such as a definition from Solovyeva et al. (2014) that marine signatures were defined by δ13C values >-18% and brackish signatures were defined by δ13C values >-20%. Thus, follow-up isotopic studies should not simply describe the extraction of primary plumes for isotopic determination and explain the specific sampling location in detail, such as the barbules, rachis, or both, which may ensure data sharing.
Currently, most feather samples are obtained through clipping or picking feathers from captured birds by mist nets or potter traps to mark the gender, age and other information of the research objects during the sampling process . Therefore, these methods were non-destructive but not non-invasive. For some very endangered species, capture or even disturbance is not allowed, and gathering the feathers left by the birds might be the best choice. However, the biggest problem in gathering feather samples in the field is that it is difficult to accurately link individuals to their feathers. Although molecular biological methods such as STR analysis can solve this problem , DNA cannot always be extracted successfully from feather samples. Stable isotopes might be used to distinguish the individuals since there are differences in isotope values in different genders, ages and types of bird feathers. As with wild birds, the food sources obtained may be different during the process of feather regeneration. Sometimes, small dietary differences may be reflected in the feather isotope content of different individuals with different metabolic rates. In this study, the sampled pigeons often ate only corn when they were in the dovecote. However, they might have foraged different food when they were released into the areas of the city every day. Therefore, there were significant differences in the stable isotope values among the three samples. Based on the ratios of δ13C to δ15N that were used as clustering factors, the clustering analysis could distinguish the individuals to a certain extent, with the highest accuracy of 85%. The more factors that are used, the higher the accuracy of clustering. Therefore, in the later research process, it may be better to assess individuals in different areas with more than two isotopes.
Statement of conflict of interest
The authors have declared no conflict of interest.
Figures
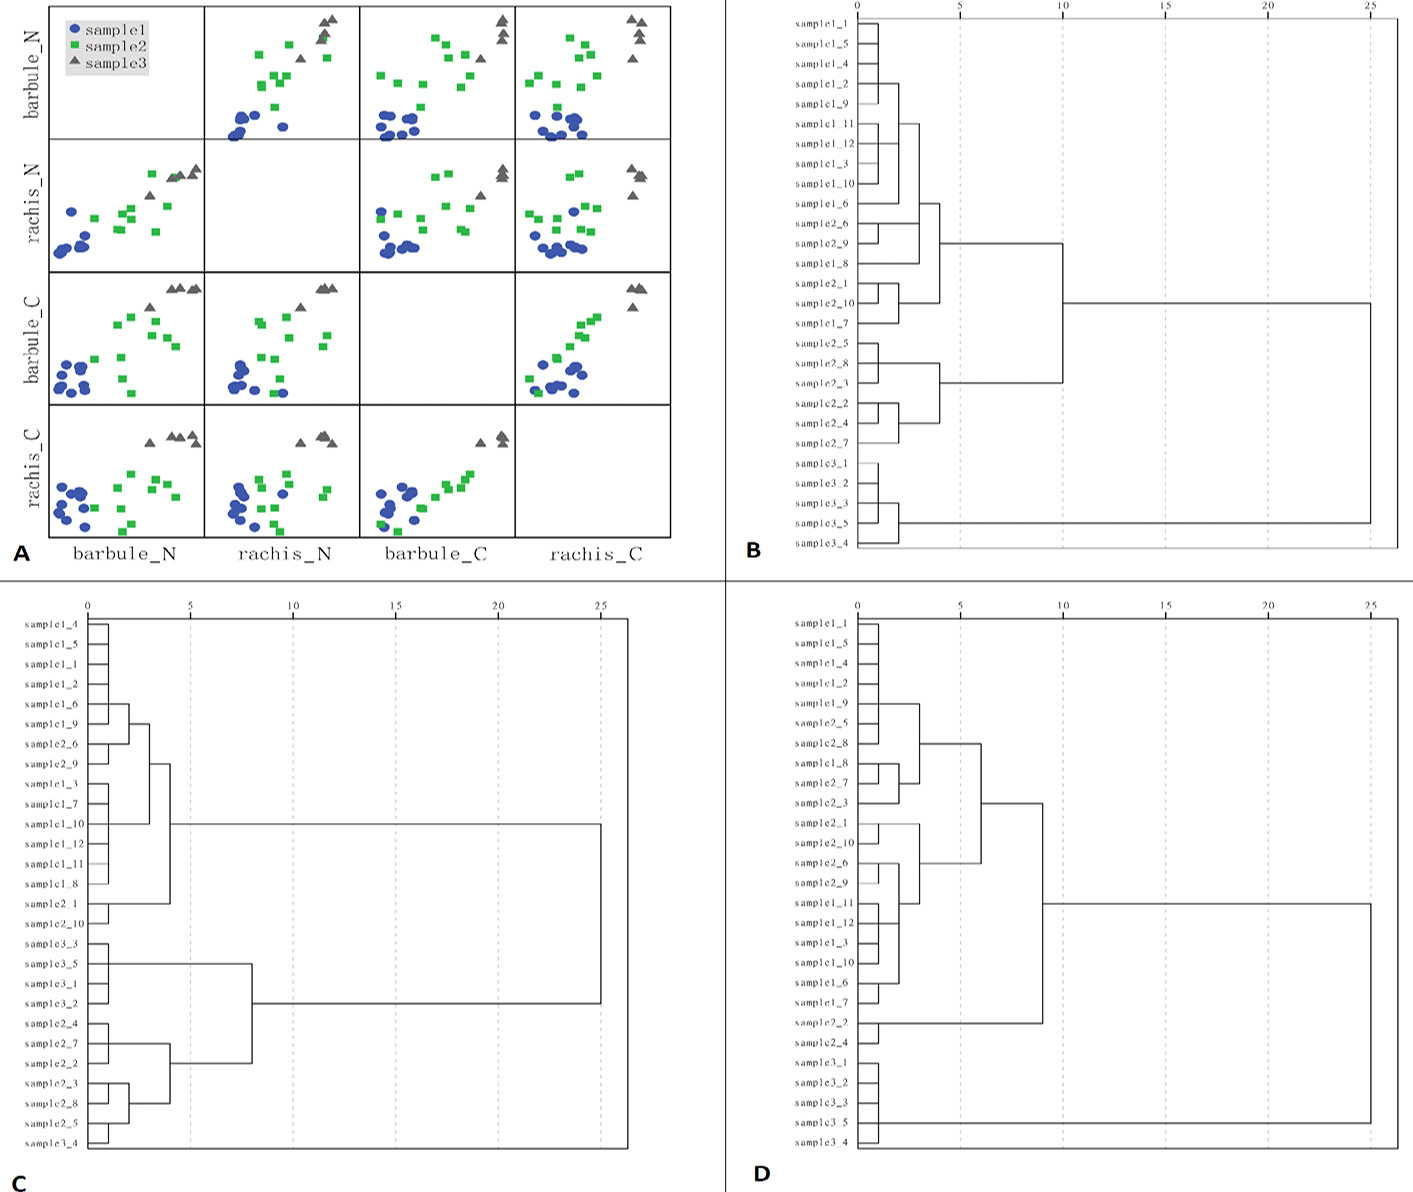
Cluster analysis based on the isotope values in different parts of the feathers. A, Scatterplot matrices from the values of δ13C and δ15N of barbules and rachis. B, Hierarchical cluster from the values of the isotopes from the barbules and rachis. C, Hierarchical cluster from the values of δ13C and δ15N from the barbules. D, Hierarchical cluster from the values of δ13C and δ15N from the rachis.
References
- Alisauskas, R.T., Klaas, E.E., Hobson, K.A. and Ankney, C.D., 1998. J. Field Ornithol., 69: 262-268.
- Bowen, G.J., Wassenaar, L.I. and Hobson, K.A., 2005. Oecologia, 143: 337-348. https://doi.org/10.1007/s00442-004-1813-y[CrossRef]
- Carleton, S.A., Rio, C.M.D. and Robinson, T.J., 2015. J. Wildl. Manage., 79: 948-956. https://doi.org/10.1002/jwmg.916[CrossRef]
- Chabot, A.A., Hobson, K.A., Wilgenburg, S.L.V., Mcquat, G.J. and Lougheed, S.C., 2012. PLoS One, pp. 7. https://doi.org/10.1371/journal.pone.0043627[CrossRef]
- Franks, S.E., Lank, D.B., Norris, D.R., Sandercock, B.K., Taylor, C.M. and Kyser, T.K., 2009. J. Field Ornithol., 80: 51-63. https://doi.org/10.1111/j.1557-9263.2009.00205.x[CrossRef]
- Gannes, L.Z., Rio, C.M.M.D. and Koch, P.L., 1998. Comp. Biochem. Physiol. A Mol. Integ. Physiol., 119: 725-737. https://doi.org/10.1016/S1095-6433(98)01016-2[CrossRef]
- Inger, R., and Bearhop, S., 2008. IBIS, 150: 447-461. https://doi.org/10.1111/j.1474-919X.2008.00839.x[CrossRef]
- Mazerolle, D.F., Hobson, K.A. and Wassenaar, L.I., 2005. Oecologia, 144: 541-549. https://doi.org/10.1007/s00442-005-0031-6[CrossRef]
- Peterson, B.J. and Fry, B., 1987. Annu. Rev. Ecol. Syst., 18: 293-320. https://doi.org/10.1146/annurev.es.18.110187.001453[CrossRef]
- Rubenstein, D.R. and Hobson, K.A., 2004. Trends Ecol. Evol., 19: 260-263. https://doi.org/10.1016/j.tree.2004.03.017[CrossRef]
- Solovyeva, D., Hobson, K.A., Kharitonova, N., Newton, J., Fox, J.W., Afansyev, V. and Fox, A.D., 2016. J. Ornithol., 157: 663-669. https://doi.org/10.1007/s10336-015-1319-x[CrossRef]
- Solovyeva, D., Newton, J., Hobson, K., Fox, J.W., Afanasyev, V. and Fox, A.D., 2014. IBIS, 156: 466-471. https://doi.org/10.1111/ibi.12133[CrossRef]
- Thompson, D.R. and Furness, R.W., 1995. Auk, 112: 493-498. https://doi.org/10.2307/4088739[CrossRef]
- Wassenaar, H.L.I., 1997. Oecologia, 109: 142-148. https://doi.org/10.1007/s004420050068[CrossRef]
- Wunder, M.B., and Norris, D.R., 2008. Ecol. Appl. Publ. Ecol. Soc. Am., 18: 549-559. https://doi.org/10.1890/07-0058.1[CrossRef]
Services
Article usage statistics
Loading…