
Breast cancer is a growing cause of mortality in females across the world. Studies have shown that breast cancer incidence is variable depending upon various factors like ethnicity among others. For a better success rate in breast cancer treatment with minimum side effects, the world is now focusing on a precision medicine approach for breast cancer treatment. In precision medicine, patient-specific gene mutation (genetic biomarkers) provides the guideline to use a specific drug in a specific dose for a specific patient. The PI3K/AKT1/MTOR (PI3K) pathway is crucial for normal cellular processes. Several activating factors and genetic mutations, in associated genes (PIK3CA, AKT1, MTOR and PTEN), lead this pathway to function abnormally to trigger breast cancer. The mutations in these genes were explored in female patients with breast cancer. The demographic studies showed that all the patients were married, housewives with an average age of 47 years. The invasive ductal and invasive lobular carcinoma were detected in 85% and 15% of cases of all breast cancer patients. These tumors were classified into G1, G2 and G3 grades with an incidence of 12.5%, 42.5% and 45%, and grouped into the anatomic stages IIIA, IIIB and IIIC with 50%, 32.5% and 17.5% respectively. Further, molecular subtyping was done on the bases of cellular expression of hormone receptors by IHC and found 80% Luminal A, 12.5% Luminal B, 5% HER2 enriched and 2.5% Basal-like. Screening of mutations in PIK3CA, AKT1, MTOR and PTEN genes was carried out and analyzed by Next Generation Sequencing (NGS) using the Whole Exome Sequencing (WES) to explore possible mutations in PIK3CA, AKT1, MTOR and PTEN genes. The results revealed that there were 3 mutations namely Q546K, E545K and H1047R were present in the PIK3CA gene. AKT1gene has 2 mutations E17K, and E242 (silent mutation). MTOR gene has 2303, L2208, S1851, A1577, AN999 and D479 mutations, which were found to be silent. PTEN gene has shown 3 mutations R130G, R130Q and R173C. In-silico analysis of SNPs (PIK3CA, AKT1, MTOR and PTEN genes) confirmed that these mutations were responsible for cancer in respective patients under study.
Research Article · Volume 56, Issue 1, 17 December 2023 · Open Access
Mutation Profiling of PI3K/AKT1/MTOR Pathway Genes in Breast Cancer Patients of Pakistan
· · ·
Affiliations & Notes ⌄
- 1Institute of Zoology, University of the Punjab, Quid-E-Azam Campus, Lahore, Pakistan 2Institute of Industrial Biotechnology, GC University, Katchehri Road, Lahore, Pakistan 3School of Biological Sciences, University of the Punjab, Quaid-E-Azam Campus, Lahore, Pakistan * Corresponding author: farah.zool@pu.edu.pk
Article Info ⌄
- Journal:
- Pakistan Journal of Zoology
- Published:
- 17 December 2023

Abstract
Introduction
Cancer is an uncontrolled cell growth associated with switching on and off or overexpression/under-expression of certain genes. The changes in the normal expression of genes are the results of gene mutations that may occur due to the involvement of environmental and genetic risk factors . It is not a single disease but an accumulation of various illnesses and can occur in any part of the body Due to the involvement of multiple factors, it is difficult to treat cancer, however some types of cancers can be treated successfully if diagnosed at an early stage ; ; ; .
In females, breast cancer is the largest cause of death It can be initiated regardless of age, ethnicity, socioeconomic condition and geographical location. Studies indicated that the burden of breast cancer globally would be more than 2 million by 2030 ; . It has several types depending upon its localization and spread. It can metastasize to other parts of the body. It is the more studied type of cancer, has several treatment approaches, and is being treated successfully. Almost all breast cancer types are treatable if diagnosed early Due to breast cancer, the mortality rate has decreased significantly since the implementation of modern therapeutic strategies such as targeted therapy and precision medicine ; .
During the past years, chemotherapy was the only option available to treat breast cancer however, its effects were not globally similar furthermore, the side effects of chemotherapy led the researchers to investigate further for better treatment strategies with no or minimal side effects .
Recently, the Precision medicine approach for cancer treatment is the focus of research, development of new and associated drugs and their clinical trials for their efficacy. Cancer precision medicine aims to provide the right dose of the right drug for the right patient at the right time, which is based on the genetic profiles of cancer . It is however very important to screen mutations of responsible genes for precise identification of precise therapy.
In the context of breast cancer, comprehensive sequencing of breast tumor tissues, identified frequently mutated genes that include PIK3CA, TP53, GATA3, PTEN, AKT1, CDH1, ARID1B, CASP8, BRCA1, RB1, MLL3, MAP3K1, MAP3K13, NCOR1, SMARCD1, CDKN1B, TBX3, RUNX1, CBFB, AFF2, PIK3R1, PTPN22, PTPRD, NF1, SF3B1 and CCND3 as well as copy number alterations in PIK3CA, ERBB2, TP53, MAP2K4, MLL3, CDKN2A, PTEN and RB1 (Cancer Genome Atlas, 2012; . Somatic mutations in TP53, PIK3CA and GATA3 occurred at >10% incidence across all breast cancer (Cancer Genome Atlas, 2012)
The countries with advanced biological research are far ahead of our country regarding the involvement and utilization of genomic data to treat breast cancer. A recent study carried out in China showed an active role of PIK3CA gene mutation in Chinese breast cancer patients . A similar study has also been conducted on Singapore Chinese patients , Turkey , South India , 2017), Arabian Peninsula , Sardinia , United States .
Now a days several diagnostic laboratories offer gene mutation detection services commercially for the precision medicine treatment approach. The current study aims at screening breast cancer patients for mutations in PIK3CA, AKT1, MTOR and PTEN genes to establish their diagnostic potential. The detected mutations may become therapeutic markers for precision medicine.
Materials and Methods
Sample collection
In this study, forty female patients of breast cancer with advanced breast cancer were recruited and admitted to a local hospital for MRM (modified radical mastectomy). The tumor samples were collected after formal approval of the hospital’s ethical committee. The patients were formally informed about the study, and sample collection and obtained demographic data via filling out a questionnaire.
At least six pieces of fresh tumor tissues were collected immediately after surgery as well as two pieces from adjacent normal breast tissues. A competent pathologist identified them as a tumor before proceeding further. Half of these pieces were snap frozen within 10 mins and stored at -86℃ while the rest were put into formaldehyde solution for fixation. The former tissues were used for genetic analysis while the latter was for routine histopathology procedures and immunohistochemical studies (IHC) for cancer diagnosis and characterization.
Histopathological staining
Histopathological studies were conducted on breast tumor tissues (39-80 mm). The tissues both tumor and normal were fixed in 10% formaldehyde (overnight), dehydrated with various grades of alcohols (75%, 90% and absolute), washed with xylene at room temperature for I hour and embedded in paraffin at 56°C for an hour. Sections ( 4µm) were cut and were processed for immun- histo-chemical (IHC) and H&E staining .
IHC staining was performed to evaluate the status of estrogen receptor (ER), progesterone receptor (PR) and human epidermal growth factor receptor 2 (HER2/neu). Negative control slides were also included in the workflow.
Sections were depararfinized, dehydrated with various alcohol grades, subjected to epitope retrieval with Tris-EDTA buffer using a pressure cooker. These tissues were then processed, demonstration of estrogen receptor (ER), progesterone receptor (PR) and human epidermal growth factor Receptor 2 (HER2) receptors using kits for these staining following the manufacturers instructions, based on Buchwalow and Bocker (2010).
For ER staining, recombinant anti-estrogen receptor alpha antibody Cat no. ab16660 from Abcam at a concentration of 1/200; for PR staining recombinant anti-progesterone receptor antibody [SP2] Cat No. ab16661 from Abcam. at a concentration of 1/400; and for HER2 Recombinant Anti-ErbB2 / HER2 antibody [SP3], Cat No. ab16662 from Abcam at a concentration: 1/100 was used. All these antibodies were diluted to the required concentration in Antibody Diluent Cat no. ab64211 from Abcam. Further, Rabbit Specific HRP/DAB (ABC) Detection IHC Kit Cat No. ab64261 from Abcam was used for the detection of primary antibodies (specific to ER, PR and HER2) conjugated to their specific sites on specific tissues.
The ER and PR were interpretation by Allered score method summarized in (Supplementary Table I) while for HER2/neu in Supplementary Table II .
Isolation of nucleic acids
Genomic DNA was extracted from tumor tissues snap frozen at the time of sampling using a commercially available DNA isolation kit from Qiagen QIAamp Fast DNA Tissue Kit Cat. no. 51404. The integrity and concentration of isolated DNA was determined by running it on 1 % agarose gel along with 1kb DNA marker .
Next generation sequencing (NGS)
In-silico analysis
In-silico analysis was performed for confirmation and characterization of transcribed mutated proteins in response to the gene mutations.
Molecular modelling and molecular dynamics simulation
To assess the structural stability of the natural and metamorphosed protein we used a structure analysis algorithm. Most of the protein crystal structures were obtained from the PDB (Protein Data Bank). Functional consequences of some of these proteins, synonymous, missense, and silent. Even though most SNPs are synonymous structures . The variants of the structure were mapped using Modeller 9.11 software . Moreover, using the NAMD 2.6 software researcher applied energy minimization and molecular dynamics simulation methods to investigate the structural significant variations in the metamorphosed protein concerning natural structure .
Homology modelling
Modeller 9.1.1 was used for homology modelling to create a 3-dimensional structure of a protein from its amino acids using comparative modelling. Modelling of 4 different sequenced genes ATK1, PIK3CA, PTEN and MTOR was undertaken. Modeler 9.1.1 was installed, and various python scripts were used to execute each step. This was done in a series of steps in which at first targeted sequence was obtained from NCBI followed by searching for template structure, aligning query sequence with template and model building. SNPs of different genes obtained from NGS were used as the target sequence. These SNP sequences were then converted into amino acids sequence by using expasy translational tool to use as the target sequence. After that BLAST-P was used to retrieve the crystallized structure of related proteins which was further used to choose the template sequence. A python script was used to align both target and template sequences. A model was constructed at the end by using a modeler interface.
Molecular dynamic simulation
To analyze the stability of particles within a 3D-modelled structure molecular dynamic structure was used. Nanoscale molecular dynamics software was used for this purpose along with accessory Software VMD, open babel. All mutant variant of proteins was subjected to MD simulation to analyze their structure and causes which leads to cancer.
At first, the modelled structure was loaded in VMD software to generate a protein structure file which contains all molecules specific information needed to apply forcefield. After that solvation box was added and an energy minimization step was performed. Protein cell coordinates were retrieved and wrote a python script to run the simulation. The last simulation was performed. RMSD, RMSF, RG, and SASA analyses were done to analyze simulation results.
Results and discussion
Demographic characteristics
The demographic characteristics of our study subjects are shown in Table I. All subjects were married, housewives wiht mean age of 47 years. Parity status ranged between 0 and 13.
Table I. Epidemiological data of the patients with breast cancer in our study.
| Variables | N | Mean±SD (Min- Max) |
| Age (years) | 40 | 47.37±8.2 (33.00 -68.00) |
| Parity (No.) | 40 | 3.55±2.1 (0 -13) |
| Household income (Rs.) | 40 | 36625± 896.5 (20,000 -55,000) |
Forty percent of the breast cancer patients belonged to the age group 40–49 years while 7.5% were from the age group 60-69 years (Table II).
Histopathology
Histopathological studies of these tumors showed a mixed population of invasive ductal carcinoma in 85% of cases (Fig. 1), and lobular carcinoma in 15% cases of all patients (Fig. 2). Other researchers like Thomas et al. (2019) reported that 5-10% of breast cancer cases were lobular carcinomas while 88.4% had ductal carcinomas as reported earlier by Hoffmann et al. (2018). This increased incidence in Pakistani patients could be due to the increasing trend in breast cancer. It is already reported that every year breast cancer incidence is increasing from 0.7 to 0.8 % in some populations and 1.8 % in Asian and Pacific Iceland .
Tumor grades and anatomic stage groups
Forty-five percent of the samples were of G3 grade; of these 20% were from patients of the age group 40-49 years, while 5% were from patients of the age group 30-39 years (Table II). Copeland et al. (2021) reported the breast cancer grades in the Jamaican population as G1: 8%, G2: 44% and G3: 39%. Our findings are almost concordant with this study except for G1 which is 12.5% in our study.
Table II. Incidence (%) of various tumor grades (G1, G2, G3) and anatomic stage groups (IIIA, IIIB, IIIC) of tumor samples collected from female breast cancer patients of different age groups.
| Age groups (years) | Subjects (n) | Incidence (%) of tumor grade | Incidence (%) of anatomic stage groups | ||||
| G1 | G2 | G3 | IIIA | IIIB | IIIC | ||
| 30-39 | 7 | 2 | 10 | 5 | 10 | 2.5 | 5 |
| 40-49 | 16 | 7.5 | 12.5 | 20 | 27.5 | 10 | 2.5 |
| 50-59 | 14 | 2.5 | 20 | 12.5 | 12.5 | 17.5 | 5 |
| 60-69 | 3 | 0 | 0 | 7.5 | 0 | 2.5 | 5 |
| Total | 40 | 12.5 | 42.5 | 45 | 50 | 32.5 | 17.5 |
Table III. Immunostaining for molecular sub typing of breast cancer.
| S. No. | Estrogen receptor | Progesterone receptor | HER 2 receptor | Hormone receptor status | Molecular sub-types | Percent prevalence |
| 1 | + | + | - | HR+/HER2- | Luminal A | 80 |
| 2 | + | +/- | + | HR+/HER2+ | Luminal B | 12.5 |
| 3 | - | - | + | HR-/HER2+ | HER2 enriched | 5 |
| 4 | - | - | - | TNBC | Basal-like | 2.5 |
Breast tumors were also categorized into various anatomic stage groups in the current study. The results showed that all the tumors belonged to stages IIIA to IIIC with an incidence of 50%, 32.5% and 17.5% respectively. Patients with stage I, II and IV tumors were not detected in this study. According to another study conducted by Yazdani-Charati et al. (2019) the incidence of breast cancer stages was for 26.9% IIIA, 16.0 IIIB, and 3.5% IIIC. A comparison of both studies has shown that the incidence of cancer anatomic stages IIIA, IIIB and IIIC is higher in patients in our study (Table III).
Molecular sub-types of breast cancer
Breast cancer tumor samples were categorized into 4 molecular subtypes, based upon the status of hormone receptor expression (ER, PR and HER2) (Fig. 3). We recorded Luminal A, Luminal B, HER2 enriched and basal like subtypes as 80%, 12.5 %, 5% and 2.5 %, respectively (Table III). Al-Thoubaity (2020) showed a 58% incidence of Luminal A, 13% of Luminal B, 11.5% of HER2, and based-like (triple negative breast cancer) was 16%. Our study shows a high incidence of molecular sub-types as compared to that of the Al-Thoubaity.
Pandit et al. (2020) have reported 37% of Luminal A, 8% Luminal B, 11 % HER2 enriched, and 26% basal-like. Mane et al. (2015) have shown 43.8% of Luminal A, 14.8% luminal B, 16.1% basal-like and 16.1% of HER2. All these studies showed the highest incidence of Luminal A sub-type while other sub-types showed varied incidences. Furthermore, the results of our study showed a close agreement.
Mutations detected in PIK3CA, AKT1, MTOR and PTEN genes
PI3K/AKT1/MTOR (PI3K pathway) is an intracellular pathway that plays its role in the cell cycle. It consists of two subunits namely a regulatory (p85) and catalytic (p110) . These PI3Ks function by phosphorylation of downstream PIP2 into PIP3 which further phosphorylates AKT.
MTOR is downstream of PI3K and AKT refers to two complexes namely mTORC1 and 2 with different modes of action . Various therapies are used to inhibit these genes to cure cancer.
Further PTEN a tumor suppressor, reverses phosphorylation of PIP2 to PIP3 to neutralize the oncogenic signaling. The loss of function of these genes can trigger the pathway to start oncogenic signaling.
In the samples under investigation we have detected three mutations each in PIK3CA and PTEN, 2 mutations in AKT1 and 6 mutations in MTOR genes. Table IV shows somatic mutations in PIK3CA and AKT1 genes.
PIK3CA gene was found mutated in 35% of all cases. Three hotspots and substitution Q546K, E545K and H1047R in 2%, 12.5%, and 20% cases, respectively was observed. These are missense and pathogenic. Of these Q546K, and E545K was in the regulatory domain while H1047R was in the catalytic domain of the respective proteins (Table IV). The other studies have reported that overall PIK3CA mutations are in 18-40% of breast cancer cases with an average of 26% in reported in the Catalogue of Somatic Mutations in Cancer database (COSMIC), depending on the studied population . Our finding of PIK3CA gene mutations is in concordance with the published data.
Mutations in the AKT1 gene was observed in 5% of patients of this study. Two mutations E17K and E242 substitution were found in this gene (Table IV) Of these, E17K was a hotspot, missense, somatic, pathogenic and found in the catalytic domain, while E242 was categorized as substitution and coding silent. The incidence of these two mutations was 2.5% each in patients in our study.
Table IV. Mutations detected in the PIK3CA and AKT1 genes, their characteristics frequency, and incidence (%) in all female patients with breast cancer recruited in this study
| Properties | PIK3CA gene | AKT1 genes | |||
| Mutation 1 | Mutation 2 | Mutation 3 | Mutation 1 | Mutation 2 | |
| Q546K | E545K | H1047R | E17K | E242 | |
| Chromosome | 3 | 3 | 3 | 14 | 14 |
| Location | Exon 10 | Exon 10 | Exon 21 | Exon 3 | Exon 9 |
| Nucleic acid change | Substitution | c.3140A>G, Substitution | c.49G>A, Substitution | c.726G>A, Substitution | |
| Amino acid change | p.Q546K, Substitution - Missense | p.H1047R, Substitution - Missense | p.E17K Substitution - Missense | p.E242 Substitution –coding silent | |
| FATHMM prediction | Pathogenic, (score 0.97) | Pathogenic, (score 0.97) | Pathogenic, (score 0.96) | Pathogenic (score 1.00) | Pathogenic (score 0.72) |
| Ever confirmed somatic? | Yes | Yes | Yes | Yes | Yes |
| No. of samples | 1 | 5 | 8 | 1 | 1 |
| Incidence (%) | 2.5 | 12.5 | 20 | 2.5 | 2.5 |
Table V. Mutations detected in the MTOR gene, their characteristics frequency, and incidence (%) in all female patients with breast cancer.
| Properties | Mutation 1 | Mutation 2 | Mutation 3 | Mutation 4 | Mutation 5 | Mutation 6 |
| Mutation | L2303 | L2208 | S1851 | A1577 | N999 | D479 |
| Chromosome | 1 | 1 | 1 | 1 | 1 | 1 |
| Location | Exon 49 | Exon 47 | Exon 39 | Exon 33 | Exon 19 | Exon 10 |
| Nucleic acid change | Substitution | c.6624T>C, Substitution | Substitution | Substitution | Substitution | Substitution |
| Amino acid change | Substitution – coding silent | L2208 Substitution – coding silent | Substitution – coding silent | Substitution – coding silent | Substitution – coding silent | D479 Substitution – coding silent |
| FATHMM prediction | Pathogenic (Score 0.90) | Neutral (Score 0.43) | Neutral (Score 0.16) | n/a | Neutral (Score 0.08) | n/a |
| Ever confirmed somatic? | Yes | No | Yes | Yes | Yes | Yes |
| Samples | 1 | |||||
| Percent | 2.5 | |||||
Table VI. Mutations detected in the PTEN gene, their characteristics frequency, and incidence (%) in all female patients with breast cancer recruited in this study.
| Properties | Mutation 1 | Mutation 2 | Mutation 3 |
| Mutation/s | p.R130Q | p.R173C | |
| Chromosome | 10 | 10 | 10 |
| Location | Exon 5 | Exon 5 | Exon 6 |
| Nucleic acid change | c.389G>A, Substitution | c.517C>T, Substitution | |
| Amino acid change | p.R130Q, Substitution - Missense | p.R173C, Substitution - Missense | |
| FATHMM prediction | Pathogenic, (score 0.96) | Pathogenic, (score 0.99) | Pathogenic, (score 0.95) |
| Ever confirmed somatic? | Yes | Yes | Yes |
| Samples | 3 | 1 | 1 |
| Percent | 7.5 | 2.5 | 2.5 |
The already published data about the prevalence of the AKT1 gene shows that it is 4.96%. Li et al. (2018) have reported it as 3.2%. The incidence of AKT1 mutation is in good agreement with already published reports.
We have detected SIXmutations in MTOR gene in 2.5% of cases in this study (Table V). Results showed that six substitution mutations (L2303, L2208, S1851, A1577, N999 and D479) were somatic and silent. Of these L2303 was found to be pathogenic (COSMIC). Similar studies are not adequately available.
PTEN gene was found mutated in 12.5% of all cases (Table VI). Three hotspot and substitution p. R130G, p.R130Q, and p.R173C in 7.5%, 2.5%, and 2.5% cases, respectively. These are missense and pathogenic. Of these R130G and p.R173C are located within the phosphatase tensin-type domain of the Pten protein , while p.R173C was located e located at the phosphatase-C2 domain interface of the respective proteins (Table VI). These mutations are extensively studied by many researchers over the past 3 decades in several types of cancers including breast cancer .
Protein modelling
Modelling of all SNPs was performed using Modeller 9.1.1 which told the mutated version of a specific protein.
By analyzing modelled proteins, a conclusion was made that these mutations cause the change in structure (Fig. 4). The stable structure of a protein is disrupted and normal function changes due to which this mutation leads to cancer.
MD simulation
A molecular dynamic simulation of 1ns was performed in which each protein variant was allowed to move and interact with water molecules. A total step of 500,000 was performed in which each step protein was allowed to run for 1ns. After simulation different analysis was performed to determine the overall stability results during MD Simulation. RMSD, RMSF, RG, and SASA analyses were performed which give the result of protein structural analysis by using different parameters.
RMSD analysis
Root mean square deviation is a standard measure of structural distance between coordinates. It measures the average distance between a group of atoms. The average stability value is between 1.0 to 1.2 angstrom, but the value may change according to protein structure. By analyzing our RMSD graphs of simulated protein the value of all rmsd values keeps on increasing which tells us that the average distance of these proteins continuously increases so as their structure, therefore, these are unstable (Fig. 5).
RMSF analysis
Root mean square fluctuation is a calculation of individual residue flexibility, or how much a particular residue moves (fluctuates) during a simulation. The more the atom fluctuates more the protein is unstable. RMSF graphs of all variant proteins show that these are unstable due to the continuously vigorous fluctuation of particles (Fig. 6).
SASA analysis
Solvent accessible surface area (SASA) is defined as the surface area of a protein that interacts with its solvent molecules. The more the protein is accessible to the solvent more chance it is to be soluble in the solvent and perform its activity. SASA analysis shows that all protein variants continuously fluctuate between soluble and non-soluble states, so this changes their normal functions (Fig. 7).
RG analysis
The radius of gyration (RG) is defined as the distribution of atoms of a protein around its axis. More gyration value means that particles of protein continuously scatter. RG graph of our protein shows that these proteins continuously scatter particles due to which protein changes its structure and function continuously (Fig. 8).
Funding
The author received funding from University of the Punjab, Lahore, Pakistan for this work.
IRB approval
Institutional Review Board of Department of Zoology, University of the Punjab, Quid-E-Azam Campus, Lahore, Pakistan granted approval for this study (Ref: F.39/NHRC/Admin/IBR178).
Ethics statement
All procedures performed in studies involving human participants were in accordance with the ethical standards of the institutional review board (IRB) under the IBR number 1580. Written informed consent was obtained from all individual participants included in the study.
Supplementary material
There is supplementary material associated with this article. Access the material online at: https://dx.doi.org/10.17582/journal.pjz/20221006131025
Statement of conflict of interest
The authors have declared no conflict of interest.
Figures
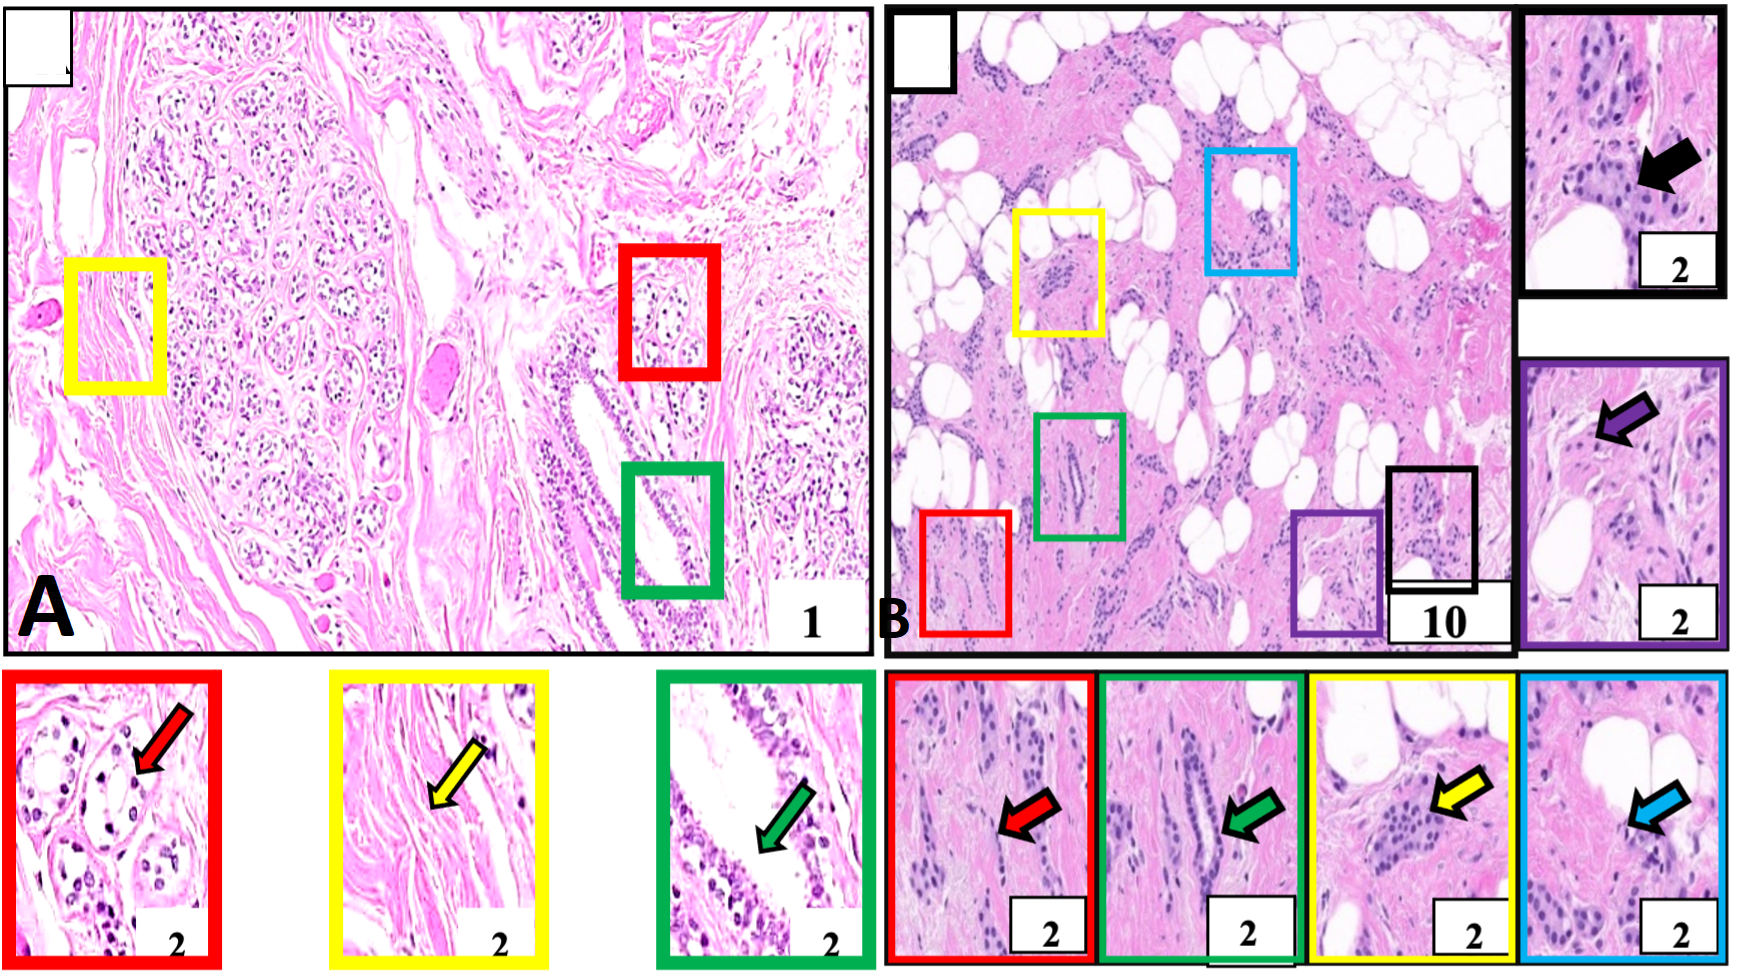
Histological structure of normal and breast tumor samples of our study subject identified for invasive ductal carcinoma. A, Negative control tissue showing morphologically normal breast cells. These cells and their nuclei are smaller, uniform, and regular in size and shape (red outlined box and arrow). The breast stroma is normal and does not show cellular penetration (yellow outlined box and arrow). The milk-carrying ducts are also nicely lined with normal cell layers (green outlined box and arrow). B, Breast cancer tissue. This tissue is showing malignant cells (red outlined box and arrow) identified in milk-carrying ducts of the breast. These cells and their nuclei are larger in size and pleomorphic morphologically (purple outlined box) arranged in cords (red outlined box and arrow), nests (yellow outlined box and arrow), sheets (black outlined box and arrow), forming tubular structures (green outlined box and arrow) and showing mitotic figures (blue outlined box and arrow). These cells are penetrating the rounding breast stroma (purple outlined box and arrow). Boxes with various color outlines are showing digitally magnified corresponding selected areas on slides A and B. Stain: Hematoxylin and Eosin.
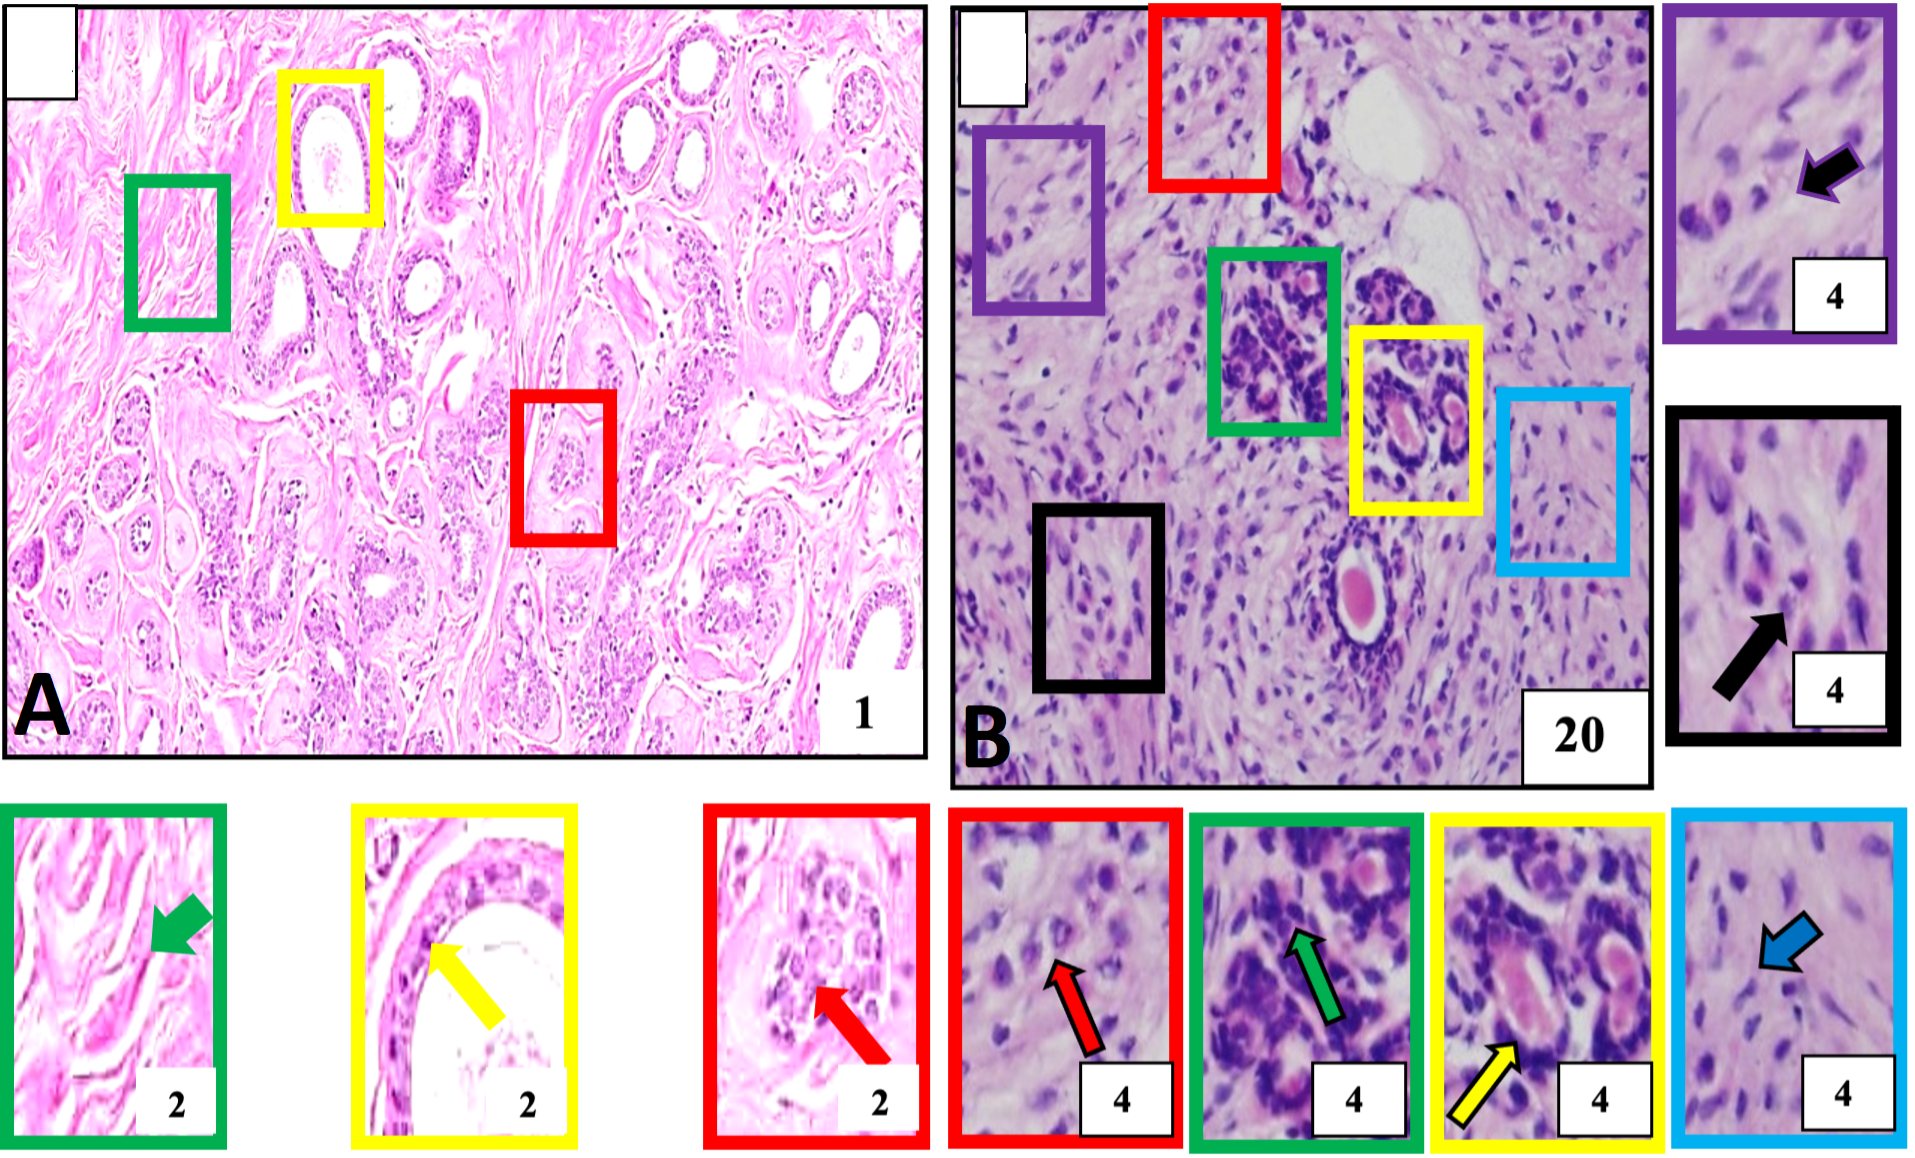
Histological structure of normal and breast tumor samples of our study subject identified for invasive lobular carcinoma A, Negative control tissue showing morphologically normal breast cells. These cells and their nuclei are smaller, uniform, and regular in size and shape (red outlined box and arrow). The breast stroma is normal and does not show cellular penetration (green outlined box and arrow) and normal cell layers constituting breast milk carrying ducts (yellow outlined box and arrow). B, Breast cancer. The tumor tissue is showing a population of malignant cells across the tissue and is detected the in lobular part of the breast. These are larger than normal breast cells arranged into single files or chains of cells (red outlined box and arrow), single cells (purple outlined box and arrow), cells with evident cellular and nuclear pleomorphism (black outlined box and arrow), round to oval shaped nuclei (green outlined box and arrow) aggregate around ducts (yellow outlined box and arrow) and penetrating surrounding breast stroma (blue outlined box with arrow). Boxes with various color outlines are showing digitally magnified corresponding selected areas on slides A and B. Stain: Hematoxylin and Eosin.
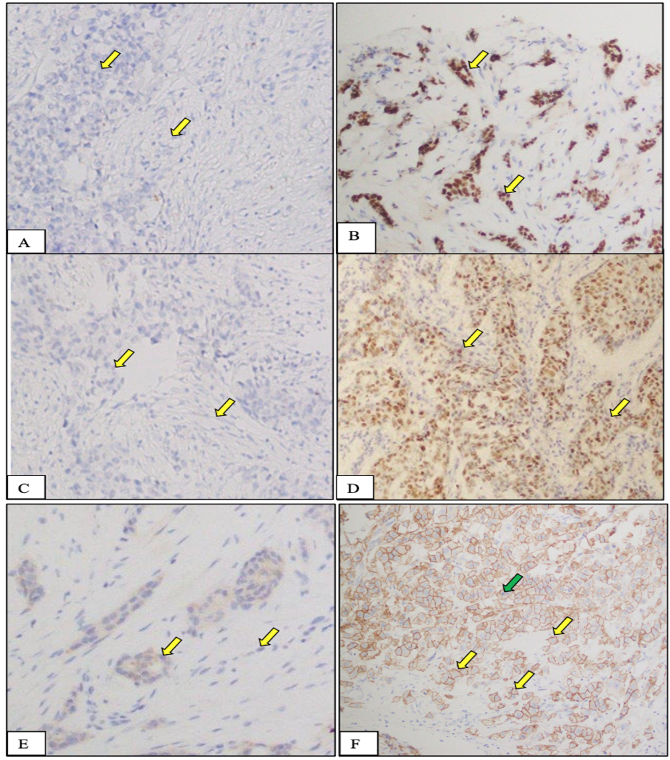
Expression of ER (A, B), PR (C, D), and HER2/neu (E,F) receptor (protein) in normal and tumor tissues from female breast cancer patients recruited in this study. A, C, E, Negative control tissue: cells in this tissue are not showing any nuclear stain due to the absence of specific receptors in these cells. On the other hand, they are showing blue color staining because of H&E counter stain. B, D, F, Breast cancer tissue, nucleic of cancer cells are showing intense staining (yellow arrow) due to the presence of overexpressed specific receptors. These receptors are localized in the cell nuclei and upon application of specific for each antibodies to these receptors, they produce a brown color. Stain: Immunohistochemical stain specific to ER receptor; Magnification: 20X; Counterstain: Hematoxylin and Eosin, Magnification: 20X.
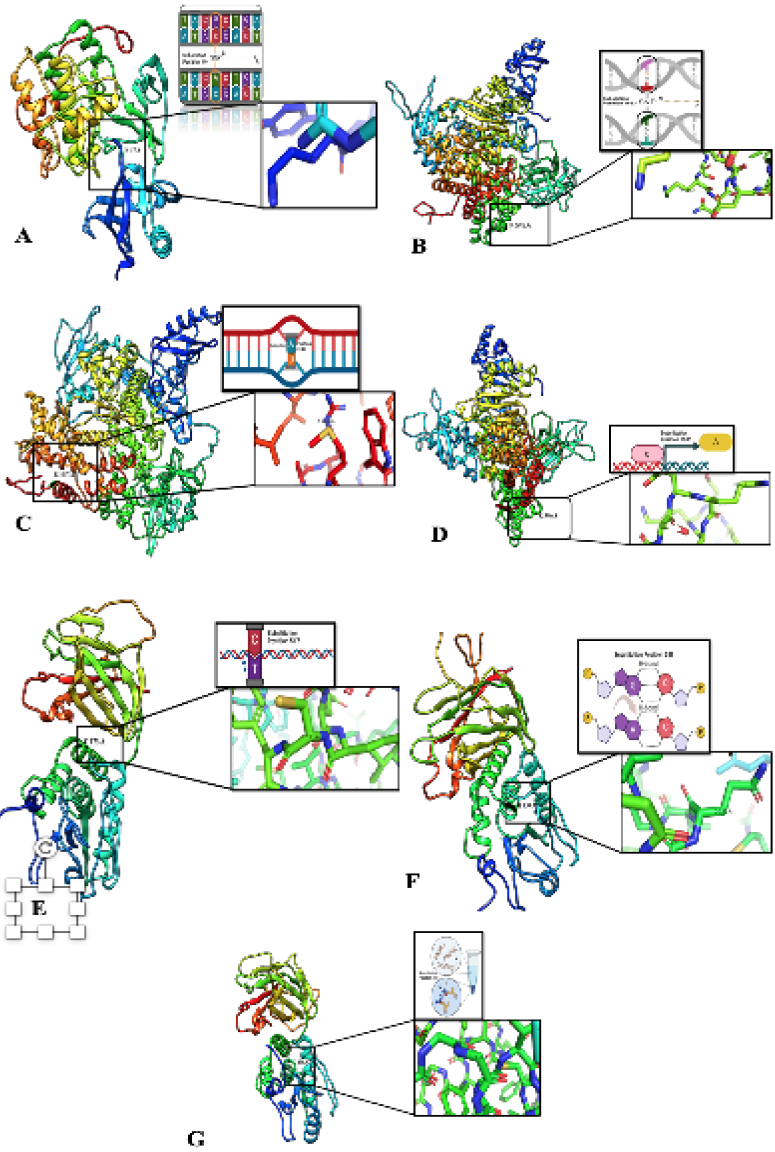
3D-modelled structure from SNPs sequence. A, Structural modeling reveals AKT1 gene mutation (E17K) on Chromosome 14, Exon 3, position 49 (c.49G>A) causing a missense mutation Amino acids change (E to K) with potential clinical association. B, An In-depth Analysis of the Structural Implications of the c.166G>A PIK3CA Gene Mutation (E545K) in Exon 10 on Chromosome 3, Resulting in a Missense Mutation that Substitutes Glutamic Acid (E) with Lysine (K) in the PIK3CA Protein. C, Protein Modeling of PIK3CA Gene Mutation (H1047R) in Exon 21 (c.31406A>G) on Chromosome 3: Revealing Molecular Mechanisms of a Missense Mutation Substituting Histidine with Arginine. D, PIK3CA Gene Mutation: A Missense Q546K Change in Exon 10 (c.1636 C>A) - A Promising Protein Model Insight. E, Modelling depict PTEN gene mutation P.R 173c (chromosome 10, Exon 6). c.517 C>T results in a missense mutation, substituting Arginine (R) with Cysteine (C) at position 517, offering insights into its potential impact on PTEN protein structure and function. F, In silicon protein modeling predicts the impact of PTEN gene mutation (P.R130Q) on chromosome 10, Exon 5, c.389G>A substitution, causing a missense mutation (R to Q). G, Mutation profiling and protein modeling to predict the location and effects of the PTEN gene mutation P.R130G on chromosome 10, exon 5 this missense mutation (c. C>G, position 388) results in an amino acid change from arginine (R) to cysteine (C).”
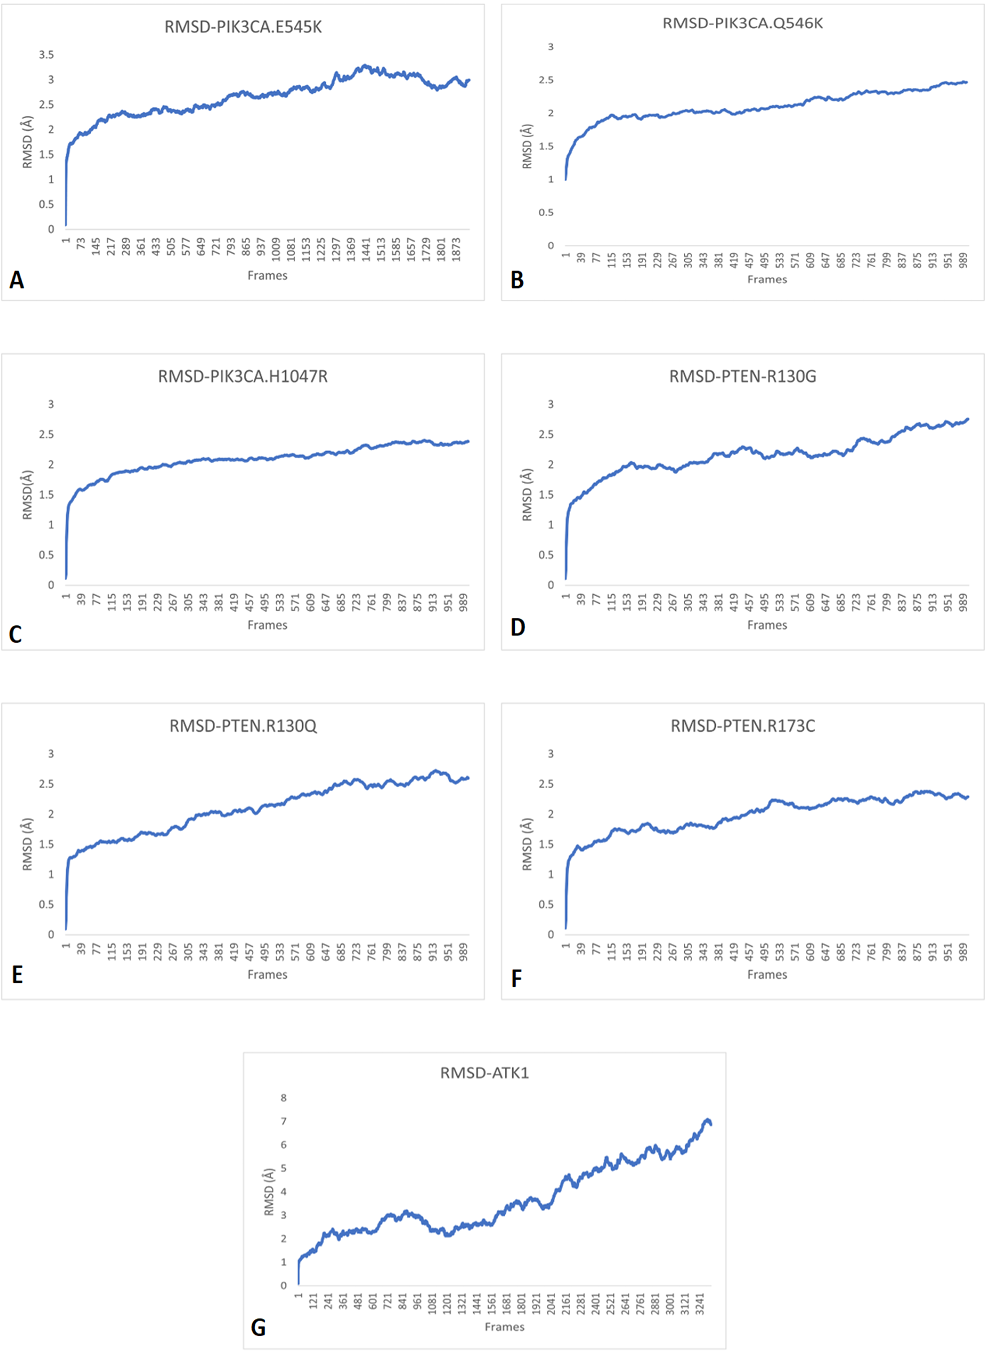
RMSD simulation patterns of A, PIK3CA (E545K); B, PIK3CA (Q546K); C, PIK3CA (H1047R); D, PTEN (R130G); E, PTEN (R130Q); F, PTEN (R173C) and G, AKT1 (E17K) showing that all RMSD values kept increasing, therefore, making them unstable.
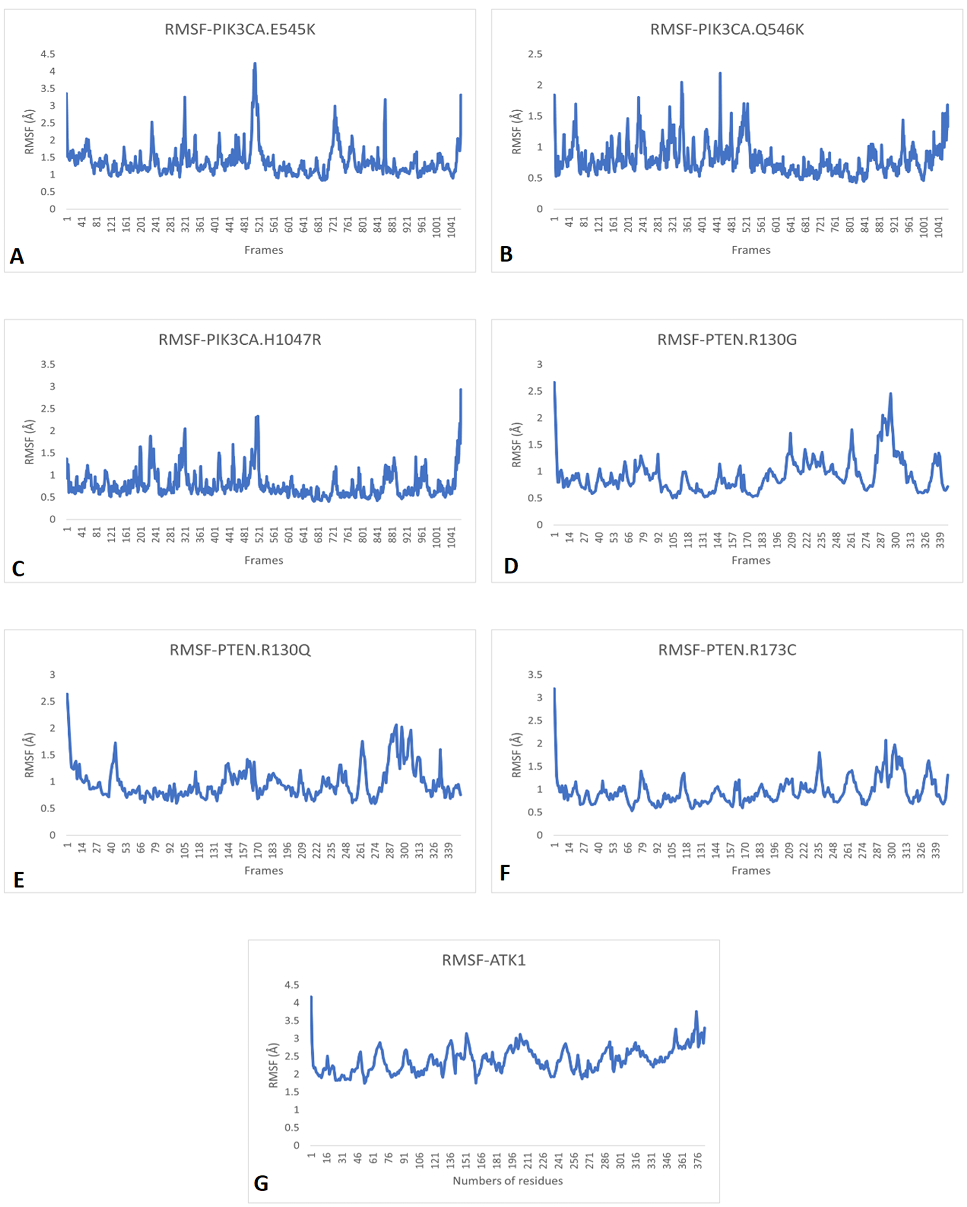
RMSF patterns of A, PIK3CA (E545K); B, PIK3CA (Q546K); C, PIK3CA (H1047R); D, PTEN (R130G); E, PTEN (R130Q); F, PTEN (R173C) and G, AKT1 (E17K) showing that these are unstable due to the continuously vigorous fluctuation of particles.
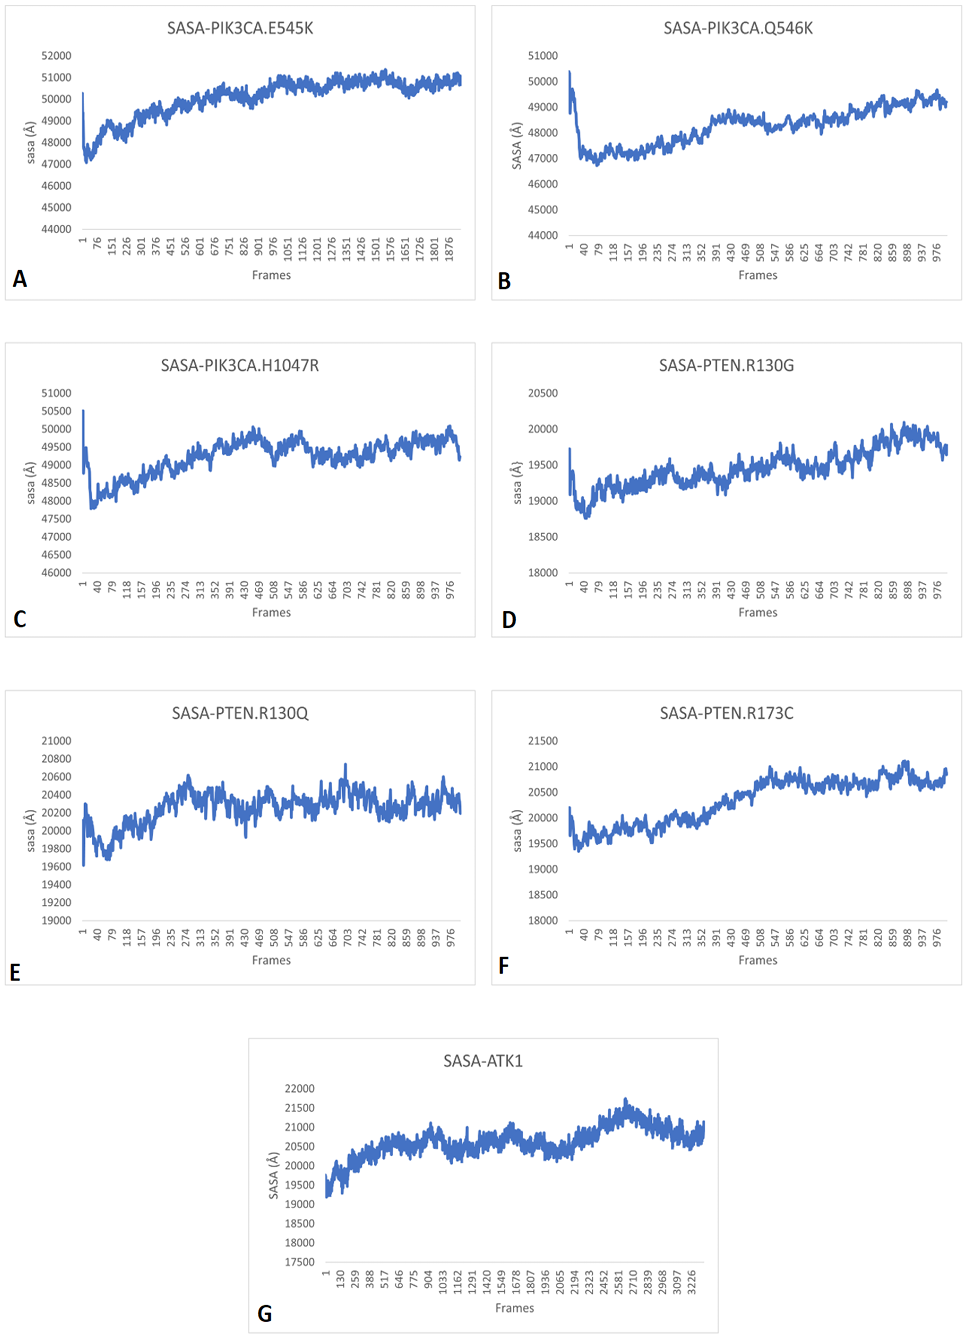
SASA patterns of A, PIK3CA (E545K); B, PIK3CA (Q546K); C, PIK3CA (H1047R); D, PTEN (R130G); E, PTEN (R130Q); F, PTEN (R173C) and G, AKT1 (E17K) showing that variants continuously fluctuate between soluble and non-soluble states leading to change their normal functions.
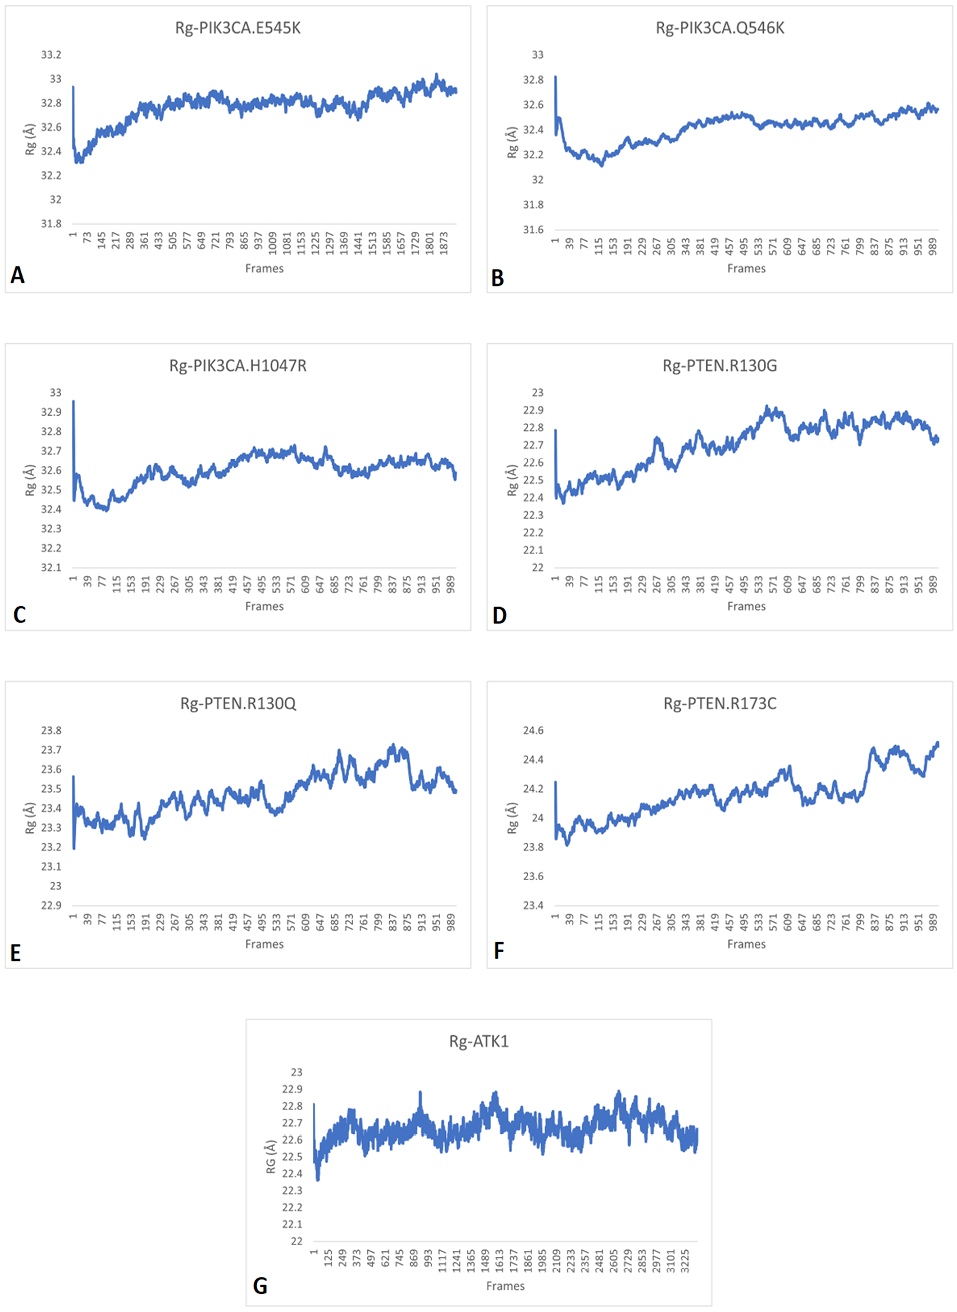
RG patterns of A, PIK3CA (E545K); B, PIK3CA (Q546K); C, PIK3CA (H1047R); D, PTEN (R130G); E, PTEN (R130Q); F, PTEN (R173C) and G, AKT1 (E17K) showing that these proteins continuously scatter particles hence their structure and function keep changing continuously and fails to perform their role.
References
- Al-Thoubaity, F.K., 2020. Molecular classification of breast cancer: A retrospective cohort study. Annls Med. Surg. (Lond.), 49: 44-48. https://doi.org/10.1016/j.amsu.2019.11.021[CrossRef]
- Bradley, C.J., Given, C.W. and Roberts, C., 2002. Race, socioeconomic status, and breast cancer treatment and survival. J. natl. Cancer Inst., 94: 490-496. https://doi.org/10.1093/jnci/94.7.490[CrossRef]
- Buchwalow, I.B. and Böcker, W., 2010. Immunohistochemistry. Basics Methods, 1: 1-149. https://doi.org/10.1007/978-3-642-04609-4[CrossRef]
- Cancer Genome Atlas, N., 2012. Comprehensive molecular portraits of human breast tumours. Nature, 490: 61-70. https://doi.org/10.1038/nature11412[CrossRef]
- Chen, L., Yang, L., Yao, L., Kuang, X.Y., Zuo, W.J., Li, S., Qiao, F., Liu, Y.R., Cao, Z.G. and Zhou, S.L., 2018. Characterization of PIK3CA and PIK3R1 somatic mutations in Chinese breast cancer patients. Nat. Commun., 9: 1357. https://doi.org/10.1038/s41467-018-03867-9[CrossRef]
- Copeland, J., Oyedeji, A., Powell, N., Cherian, C.J., Tokumaru, Y., Murthy, V., Takabe, K., and Young, J., 2021. Breast cancer in Jamaica: Stage, Grade and molecular subtype distributions across age blocks, the implications for screening and treatment. World J. Oncol., 12: 93. https://doi.org/10.14740/wjon1389[CrossRef]
- Dirican, E., Kaya, Z., Gullu, G., Peker, I., Ozmen, T., Gulluoglu, B.M., Kaya, H., Ozer, A. and Akkiprik, M. 2014. Detection of PIK3CA gene mutations with HRM analysis and association with IGFBP-5 expression levels in breast cancer. Asian Pac. J. Cancer Prev., 15: 9327-9333. https://doi.org/10.7314/APJCP.2014.15.21.9327[CrossRef]
- Eswar, N., Webb, B., Marti-Renom, M.A., Madhusudhan, M., Eramian, D., Shen, M.Y., Pieper, U. and Sali, A., 2006. Comparative protein structure modeling using modeller. Curr. Protoc. Bioinf., 15: 5-6. https://doi.org/10.1002/0471250953.bi0506s15[CrossRef]
- Femi, O.F., 2018. Genetic alterations and PIK3CA gene mutations and amplifications analysis in cervical cancer by racial groups in the United States. Int. J. Hlth. Sci. (Qassim), 12: 28-32.
- Fitzgibbons, P.L., Bartley, A.N. and Connolly, J.L., 2018. Template for reporting results of biomarker testing of specimens from patients with carcinoma of the breast. Arch. Pathol. Lab. Med., 138: 595-601. https://doi.org/10.5858/arpa.2013-0566-CP[CrossRef]
- Francis, A.M., Ramya, R., Ganesan, N., Kumarasamy, P., Paul, S.F., Munirajan, A. and Divya, M., 2019. Breast cancer susceptibility genes in estrogen metabolizing pathway in a southern Indian population. Meta. Gene, 19: 225-234. https://doi.org/10.1016/j.mgene.2018.12.009[CrossRef]
- Fusco, N., Sajjadi, E., Venetis, K., Gaudioso, G., Lopez, G., Corti, C., Guerini, R.E., Criscitiello, C., Malapelle, U. and Invernizzi, M., 2020. PTEN alterations and their role in cancer management are we making headway on precision medicine? Genes, 11: 719. https://doi.org/10.3390/genes11070719[CrossRef]
- Green, M.R. and Sambrook, J., 2019. Agarose gel electrophoresis. Cold Spring Harbor Protocols, 1: pdb.prot100404. https://doi.org/10.1101/pdb.prot100404[CrossRef]
- Heitz, A.E., Baumgartner, R.N., Baumgartner, K.B. and Boone, S.D., 2018. Healthy lifestyle impact on breast cancer-specific and all-cause mortality. Breast Cancer Res. Treat., 167: 171-181. https://doi.org/10.1007/s10549-017-4467-2[CrossRef]
- Hoffmann, T., Corrêa-Fissmer, M., Duarte, C.S., Nazário, R.F., Barranco, A.B.S. and Oliveira, K.W.K.D., 2018. Prevalence of dermatological complaints in patients undergoing treatment for breast cancer. Annls Bras. Dermatol., 93: 362-367. https://doi.org/10.1590/abd1806-4841.20186541[CrossRef]
- Iacoviello, L., Bonaccio, M., de Gaetano, G. and Donati, M.B., 2021. Epidemiology of breast cancer, a paradigm of the common soil hypothesis. Semin. Cancer Biol., 72: 4-10. https://doi.org/10.1016/j.semcancer.2020.02.010[CrossRef]
- Jerant, A.F., Johnson, J.T., Demastes, S.C. and Caffrey, T., 2000. Early detection and treatment of skin cancer. Am. Family Physic., 62: 357-368.
- Jones, P.A. and Baylin, S., 2007. The epigenomics of cancer. Cell, 128: 683-692. https://doi.org/10.1016/j.cell.2007.01.029[CrossRef]
- Karakas, B., Colak, D., Kaya, N., Ghebeh, H., Al-Qasem, A., Hendrayani, F., Toulimat, M., Al-Tweigeri, T., Park, B.H. and Aboussekhra, A. 2013. Prevalence of PIK3CA mutations and the SNP rs17849079 in Arab breast cancer patients. Cancer Biol. Ther., 14: 888-896. https://doi.org/10.4161/cbt.25945[CrossRef]
- Kato, H., Kato, S., Kumabe, T., Sonoda, Y., Yoshimoto, T., Kato, S., Han, S.Y., Suzuki, T., Shibata, H., and Kanamaru, R., 2000. Functional evaluation of p53 and PTEN gene mutations in gliomas. Clin. Cancer Res., 6: 3937-3943.
- Kumari, N., Corless, C., Warrick, A., Beadling, C., Nelson, D., Neff, T., Krishnani, N. and Kapoor, V., 2014. Mutation profiling in gallbladder cancer in Indian population. Ind. J. Pathol. Microbiol., 57: 9-12. https://doi.org/10.4103/0377-4929.130849[CrossRef]
- Kumari, K.G., Mandarapu, R. and Godi, S., 2017. Oncogenic mutations of PIK3CA and HRAS in carcinoma of cervix in South Indian women. J. Oncol. Sci., 3: 112-116. https://doi.org/10.1016/j.jons.2017.10.004[CrossRef]
- Li, G., Guo, X., Chen, M., Tang, L., Jiang, H., Day, J.X., Xie, Y., Peng, L., Xu, X. and Li, J., 2018. Prevalence and spectrum of AKT1, PIK3CA, PTEN and TP53 somatic mutations in Chinese breast cancer patients. PLoS One, 13: e0203495. https://doi.org/10.1371/journal.pone.0203495[CrossRef]
- Liang, X., Lau, Q.C., Salto-Tellez, M., Putti, T.C., Loh, M., Sukumar, S. and Therapy. 2006. Mutational hotspot in exon 20 of PIK3CA in breast cancer among Singapore Chinese. Cancer Biol. Ther., 5: 544-548. https://doi.org/10.4161/cbt.5.5.2656[CrossRef]
- Mane, A., Khatib, K.I., Deshmukh, S.P., Nag, S.M., Sane, S. and Zade, B.P., 2015. A comparison of clinical features, pathology and outcomes in various subtypes of breast cancer in Indian women. J. clin. Diagn. Res., 9: PC01-PC04.
- Palomba, G., Colombino, M., Contu, A., Massidda, B., Baldino, G., Pazzola, A., Ionta, M., Capelli, F., Trova, V., Sedda, T., Sanna, G., Tanda, F., Budroni, M., Sardinian Translational Oncology, G., Palmieri, G., Cossu, A., Contu, M., Cuccu, A., Farris, A. and Virdis, L., 2012. Prevalence of KRAS, BRAF, and PIK3CA somatic mutations in patients with colorectal carcinoma may vary in the same population: Clues from Sardinia. J. Transl. Med., 10: 178. https://doi.org/10.1186/1479-5876-10-178[CrossRef]
- Pandit, P., Patil, R., Palwe, V., Gandhe, S., Patil, R. and Nagarkar, R., 2020. Prevalence of molecular subtypes of breast cancer: A single institutional experience of 2062 patients. Eur. J. Breast Hlth., 16: 39-43. https://doi.org/10.5152/ejbh.2019.4997[CrossRef]
- Paplomata, E. and O’Regan, R., 2014. The PI3K/AKT/mTOR pathway in breast cancer: Targets, trials and biomarkers. Ther. Adv. Med. Oncol., 6: 154-166. https://doi.org/10.1177/1758834014530023[CrossRef]
- Peck, R.W., 2016. The right dose for every patient: A key step for precision medicine. Nat. Rev. Drug Discov., 15: 145-146. https://doi.org/10.1038/nrd.2015.22[CrossRef]
- Phillips, J.C., Braun, R., Wang, W., Gumbart, J., Tajkhorshid, E., Villa, E., Chipot, C., Skeel, R.D., Kale, L., and Schulten, K., 2005. Scalable molecular dynamics with NAMD. J. Comput. Chem., 26: 1781-1802. https://doi.org/10.1002/jcc.20289[CrossRef]
- Ravdin, P.M., Cronin, K.A., Howlader, N., Berg, C.D., Chlebowski, R.T., Feuer, E.J., Edwards, B.K. and Berry, D.A., 2007. The decrease in breast-cancer incidence in 2003 in the United States. N. Engl. J. Med., 356: 1670-1674. https://doi.org/10.1056/NEJMsr070105[CrossRef]
- Siegfried, E., Ayrolles, A. and Rahioui, H., 2018. Body dysmorphic disorder: Future prospects of medical care. Encephale, 44: 288-290. https://doi.org/10.1016/j.encep.2017.08.001[CrossRef]
- Slaoui, M. and Fiette, L., 2011. Histopathology procedures: from tissue sampling to histopathological evaluation. Methods mol. Biol., 691: 69-82. https://doi.org/10.1007/978-1-60761-849-2_4[CrossRef]
- Smith, I.N. and Briggs, J.M., 2016. Structural mutation analysis of PTEN and its genotype-phenotype correlations in endometriosis and cancer. Proteins, 84: 1625-1643. https://doi.org/10.1002/prot.25105[CrossRef]
- Stephens, P.J., Tarpey, P.S., Davies, H., Van Loo, P., Greenman, C., Wedge, D.C., Nik-Zainal, S., Martin, S., Varela, I., Bignell, G.R., Yates, L.R., Papaemmanuil, E., Beare, D., Butler, A., Cheverton, A., Gamble, J., Hinton, J., Jia, M., Jayakumar, A. and Stratton, M.R., 2012. The landscape of cancer genes and mutational processes in breast cancer. Nature, 486: 400-404. https://doi.org/10.1038/nature11017[CrossRef]
- Strushkevich, N., Gilep, A.A., Shen, L., Arrowsmith, C.H., Edwards, A.M., Usanov, S.A. and Park, H.W., 2013. Structural insights into aldosterone synthase substrate specificity and targeted inhibition. Mol. Endocrinol., 27: 315-324. https://doi.org/10.1210/me.2012-1287[CrossRef]
- Sumer, B. and Gao, J., 2008. Theranostic nanomedicine for cancer. Nanomedicine (Lond.), 3: 137–140. https://doi.org/10.2217/17435889.3.2.137[CrossRef]
- Thomas, M., Kelly, E.D., Abraham, J. and Kruse, M., 2019. Invasive lobular breast cancer: A review of pathogenesis, diagnosis, management, and future directions of early stage disease. Semin. Oncol., 46: 121-132. https://doi.org/10.1053/j.seminoncol.2019.03.002[CrossRef]
- Walter, E., 2019. Introduction and overview. In: Regulatory and economic aspects in oncology. Springer. pp. 1-5. ISBN: 978-3-030-01207-6 https://doi.org/10.1007/978-3-030-01207-6_1[CrossRef]
- Wander, S.A., Hennessy, B.T. and Slingerland, J.M., 2011. Next-generation mTOR inhibitors in clinical oncology: How pathway complexity informs therapeutic strategy. J. clin. Inves., 121: 1231-1241. https://doi.org/10.1172/JCI44145[CrossRef]
- Yates, L.R., Knappskog, S., Wedge, D., Farmery, J.H., Gonzalez, S., Martincorena, I., Alexandrov, L.B., Van Loo, P., Haugland, H.K. and Lilleng, P.K., 2017. Genomic evolution of breast cancer metastasis and relapse. Cancer Cell, 32: 169-184. e167. https://doi.org/10.1016/j.ccell.2017.07.005[CrossRef]
- Yazdani-Charati, R., Hajian-Tilaki, K. and Sharbatdaran, M., 2019. Comparison of pathologic characteristics of breast cancer in younger and older women. Caspian J. Int. Med., 10: 42.
Supplementary material
Services
Article usage statistics
Loading…