
To address the escalating drug resistance of uropathogenic Escherichia coli (UPEC), this study aimed to examine the phytochemical profile and biological potential of Melia azedarach leaf extracts. Hexane and ethanol fractions were obtained via ultrasound-assisted extraction and analyzed using high-performance liquid chromatography (HPLC) and gas chromatography-mass spectrometry (GC-MS), followed by standard phenotypic assays to evaluate the antimicrobial, anti-biofilm, and anti-quorum-sensing activities. Among the total collection, 24% (n = 72) of the isolates were identified as E. coli. The phenotypic screening for biofilm development revealed that 46 isolates (63.8%) exhibited a strong biofilm production. The remaining isolates demonstrated a moderate (19.4%; n = 14), weak (6.9%; n = 5), or no biofilm-forming ability (9.7%; n = 7). HPLC analysis identified flavonoids and phenolic acids, specifically chlorogenic acid and catechin. These two compounds were the main constituents of the plant leaf, recording 93.48 μg/ml and 86.42 μg/ml, respectively. Additionally, rutin was the main constituent of the flavonol fractions. GC-MS screening revealed the presence of 11 terpenoids in the hexane fraction, including caryophyllene-β, germacrene D, and phytol. These two tested extracts demonstrated a remarkable antibacterial activity, with minimum inhibitory concentration (MIC) and minimum bactericidal concentration (MBC) values ranging from 25-50 mg/ml to 50-100 mg/ml, respectively. The ethanolic leaf extract was more effective in its anti-biofilm activity, showing 90.9% inhibition at MIC/2, compared to 66.7% for the hexane fraction. Furthermore, MIC/2 treatment with the ethanolic extract substantially reduced E. coli swarming and swimming motility by 89.4% and 65.3%, respectively. Ethanolic extracts of M. azedarach inhibited quorum sensing (QS), demonstrating an 85.19% inhibition of violacein production at MIC/2, while hexane extracts displayed a 76.35% inhibition at the same concentration. The QS-inhibiting properties of both extracts and their bioactive constituents suggested their suitability for treating bacterial diseases at sub-MIC levels, promoting their biomedical use against multidrug-resistant (MDR) infections.
Research Article · Volume 10, Issue 5, 8 September 2026 · Open Access
Melia azedarach Phenolic and Terpenoid Leaf Extracts Impair Biofilm Production and Quorum Sensing in Clinical Escherichia coli Isolates
· ·
Affiliations & Notes ⌄
- 1Biological Control Technologies Department, Al-MussaibTechnical College, Al-Furat Al-Awsat Technical University, Babylon, Iraq. *Correspondence | Hadeel Abbas Hassan, Biological Control Technologies Department, Al-MussaibTechnical College, Al-Furat Al-Awsat Technical University, Babylon, Iraq
- 2Email: h.alhayli@atu.edu.iq
Article Info ⌄
- Journal:
- Novel Research in Microbiology Journal
- Published:
- 8 September 2026
From the article
- Regarding the inhibition of QS and bacterial motility, the obtained results showed that both extracts suppressed the swimming and swarming motility, along with biofilm formation, across all E. coli isolates at sub-MIC levels without affecting the bacterial growth.
- Specifically, the experimental findings demonstrated the distinct effectiveness of the extracts.
- Notably, the maximum relative growth inhibition reached 75.0% for MLPE and 46.4% for the hexane extract at a concentration of 75 mg/ml. Additionally, peak biofilm inhibition reached 90.9% for MLPE and 66.7% for MLTE at their respective MIC/2 values.
- Furthermore, at the same concentration (MIC/2), swarming motility was suppressed by up to 89.4% for MLPE and 79.4% for MLTE, while swimming motility was reduced by up to 65.3% and 53.3%, respectively.
Selected from the article's own text.
Abstract
Introduction
Escherichia coli can cause diseases such as urinary tract infections (UTIs), bloodstream infections (sepsis), middle ear infections, wound sepsis, newborn meningitis, peritonitis, and respiratory tract infections ; . The most common causative agent of UTIs in humans is E. coli ; ; . Biofilm formation on multiple surface types substantially contributes to the prominence of uropathogenic Escherichia coli (UPEC ) as a leading cause of healthcare-associated complications in humans . Cases of multidrug -resistant (MDR) E. coli have increased notably, showing the highest prevalence observed in UTIs . Globally, E. coli ranks as the second critical MAR pathogen that urgently requires new therapies, heavily driving an infection-related mortality .
Numerous studies have shown that constituents extracted from various medicinal plants possess a range of biological activities, including antibacterial and antifungal properties ; . M. azedarach, a Meliaceae tree commonly known as chinaberry or Persian lilac, provides well-established medicinal benefits with documented antifungal and antibacterial effects ; . M. azedarach contains numerous secondary metabolites, including glycosides, tannins, phenols, and flavonoids, which are responsible for its various biological activities ; ; . The leaf extract of this plant contains phytochemicals with an antibacterial activity against Gram-positive and Gram-negative bacteria ; .
The capacity to form biofilms, swarming motility, exopolysaccharide production, and the inhibition of violacein production represent critical QS-dependent factors regulated by the QS mechanism ; . Biofilms constitute a critical threat to healthcare systems because of their elevated tolerance to conventional interventions. This resistance stems from multifactorial mechanisms, including restricted antimicrobial diffusion across the biofilm matrix and the upregulation of resistance mechanisms within the colonizing E. coli cells ; . Therefore, it is necessary to investigate and explore new anti-biofilm compounds ; .
Quorum sensing (QS) crucially regulates target gene expression, particularly virulence genes such as those involved in antibiotic resistance, motility, pigment production, biofilm formation, and other virulence factors . In addition, several protein studies have shown that downregulation of the proteins associated with QS influences the virulence-associated phenotypes, such as motility and biofilm formation in E. coli ; . The use of quorum-sensing inhibitors (QSIs) offers a key advantage of an anti-virulence strategy relative to the standard antibiotic therapies ; ; . Emerging research indicated that phenolic-rich plant extracts possess potent QSI properties .
Given the scarcity of studies on the application of ultrasound-assisted extraction, we selected this technique for the present study. To the best of our knowledge, no previous studies have examined the effect of this extraction technique on the antibacterial, anti-biofilm, and anti-QS activity against E. coli isolated from various clinical samples in Babylon City, Iraq. Hence, this study aimed to assess the phytochemical composition of the ethanol and hexane leaf extracts of M. azedarach using high-performance liquid chromatography (HPLC) and gas chromatography-mass spectrometry (GC-MS), respectively. The nature of the anti-QS properties of M. azedarach remains unknown. Therefore, the anti-QS activity of sub-MICs of these extracts was investigated by assessing the inhibition of motility (swimming and swarming) in E. coli, as well as the inhibition of violacein pigment production by Chromobacterium violaceum, representing an initial baseline evaluation.
Materials and Methods
Bacterial isolation and identification
Approximately 300 clinical samples, including 100 from each of urine, wound, and sputum were collected from patients, which attended to a Hospital in Babylon, Iraq, between October 2025 and December 2025. The suspected bacterial isolates obtained from these clinical samples were streaked on eosin methylene blue (EMB) agar and MacConkey agar (Oxoid, Basingstoke, UK), and then incubated for 24 h at 37°C. After incubation, to identify the developed E. coli isolates, conventional biochemical assays were conducted, including indole, carbohydrate fermentation, catalase, oxidase, H2S production, Voges–Proskauer, methyl red test, Kligler’s Iron Agar (KIA), urea hydrolysis, and citrate utilization, following the methods described by Abdul Hamid and Khoshaba (2024); Getahun et al. (2025). The Vitek 2 system (bioMérieux, France) and the API 20E identification kit (bioMérieux, France) further verified the identity of the recovered E. coli isolates. For the QS inhibition assay, stocks of C. violaceum ATCC 12472 strain obtained from the Microbiology Department, University of Babylon, were used.
Assessment of biofilm-forming capacity
Escherichia coli biofilm formation was quantified using the 96-well microtiter plate method described by Fink (2023); David et al. (2026). Briefly, overnight bacterial cultures in Brain Heart Infusion (BHI) broth (Oxoid, Basingstoke, UK) were adjusted to 0.5 McFarland standard, and 200 µl aliquots were inoculated into BHI agar plates, followed by incubation at 37 °C for 48 h. Afterward, the grown cells were washed with phosphate-buffered saline and the developed biofilm cells were stained with 0.1% crystal violet for 15 min. The bound dye was solubilized using 96% ethanol, foiiowed by absorbance measurement at 600 nm. Uninoculated BHI broth served as the negative control. Biofilm formation was categorized according to the following criteria: strong biofilm producer = OD > 4 × ODcut; moderate biofilm producer = 2 × ODcut < OD ≤ 4 × ODcut; weak biofilm producer = ODcut < OD ≤ 2 × ODcut; and non-biofilm producer = OD ≤ ODcut, where ODcut = OD of the negative control .
Plant material collection and preparation
In November 2025, M. azedarach leaves were collected from the Babylon Tourist Resort, Iraq. An expert in plant taxonomy at the University of Babylon authenticated the plant identity. Following a water wash, the leaves were dried in the dark at room temperature before being ground into a fine powder using an electric laboratory mill and stored at 4°C until required .
Extracts preparation
Bioactive compounds were extracted from the dried leaf powder via ultrasound-assisted extraction using an ultrasonic bath (Bandelin Electronic, Berlin, Germany) for 60 min at 40°C following the methodology described by Batubara et al. (2025). Specifically, hexane was employed as the solvent for terpenoid extraction, while 70% ethanol was utilized for phenolic extraction. Quantification of total phenolics was performed spectrophotometrically via the Folin–Ciocalteau method against a standard curve of gallic acid (Sigma-Aldrich, St. Louis, MO, USA) ; . Moreover, total terpenoids were determined spectrophotometrically as per the procedure described by Biswas et al. (2021).
In vitro antibacterial efficacy of M. azedarach extracts
Stock solutions of M. azedarach leaf terpenoids extract (MLTE) and M. azedarach leaf phenolic extract (MLPE) were prepared at concentrations of 10, 25, 50, and 75 mg/ml . The disc diffusion technique was performed to determine the growth inhibition zones according to Touzout et al. (2023); Getahun et al. (2025). Briefly, bacterial suspensions adjusted to 10⁸ cfu/ml were inoculated onto Mueller-Hinton Agar (MHA) plates. Sterile 6 mm paper discs were loaded with 50 µl of each extract dilutions and placed aseptically onto the agar surface. Ciprofloxacin (5 µg/ml) and Dimethyl sulfoxide (DMSO) (Sigma-Aldrich, St. Louis, MO, USA) served as the positive and negative controls, respectively. Following incubation at 37 °C for 24 h, the inhibitory activity of the extracts was determined by measuring the diameter of the zone of inhibition (mm) using a calibrated ruler ; . The MIC values were determined via the resazurin microtiter assay following the methodology described by Fink (2023). Briefly, 100 µl of each extract dilution were individually mixed with 100 µl of Nutrient Broth (NB) and 5 µl of E. coli inoculum (10⁶ cfu/mL) in 96-well microplates. Following incubation at 37°C for 24 h, each well received 10 µl of 0.015% resazurin solution. The plates were incubated further under identical conditions for 4 h to evaluate the colorimetric changes. The MIC represented the lowest extract concentration that prevented conversion of the blue dye to pink . The MBC was determined by subculturing a 10 µl aliquot from each microtiter well showing no visible turbidity onto MHA (Oxoid, Basingstoke, UK) plates, before maintaining them at 37°C for 24 h .
Antibiofilm effects of M. azedarach extracts
The anti-biofilm activity of M. azedarach extracts was tested at the MIC, MIC/2, MIC/4, and MIC/8, where all of them represented the sub-MIC concentrations. The biofilm assay was performed as described above .
The percentage of biofilm inhibition = [(OD control–OD extract)/ OD control] ×100
Chemical composition of the extracts
The chemical composition of the hexane extract (terpenoid extract, MLTE) was determined via GC-MS (Agilent Technologies, Santa Clara, CA, USA) system equipped with an HP-5MS capillary column (30 m × 0.25 mm, 0.25 µm film thickness), using helium as a carrier gas at a flow rate of 1.0 ml/min. Aliquots of 100 µL of extract were analyzed with an inlet temperature of 300°C. The mass spectrometer operated in electron ionization mode, and identification of compound involved spectral comparision with library databases and authentic standards. Relative abundances were quantified from the peak areas in the total ion chromatograms ; . The chemical composition of the ethanol extract (phenolic extract, MLPE) was characterized using a HPLC system (Shimadzu, Kyoto, Japan). Analyses were performed according to Touzout et al. (2023); Mykhailenko et al. (2025). By using an Agilent Technologies 1100 series liquid chromatograph equipped with a Kinetex Evo C18 analytical column (250 × 4.6 mm, 3 µm) maintained at 40°C. The mobile phase consisted of 1% formic acid in water (A) and acetonitrile plus 1% formic acid (B), with the elution rate set to 0.8 ml /min. Sample aliquots of 20 µl were injected, and peak monitoring was achieved at 254 nm. Identification of phenolic compounds involved matching their retention times and UV spectra against authentic reference standards analyzed under matching conditions.
Effect of extracts on the growth curves of Escherichia coli
The broth microdilution technique in 96-well microtiter plates was employed to monitor the inhibitory influence of the extracts on E. coli growth kinetics. 100 µl of a bacterial suspension adjusted to 10⁶ cfu/ml were mixed with 100 µl of graded plant extract concentrations (i.e., MIC, MIC/2, MIC/4, and MIC/8). Wells containing inoculated broth without extracts served as the growth control. The plates were incubated at 37°C for 24 h, and optical density readings were recorded at 600 nm every 1 h using a microplate reader (BMG LabTech, Offenburg, Germany) to construct continuous kinetic curves. .
Anti- quorum sensing activity
To ensure that the extracts did not affect the bacterial growth, two QS assays were conducted at sub-inhibitory concentrations.
Evaluation of bacterial swimming and swarming motilities
Following minor optimizations to the established protocol, swarming migration was evaluated using semi-solid LB agar matrices (0.5%) supplemented with 0.5% filter-sterilized D (+)-glucose . To evaluate the anti-motility effects, the plant extracts were incorporated individually into the agar at graded concentrations, specifically ranging from MIC down to MIC/16, including MIC/2, MIC/4, and MIC/8 (corresponding to 50, 25, 12.5, 6.25, and 3.12 mg/ml for MLTE, and 30, 15, 7.5, 3.75, and 1.87 mg/ml for MLPE, respectively). Swimming translocation profiles were monitored using a semi-solid LB agar (Oxoid, Basingstoke, UK) medium (0.25% agar) containing the extracts at sub-MICs. Approximately 2 μl aliquot of a bacterial culture inoculum containing 10⁸ cfu/ml of E. coli were spotted at the center of the plate, followed by incubation at 37°C for 12 h (swarming motility) or 20 h (swimming motility). The control plate consisted of a semi-solid agar prepared without the extracts. Both types of motility were assessed by measuring the diameter of the circular growth spread around the inoculation point by using a calibrated ruler .
Determination of violacein production
To evaluate the potential of the extracts to inhibit the QS system at sub-MICs, suppression of violacein pigment synthesis by C. violaceum ATCC 12472 was assessed. An overnight Luria-Bertani (LB) broth culture of C. violaceum ATCC 12472 strain was prepared. The assay was performed according to Moradi et al. (2020). Violacein production inhibition was quantified in 96-well microtiter plates using C. violaceum ATCC 12472 strain. Briefly, 100 µl of LB broth containing sub-MICs of extracts were inoculated with 10 µl of a bacterial suspension 10⁶ cfu/ml and incubated at 30°C for 24 h in a shaking incubator. Untreated C. violaceum cultures served as the positive control, while wells containing broth and extracts alone acted as the negative control. Following incubation, the density of the extracted violacein pigment was measured colorimetrically at 585 nm using a microplate reader. The absorbance of each well was measured at 585 nm and 600 nm to determine pigment yields and host bacterial proliferation, respectively. Violacein pigment inhibition (%) was calculated using the following equation :
Inhibition (%)= [(OD585nm C − OD585nm T)/ OD585nm C] × 100
Where OD585nm C is the OD585nm of violacein production in control wells (without extracts) and OD585nm T is the OD585nm of violacein production in wells containing C. violaceum ATCC 12472 strain treated with the extracts.
Statistical analysis
All treatment data were obtained from three replicate, and results are expressed as mean ± standard deviation (±SD). Data were subjected to analysis of variance (ANOVA) by Tukey’s post-hoc test using SPSS software (version 16.0, SPSS Inc., Chicago, IL, USA) and the Chi-square test. A completely randomized design was used, with significance evaluated at p ≤ 0.05.
Results
Identification of Escherichia coli
Escherichia coli accounted for 24% of all isolates recovered during the study period. Of the 300 samples, 72 isolates (24%) were identified as E. coli: 14 E. coli isolates were from wound samples (WEC), nine isolates from sputum samples of pneumonia patients (SEC), and 49 isolates from urine samples of UTI patients (UEC). Identification of the isolates was further confirmed using the standard analytical profile index (API 20E) identification kits and the Vitek 2 system.
Investigating biofilm production
Biofilm production and density were measured using the microtiter plate assay technique, with absorbance readings recorded at 600 nm. The results of biofilm production are presented in Figure 1. All UEC isolates produced biofilms, but with varying degrees: 71.4% were strong producers, 20.4% moderate, and 8.2% weak. Among the WEC isolates, 71.4% produced biofilms, with 57.1% being strong producers and 14.3% moderate producers, whereas 28.6% were non-producers. For SEC isolates, 66.6% produced biofilms; 33.3% were strong, 22.2% moderate, and 11.1% weak, and 33.3% were being non-producers. Across all the combined clinical sources (i.e. urine, wound, and sputum), strong biofilm expression reached 63.8%, followed by moderate (19.4%) and weak (6.9%) production, whereas 9.7% of the isolates were non-biofilm-producers.
Antibacterial susceptibility screening
The antibacterial activities of MLPE and MLTE were evaluated through an in vitro inhibition zone assay using E. coli isolates. Antibacterial activities were observed for both MLPE and MLTE with concentrations ranging from 10 to 75 mg/ml, whereby strong inhibition of microbial growth was observed compared to ciprofloxacin (positive control) and DMSO (negative control), respectively. Compared to the control, the microbial proliferation was inhibited by both extracts, demonstrating high antibacterial efficacy with relative inhibition percentages ranging from 21.4% to 75.0% (Table 1). The highest relative inhibition percentage (75.0%) was observed for MLPE (75 mg/ml) against SEC isolates. The highest percentage efficacy for the hexane extract (75 mg/ml) was recorded as 46.4% against SEC isolates. Based on the established MIC and MBC parameters, both tested extracts demonstrated clear bactericidal properties against the isolates. However, MLPE showed stronger bacteriostatic effects against the isolates. The MIC values for both extracts ranged from 25 mg/ml to 50 mg/ml. Both extracts demonstrated a remarkable antibacterial potency, with the lowest MIC concentration of 25 mg/ml recorded for the MLPE extract against SEC isolates. The MIC value of MLTE was higher for UEC isolates (50 mg/ml) than for MLPE. The MBC of both extracts ranged from 50 to 100 mg/ml. The lowest MBC (50 mg/ml) was observed for MLPE against SEC isolates. Compared to the control, these MIC obtained results indicated that MLPE was more effective than MLTE against the E. coli isolates. Both UEC and WEC isolates had MIC values of 30 mg/ml for MLPE, while SEC isolates had an MIC of 25 mg/ml for MLPE. The MBC values required to completely inhibit growth of the tested E. coli isolates were approximately 50–60 mg/ml for MLPE and 80–100 mg/ml for MLTE.
Anti-biofilm activity of extracts
To determine the anti-biofilm efficacy of both extracts, crystal violet staining biomass assays were conducted using E. coli isolates, which were incubated with sub-MIC levels (MIC, MIC/2, MIC/4, and MIC/8), as shown in Figure 2. Both tested extracts showed different effects on the development of the preformed biofilms. The analysis displayed that the MIC of both extracts substantially reduced biofilm formation in all isolates. SEC isolates demonstrated a greater sensitivity to MLPE, followed by UEC isolates, whereas WEC isolates showed a lower sensitivity to the extracts at MIC/2. In contrast, WEC isolates demonstrated a greater sensitivity to MLTE, followed by SEC isolates, whereas UEC isolates showed a lower sensitivity to MLTE at MIC/2. Maximal anti-biofilm activity was achieved with MLPE, which disrupted the SEC isolates biofilm matrices by up to 90.9% at MIC/2, while MLTE reduced WEC isolate’s biofilm by up to 66.7% at MIC/2. Our data confirmed a concentration-dependent effect of the extracts, with a peak biofilm reduction recorded at the highest tested extract concentrations.
Table 1: Antibacterial activity and its relative percentage for both Melia azedarach phenolic leaf extract (MLPE) and Melia azedarach terpenoids leaf extract (MLTE) against E. coli isolates.
|
Extract |
Concentration (mg/ ml) |
Bacterial isolates |
p-value (isolate) |
|||||
|
UEC (NO. 49) |
SEC (NO. 9) |
WEC ( NO. 14) |
||||||
|
Inhibition zone (mm±SD) |
Relative inhibition (%) |
Inhibition zone (mm±SD) |
Relative inhibition (%) |
Inhibition zone (mm±SD) |
Relative inhibition (%) |
|||
|
MLTE |
10 |
7±1 |
25 |
6±0.95 |
21.4 |
7±0.8 |
25 |
< 0.001 |
|
25 |
9±0.54 |
32.1 |
8±0.47 |
28.6 |
10±0.22 |
35.7 |
< 0.001 |
|
|
50 |
10±0.47 |
35.7 |
9±0.55 |
32.1 |
11±0.47 |
39.3 |
< 0.001 |
|
|
75 |
12±0.72 |
42.9 |
13±0.63 |
46.4 |
11±0.28 |
39.3 |
< 0.001 |
|
|
MLPE |
10 |
12±0.36 |
42.9 |
11±0.37 |
39.3 |
12±0.94 |
42.9 |
< 0.001 |
|
25 |
15±0.38 |
53.6 |
14±0.28 |
50 |
16±0.38 |
57.1 |
< 0.001 |
|
|
50 |
16±0.47 |
57.1 |
16±0.38 |
57.1 |
18±0.62 |
64.3 |
< 0.001 |
|
|
75 |
19±0.66 |
67.9 |
21±0.66 |
75 |
20±0.44 |
71.4 |
< 0.001 |
|
|
Control (-) DMSO |
10 % |
0 |
0 |
0 |
0 |
0 |
0 |
|
|
Control (+) ciprofloxacin |
5 μg/ml |
28 |
100 |
28 |
100 |
28 |
100 |
|
|
MIC for hexane extract |
50 (mg/ ml) |
40 (mg/ ml) |
40 (mg/ ml) |
<0.001 |
||||
|
MIC for ethanol extract |
30 (mg/ ml) |
25 (mg/ ml) |
30 (mg/ ml) |
<0.001 |
||||
|
MBC for hexane extract |
100 (mg/ ml) |
80 (mg/ ml) |
80 (mg/ ml) |
<0.001 |
||||
|
MBC for ethanol extract |
60 (mg/ ml) |
50 (mg/ ml) |
60 (mg/ ml) |
<0.001 |
||||
Where: UEC: E. coli isolate from urine, SEC: E. coli isolate from sputum, WEC: E. coli isolate from wound, SD: standard deviation, DMSO: dimethyl sulfoxide, MIC: minimal inhibitory concertration, MBC: minimal bactericidal concertration. Data mean ± standard deviation (±SD) of triplicate independent experiments. p < 0.001 indicates a statistically significant difference among the bacterial isolates within the same concentration. NO. indicates the isolates number.
The GC-MS analysis of hexane extract (terpenoid extract)
Chemical profiling of the MLTE fraction by GC-MS analysis identified 11 compounds and their corresponding retention times (Table 2, Figure 3). The prominent terpenoids in the MLTE fraction were caryophyllene-β (Peak 2; RT: 11.48 min), germacrene D (Peak 4; RT: 16.25 min), and phytol (Peak 8; RT: 19.23 min). Furthermore, the MLTE extract comprised several alkanes, including tridecane, eicosane, and heptacosane.
HPLC analysis of ethanol extract (phenolic extract)
Phenolics in the M. azedarach MLPE fraction were fingerprinted using HPLC. These bioactive phenolics were detected based on their retention times and elution sequence (Table 3, Figure 4). The first three peaks were identified as the phenolic acids: gallic, chlorogenic, and caffeic acids. Other peaks were observed to be flavonoids, including catechin, catechin-7-O-glycoside, hyperoside, rutin, isoquercetin, quercetin, isorhamnetin, and chrysin. Chlorogenic acid (93.48 µg/ml) and catechin (86.42 µg/ml) were the most abundant constituents, with rutin being identified as the predominant flavonol.
Effect of extracts on the growth curves of Escherichia coli
To examine the effect of M. azedarach leaf extracts on the QS system, the growth of E. coli isolates was determined in the presence of various concentrations of MLPE and MLTE. The MIC values varied among the bacterial isolates: MLTE showed values of 50 mg/ml for UEC isolates and 40 mg/ml for WEC and SEC isolates. Meanwhile, MLPE showed MIC values of 30 mg/ml for UEC and WEC isolates and 25 mg/ml for SEC isolates. As shown in Figures 5 and 6, the growth curve of the control E. coli isolates entered the
Table 2: Identification of biologically active compounds in the M. azedarach hexane leaf extract (terpenoids extract) detected by Gas Chromatography-Mass Spectrometry (GC-MS) analysis.
|
Peak |
Retention time (min.) |
Chemical Compounds |
Nature of the compound |
|
1 |
9.80 |
Tridecane |
Alkanes |
|
2 |
11.48 |
Caryophyllene-β |
Terpenes |
|
3 |
15.36 |
Tetradecane |
Alkanes |
|
4 |
16.25 |
Germacrene D |
Terpenes |
|
5 |
17.11 |
6,10,14-Trimethylpentadecan-2-one |
Phytone |
|
6 |
17.96 |
Methyl palmitate |
Esters |
|
7 |
18.55 |
Palmitic acid |
Fatty acid |
|
8 |
19.23 |
Phytol |
Terpenes |
|
9 |
23.16 |
Eicosane |
Alkanes |
|
10 |
25.88 |
Hexacosane |
Alkanes |
|
11 |
27.45 |
Heptacosane |
Alkanes |
Table 3: Identification of biologically active compounds in the M. azedarach ethanol leaf extract (phenolic extract) detected by High-Performance Liquid Chromatography (HPLC) analysis.
|
Peak |
Retention time (min.) |
Chemical compounds |
Nature of the compound |
µg/ml |
|
1 |
3.25 |
Gallic acid |
Phenolic acids |
36.35 |
|
2 |
8.15 |
Chlorogenic acid |
Phenolic acids |
93.48 |
|
3 |
12.44 |
Caffeic acid |
Phenolic acids |
25.34 |
|
4 |
14.68 |
Catechin |
Flavonoids (flavan-3-ols) |
86.42 |
|
5 |
16.09 |
Catechin -7-O-glycoside |
Flavonoids (flavonols) |
37.88 |
|
6 |
19.88 |
Hyperoside |
Flavonoids (flavonols) |
4.26 |
|
7 |
22.39 |
Rutin |
Flavonoids (flavonols) |
56.33 |
|
8 |
25.33 |
Isoquercetin |
Flavonoids (flavonols) |
3.27 |
|
9 |
33.18 |
Quercetin |
Flavonoids (flavonols) |
6.36 |
|
10 |
42.59 |
Isorhamnetin |
Flavonoids (flavonols) |
0.67 |
|
11 |
45.55 |
Chrysin |
Flavonoids (flavones) |
10.68 |
exponential phase within 10–15 h of incubation and reached the stationary phase after 15 h. Both MLPE and MLTE completely inhibited E. coli growth at the MIC, whereas bacterial growth was slower at concentrations below the MIC, eventually reaching the logarithmic and stationary phases. Sub-MIC concentrations were determined through growth curve analysis. The MIC/8 concentration showed no inhibitory effect on E. coli growth, and all subsequent experiments were conducted at concentrations below sub-MICs.
Anti-QS Activity of extracts
Evaluation of anti-motility (Swimming and swarming assay)
The influence of both extracts on the motility of E. coli isolates was also evaluated, given the pivotal role that motility plays in biofilm formation by these bacteria. In this study, the anti-QS potential of both extracts at sub-MICs on the swarming and swimming motility of E. coli isolates was examined. The obtained results displayed that both extracts inhibited the swarming and swimming motility of E. coli isolates at various sub-MIC concentrations. At MIC/2, swarming was inhibited by 79.4% and 89.4% for MLTE and MLPE, respectively (Figure 7), with SEC isolates showing the highest percentage of inhibition. At MIC/2, swimming was inhibited by 53.3% and 65.3% for MLTE and MLPE, respectively (Figure 8), with UEC isolates demonstrating the highest percentage of inhibition. For MLPE-treated SEC isolates, the diameters of the swarming and swimming motility zones were decreased to 55.1% and 89.4%, respectively, compared to the control samples (Table 4). The motility of E. coli isolates decreased following exposure to both extracts at sub-MICs, in a concentration-dependent manner. At MIC/2, both extracts caused a considerably greater inhibition of swimming motility than at MIC/4. At MIC/2 for MLTE, the swimming motility of the UEC, SEC, and WEC E. coli isolates was reduced by 53.3%, 49.4%, and 50.1%, respectively. While at MIC/2 for MLPE, the motility was decreased by 65.3%, 55.1%, and 57.8%, respectively.
Table 4: Swimming and swarming motility zone diameter (mm) of E. coli isolates treated with sub- minimal inhibitory concertrations of the two extracts.
|
Extract |
Concentration (mg/ ml) |
Diameter of swimming zone (mm±SD) |
Diameter of swarming zone (mm±SD) |
p-value vs control |
||||
|
UEC |
SEC |
WEC |
UEC |
SEC |
WEC |
|||
|
Hexane extract |
MIC |
0 |
0 |
0 |
0 |
0 |
0 |
<0.001 |
|
MIC/2 |
20.3±0.7 |
15.8±0.63 |
19.4±0.85 |
10.3±0.35 |
3.8±0.1 |
7.4±0.2 |
<0.001 |
|
|
MIC/4 |
29.7±1.1 |
20.2±0.82 |
24.6±1.09 |
16.7±0.5 |
17.2±0.7 |
11.6±0.4 |
<0.001 |
|
|
MIC/8 |
37.8±1.4 |
25.8±1.2 |
34.5±1.3 |
20.8±0.96 |
18.8±0.8 |
21.5±1.1 |
<0.001 |
|
|
Ethanol extract |
MIC |
0 |
0 |
0 |
0 |
0 |
0 |
<0.001 |
|
MIC/2 |
15.1±0.7 |
14.0±0.4 |
16.4±0.8 |
6.1±0.3 |
3.0±0.1 |
4.4±02 |
<0.001 |
|
|
MIC/4 |
25.5±1.4 |
18.4±0.9 |
19.4±0.9 |
13.5±0.7 |
8.4±0.5 |
7.4±0.21 |
<0.001 |
|
|
MIC/8 |
33.5±1.3 |
25.5±1.2 |
25.7±1.3 |
19.5± |
11.5±0.4 |
20.7±1.2 |
<0.001 |
|
|
Control |
43.5±1.5 |
31.2±1.3 |
38.9±1.7 |
40.5±1.8 |
28.2±1.2 |
32.9±1.4 |
- |
|
Where: UEC: E. coli isolate from urine, SEC: E. coli isolate from sputum, and WEC: E. coli isolate from wound, SD: standard deviation, MIC: minimal inhibitory concertration. Data mean ± standard deviation (±SD) of triplicate independent experiments. p < 0.001 indicates a statistically significant difference among the bacterial isolates within the same concentration.
Violacein inhibition assay in chromobacterium violaceum
Figure 9 illustrates the effect of both extracts on violacein production by C. violaceum ATCC 12472 strain. Pigment production was reduced by 85.19% following treatment with MLPE (MIC/2), while MLTE achieved 76.35% inhibition at the same tested concentration. Sub-MIC concentrations did not affect the growth of C. violaceum ATCC 12472. Inhibition of violacein production (measured at 585 nm) was increased with increasing the extract concentrations below the MIC, relative to the extract-free control plates. Cell counts (OD600nm = 1) obtained results confirmed that growth of C. violaceum ATCC 12472 was not inhibited by the MLTE and MLPE extract’s treatment, where the results were compared to the untreated control group. Statistical analysis confirmed that both extracts elicited a peak suppression of violacein pigment synthesis at MIC/2. At lower concentrations of both extracts, such as MIC/32, no anti-QS efficacy was observed.
Discussion
Regarding the comparative epidemiological prevalence, nearly 90% of community-acquired UTIs and up to half of nosocomial UTIs are caused by UPEC ; .The most common causative agent of UTIs is E. coli (91%) . Consistent with previous literature, E. coli was the predominant isolate in this study, aligning with prevalence rates ranging from 36.8% to 49.1%, which were reported by Bharti et al. (2016); Nazmeen et al. (2018); Rafalskiy et al. (2020). Al-Taie et al. (2014) revealed that the percentage of E. coli isolated from wounds was 15.73%. Gagaletsios et al. (2025) reported that E. coli isolates were recovered from 65 urine samples, one swab, and one sputum sample. E. coli isolates were most frequently obtained from urine samples (92.2%), followed by wound samples (3.9%) . Another study demonstrated that 35% of E. coli were isolated from urine samples, followed by 5% and 17% from wound and sputum, respectively .
In terms of the phytochemical distribution trend, several compounds have been currently identified from M. azedarach extracts, including unique products belonging to the terpenoids, specifically limonoids and tirucallane-type triterpenoids. The obtained results showed higher levels of flavonoids and phenolic compounds in more polar fractions, especially in the ethanol fraction. In general, the absorption spectra reflected a trend related to polarity, with hexane extract containing non-polar components and ethanol extract containing highly polar compounds, as previously demonstrated by Batubara et al. (2025).
Regarding the chromatographic and phytochemical profiling, GC-MS analysis revealed 11 compounds, including β-caryophyllene, neophytadiene, and a phytol isomer, as major constituents. These chemical profiles align with previous findings reported by Hassan et al. (2025), confirming the consistent presence of diverse bioactive terpenoids and other phenolic compounds in M. azedarach leaves. Similarly, Batubara et al. (2025) revealed the presence of extended-chain hydrocarbons in the leaf extracts of the same plant. The current notable abundance of both heptacosane and eicosane within leaf extracts further supported this finding. HPLC analysis was used to identify and quantify flavonoids and phenolic compounds in the ethanolic extract of M. azedarach, confirming the findings of Hemdan et al. (2023), who reported the presence of numerous phenolic compounds in M. azedarach. Catechin and chlorogenic acid were observed to be the major constituents of the phenolic extract.
Concerning the comparative antibacterial efficacy, the inhibition zones diameters measured in this study (with corresponding relative inhibition percentages detailed in the results) agree with the previous reported values of 15-13 mm recorded at 195 mg/ml of the M. azedarach methanolic leaf extract against E. coli . Similarly, the methanolic leaf extract suppressed the proliferation of MDR E. coli K1-1, recording a 10.93 mm inhibition zone diameter, whereas hexane leaf extract generated a 7.4 mm zone diameter . This finding is also consistent with the reported ranges of 12.0–16.7 mm (at 300 mg/ml) and 10.0–13.0 mm (at 150 mg/ml) for methanol leaf extract of M. azedarach against E. coli . Likewise, the ethanolic extract of M. azedarach has been shown to exert bactericidal activity against E. coli, with a recorded inhibition zone diameter of 16 mm .
In terms of the minimum inhibitory parameters, the MIC of MLPE against E. coli ranged from 25 to 30 mg/ml, and the MBC values ranged from 50 to 60 mg/ml. Meanwhile, these recorded values were higher than those reported by Getahun et al. (2025) for M. azedarach methanolic leaf extract against E. coli, where the MIC and MBC were 6.09 mg/ml and 12.18 mg/ml, respectively. This discrepancy is directly related to the different extraction solvents and the configurations evaluated across the studies. This is consistent with the findings of Hemdan et al. (2023), who reported that M. azedarach extract was effective against E. coli at an MIC of 50 mg/ml. The methanol leaf extract exhibited a superior antibacterial efficacy against E. coli compared to the hexane extract, demonstrating lower MIC (1 vs. 20 mg/ml) and MBC (2 vs. 20 mg/ml) values .
Regarding the underlying molecular mechanisms of action, M. azedarach contained abundant polyphenols, which may express an antibiotic activity. Its antibacterial activity was attributed to the disruption of the cell wall’s integrity and cohesion, leading to the leakage of cell contents and cell lysis . Gallic acid, a phenolic acid known for its antibacterial efficacy, triggers irreversible permeability changes, membrane rupture, and pore formation ; ; . The phenolic compounds induce microbial death by blocking enzyme active sites and acting as hydrogen ion carriers to disrupt ATP energy production ; . The antibacterial activity of the hexane extract of M. azedarach leaves was attributed to its high proportion of sesquiterpenes, most notably β-caryophyllene, which is known to penetrate the microbial cell membranes and inhibit its growth . The terpenoids induce membrane damage in bacteria through direct contact with the cells, increasing membrane permeability, interfering with ion transport and membrane proteins, affecting cellular enzymes, and inhibiting DNA synthesis .
With respect to biofilm formation dynamics, biofilm formation was observed in 90.1% of the evaluated isolates. This finding corroborates that of Gagaletsios et al. (2025), who reported that approximately 87% of E. coli strains exhibited a pronounced ability to form biofilms. In a similar study performed by Gagaletsios et al. (2025), E. coli strains were categorized based on their biofilm capabilities, where 71 isolates exhibited a moderate production, 16 showed high production, and 13 displayed a weak biofilm production. Bacterial biofilms facilitate adherence to host cells and act as a protective barrier against the immune system, thereby increasing antibiotic resistance and complicating the bacterial treatment .
Regarding the specific anti-biofilm mechanisms, the M. azedarach methanol leaf extract exhibited a peak anti-biofilm efficacy, achieving up to 60.26% inhibition of E. coli biofilm formation . Fink (2023) demonstrated that eugenol can remove up to 67% of E. coli biofilm. A similar trend was observed for limonene (46%), while terpineol removed up to 44% of E. coli biofilm. Flavonoid compounds have likewise demonstrated an anti-biofilm efficacy by inhibiting biofilm production . Flavonoids possess potent antibacterial and anti-biofilm properties that enable them to combat a wide range of pathogenic bacteria . The biological activity of these extracts was influenced by several parameters, including the type of extraction solvent, geographic origin, harvesting period, storage climate, and dehydration techniques .
Regarding the inhibition of QS and bacterial motility, the obtained results showed that both extracts suppressed the swimming and swarming motility, along with biofilm formation, across all E. coli isolates at sub-MIC levels without affecting the bacterial growth. However, these concentrations had a lesser inhibitory effect on swimming motility. Swimming, unlike swarming, results from rotation of the bacterial flagellar rotor and is not a multicellular behavior . Our study revealed the anti-QS activity of both extracts against the tested strain C. violaceum ATCC 12472, which synthesizes violacein under the control of the QS system . Inhibition of QS-dependent violacein formation by sub-MIC concentrations of both extracts yielded favorable results. Bacterial locomotion and various virulence factors are heavily dependent on QS mechanisms . Through motility, E. coli strains can migrate and colonize new territories, which ultimately promotes biofilm proliferation .
Regarding the surface migration and swarming dynamics, the swarming motility represents a QS-dependent, coordinated surface migration that drives biofilm assembly and infection by adapting the bacteria to environmental challenges, virulence, and drug resistance ; . Natural phytochemicals are extensively documented for their anti-motility properties, particularly in weakening the migratory capabilities of E. coli (Garcia-Heredia et al., 2016; ; . Disrupting the QS pathways using botanical agents represents a viable strategy against MDR strains . The phenolic phytochemicals can competitively inhibit QS receptors by blocking N-acyl homoserine lactones (AHL) signaling molecules; thus, disrupting the swarming motility, representing a remarkable alternative for limiting or preventing biofilm-associated infections . Decreased production of extracellular polysaccharides may explain this inhibition, negatively affecting the migratory capabilities of the microbial pathogens ; . Multiple studies have also reported an inhibition of bacterial movement by phenolic compounds, which completely blocked the swarming motility ; .
Conclusions and Recommendations
The results of the present investigation indicated that Melia azedarach contains potential antibacterial components, which may be of considerable value to the pharmaceutical industry as a therapy against infectious diseases. Specifically, the experimental findings demonstrated the distinct effectiveness of the extracts. Notably, the maximum relative growth inhibition reached 75.0% for MLPE and 46.4% for the hexane extract at a concentration of 75 mg/ml. Additionally, peak biofilm inhibition reached 90.9% for MLPE and 66.7% for MLTE at their respective MIC/2 values. Furthermore, at the same concentration (MIC/2), swarming motility was suppressed by up to 89.4% for MLPE and 79.4% for MLTE, while swimming motility was reduced by up to 65.3% and 53.3%, respectively. Further studies are recommended to identify and characterize the biologically active constituents responsible for this antibacterial effectiveness. Furthermore, a future validation using an expanded clinical sample size is recommended.
Acknowledgement
The authors would like to thank Mr. Laith A. Ismael for his valuable guidance and support in the statistical review of this study.
Novelty Statement
This study utilized the ultrasound-assisted extraction (UAE) method, which serves as a pioneering investigation confirming the multi-targeted efficacy of these green botanical fractions, demonstrating up to 75.0% relative growth inhibition, 90.9% biofilm inhibition, and profound restrictions in motilities (up to 89.4% for swarming and 65.3% for swimming). Notably, within the available literature, there is a distinct lack of studies evaluating the targeted inhibitory effect of Melia azedarach extracts against bacterial violacein pigment production, where our findings demonstrated a remarkable 85.19% inhibition at sub-inhibitory concentrations.
Author’s Contributions
IJK: Conceptualization, methodology, validation, investigation, resources, writing original draft, writing review and editing, supervision, funding acquisition, visualization, and project administration. AAJ: Methodology, formal analysis,investigation, data curation, writing original draft,writing review, editing, funding acquisition, and resources.
HAH: Conceptualization, methodology, validation, investigation, Software, resources, writing original draft, writing review, editing, and project administration.
All authors have read and agreed to the published version of this manuscript.
Funding source
This research did not receive any specific grant from any funding agencies.
Ethical approval
This study was conducted in accordance with the ethical approval granted by Al-Furat Al-Awsat Technical University, under Protocol No. 95/ ALMS dated August 16, 2025. Written consent of the participants was obtained.
Generative AI and AI assisted technology statement
The authors declare that no generative AI and AI assisted technology was used in the creation of this manuscript.
Conflict of interests
The authors have declared no conflicts of interest.
Figures
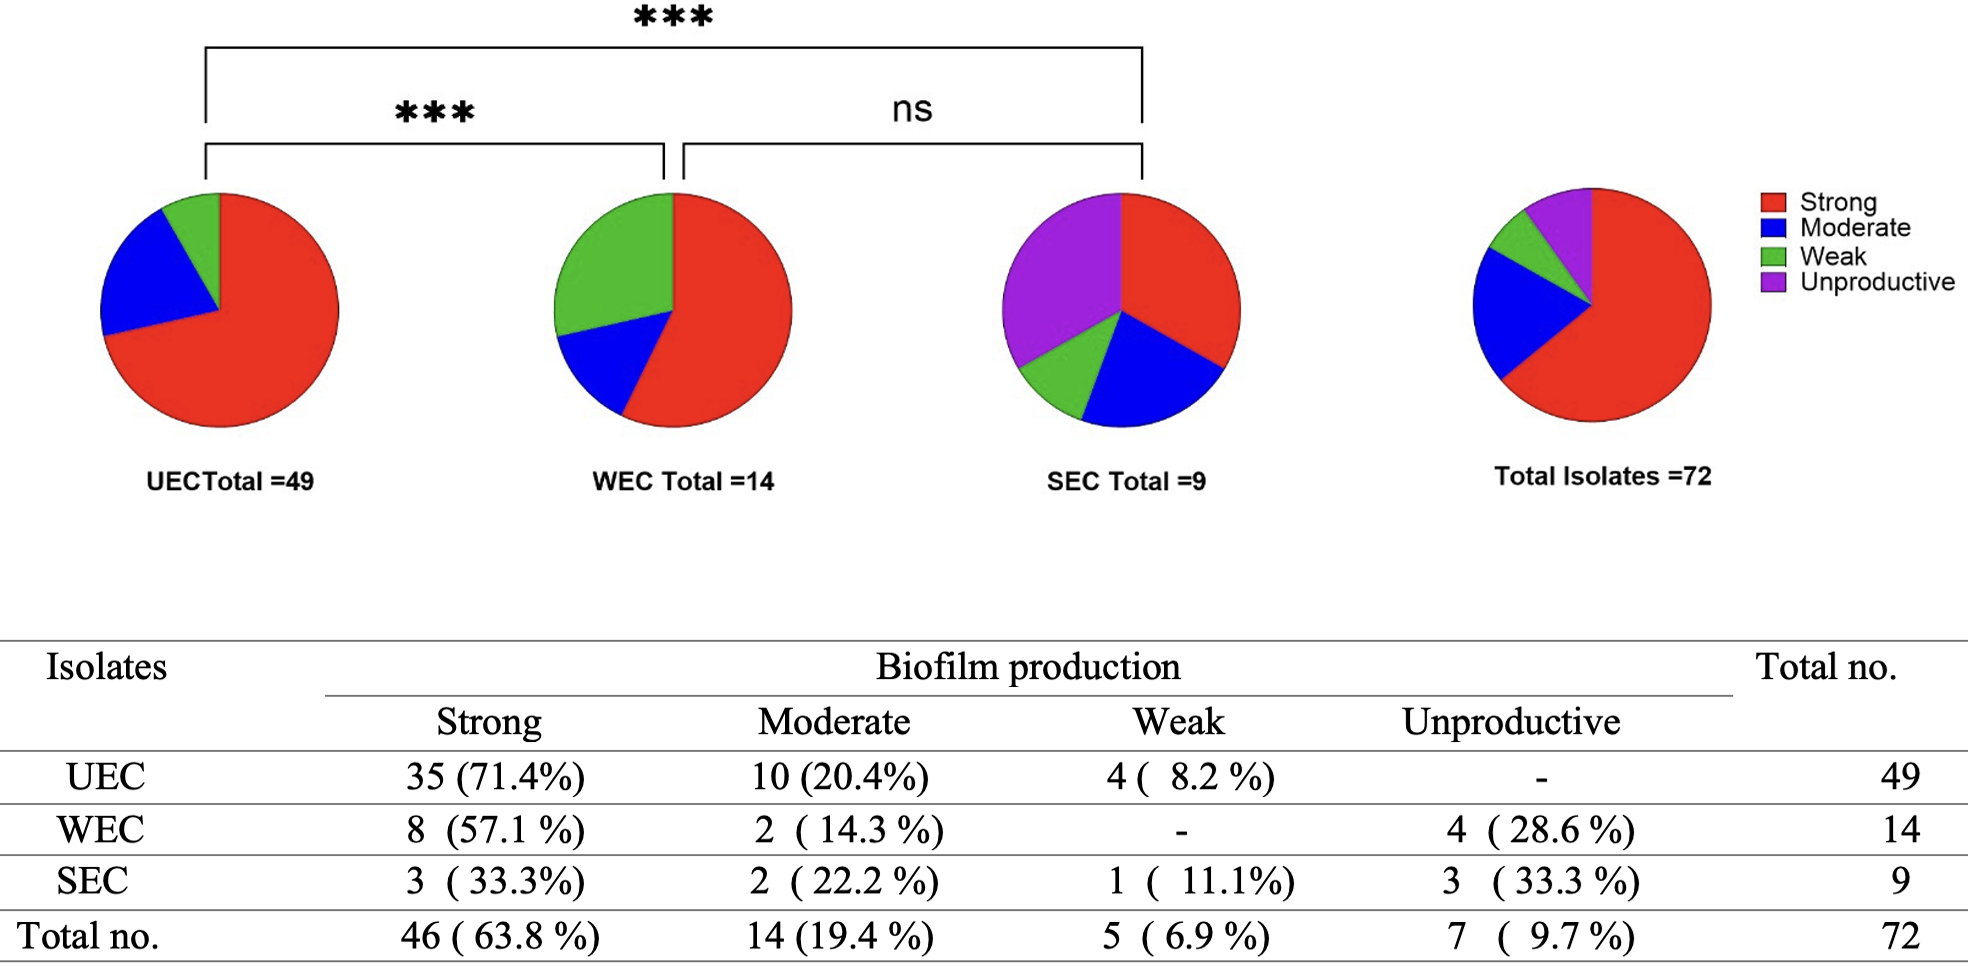
Biofilms formation by E.coli isolates (UEC: E. coli from urine, SEC: E. coli from sputum, and WEC: E. coli from wound). Classification of biofilm production in urine, wound, and sputum isolates. Proportions of different biofilm production levels among all the tested isolates. *** indicates a statistically significant difference (p < 0.001) based on the Chi-square test of independence. ns indicates a non-significant difference.
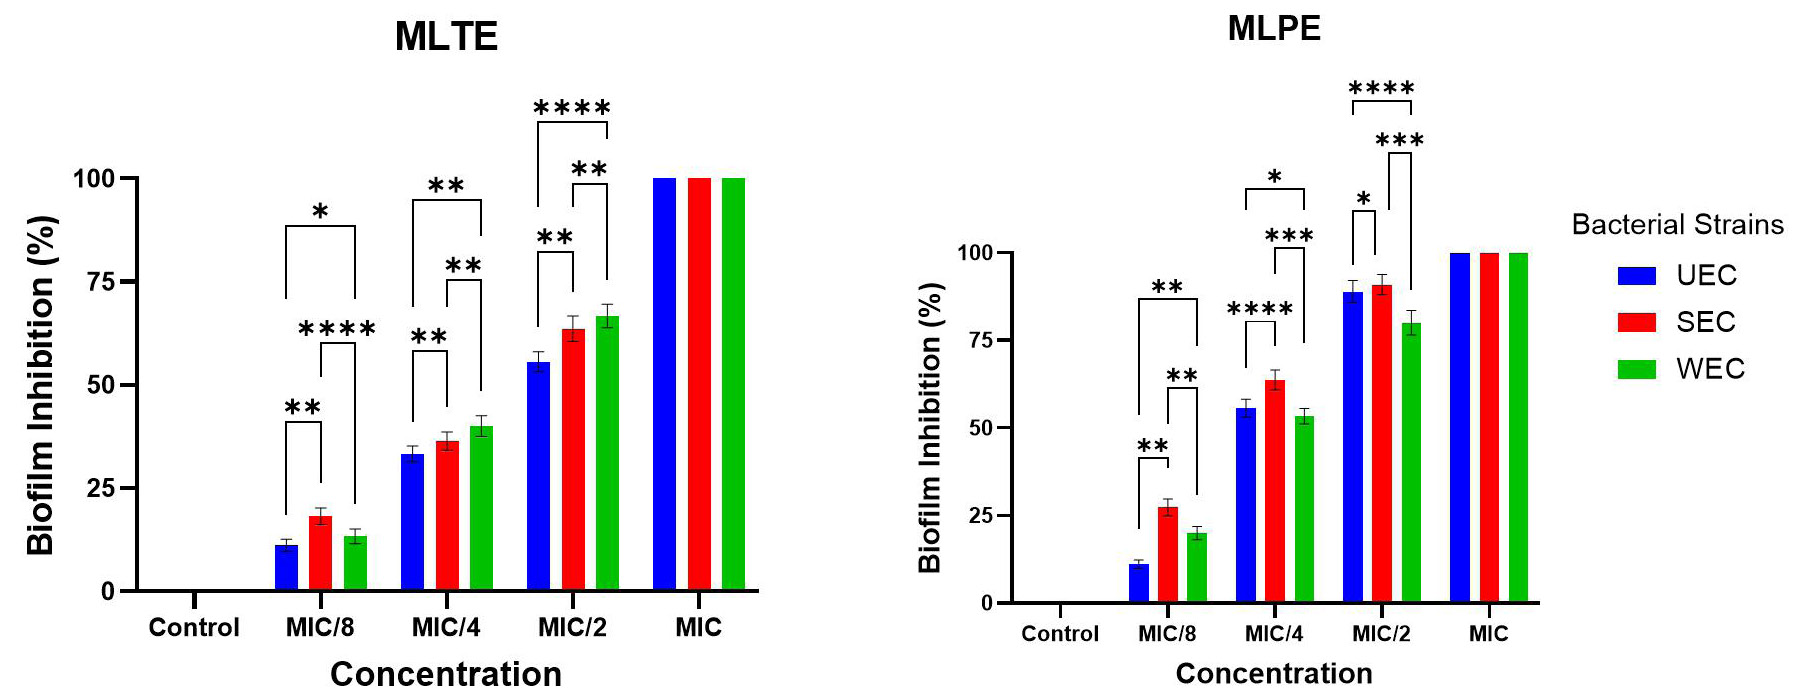
Percentages of biofilm inhibition of E. coli isolates (UEC: E. coli from urine, SEC: E. coli from sputum, and WEC: E. coli from wound), in the presence of M. azedarach leaf phenolic extract (MLPE) and M. azedarach leaf terpeniod extract (MLTE) at sub- minimal inhibitory concertrations. Error bars represent the standard deviation (SD) calculated from three independent experimental replicate. (*p < 0.05, ** p < 0.01, *** p < 0.001, **** p < 0.0001 ) indicate statistically significant differences.
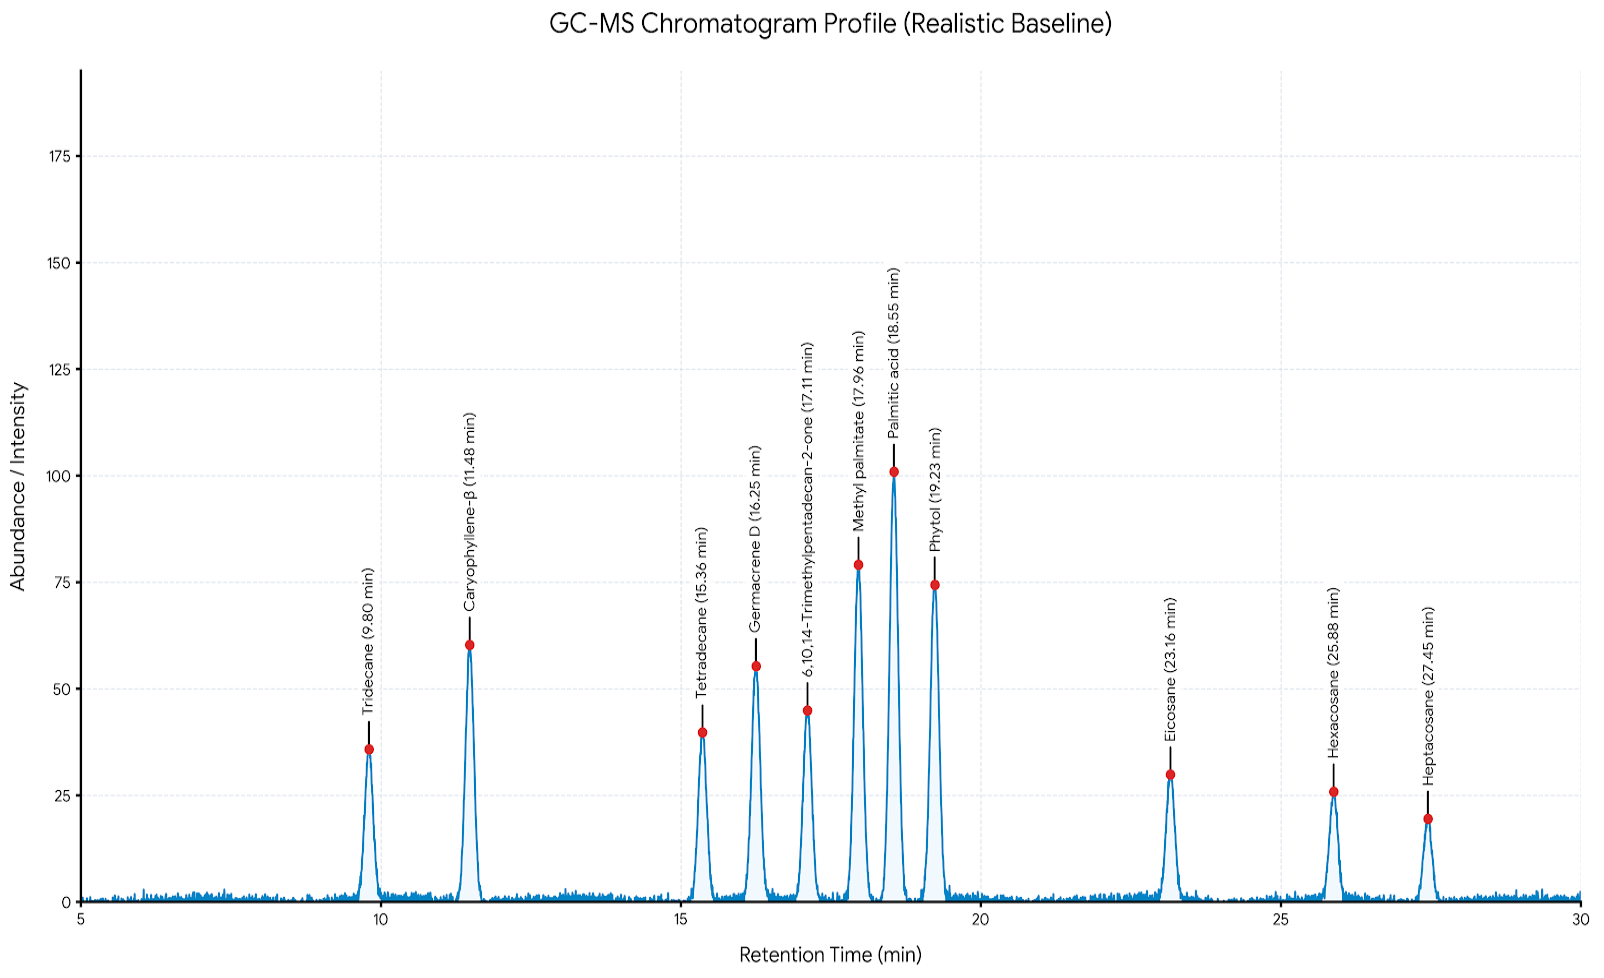
GC-MS chromatogram profile of Melia azedarach leaf terpenoid extract (MLTE), demonstrating the separation peaks of the prominent bioactive compounds.
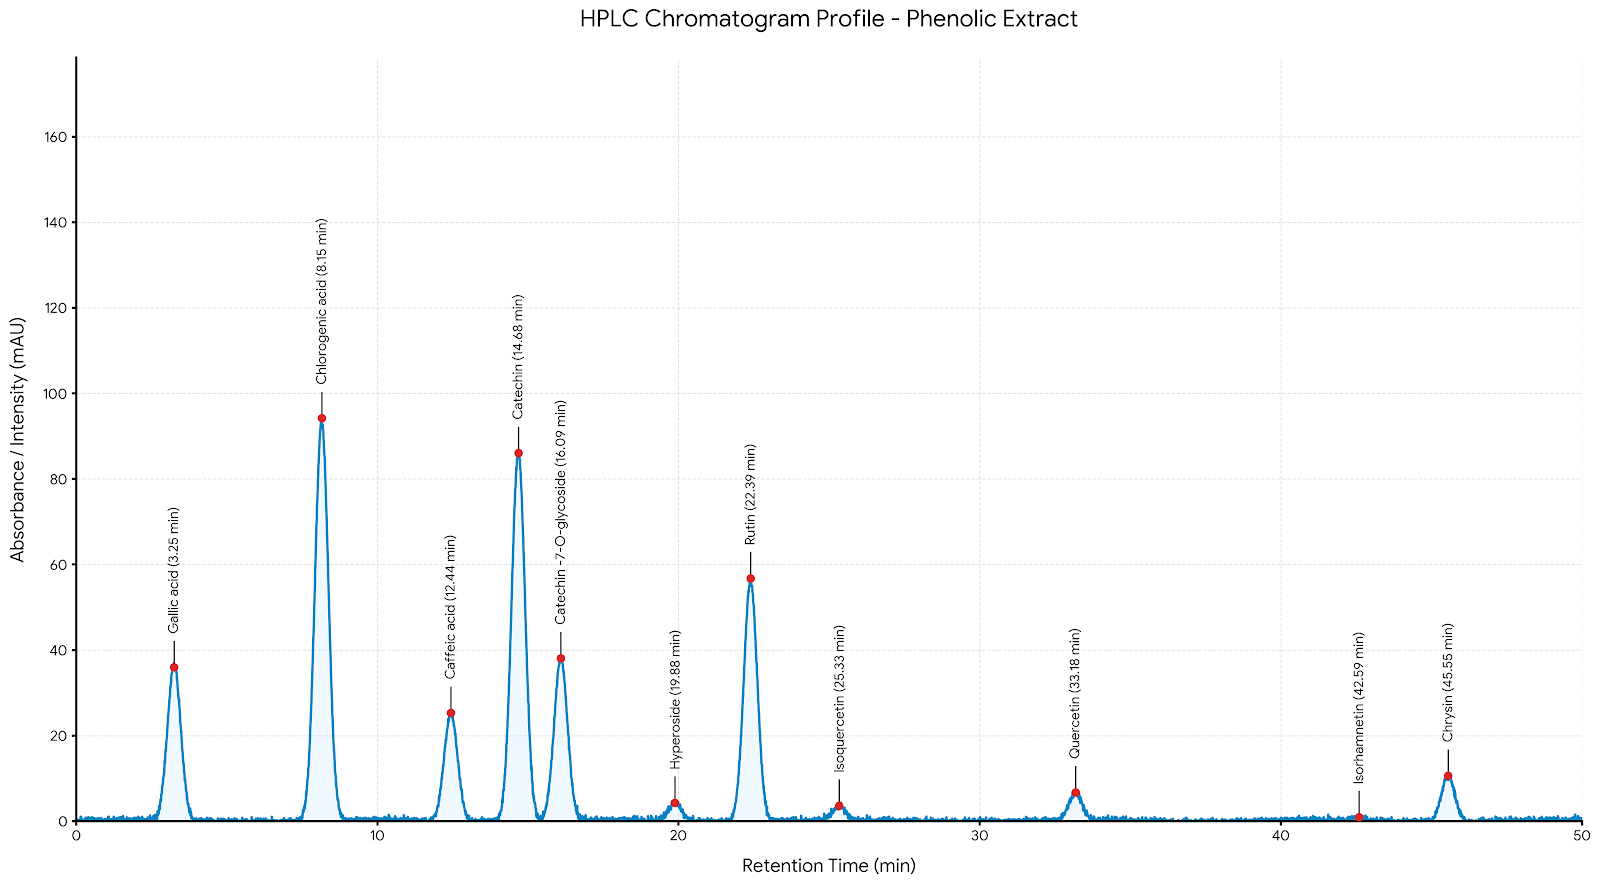
HPLC-UV chromatogram profile of Melia azedarach leaf phenolic extract (MLPE), demonstrating the separation peaks of the prominent bioactive compounds evaluated at 254 nm.
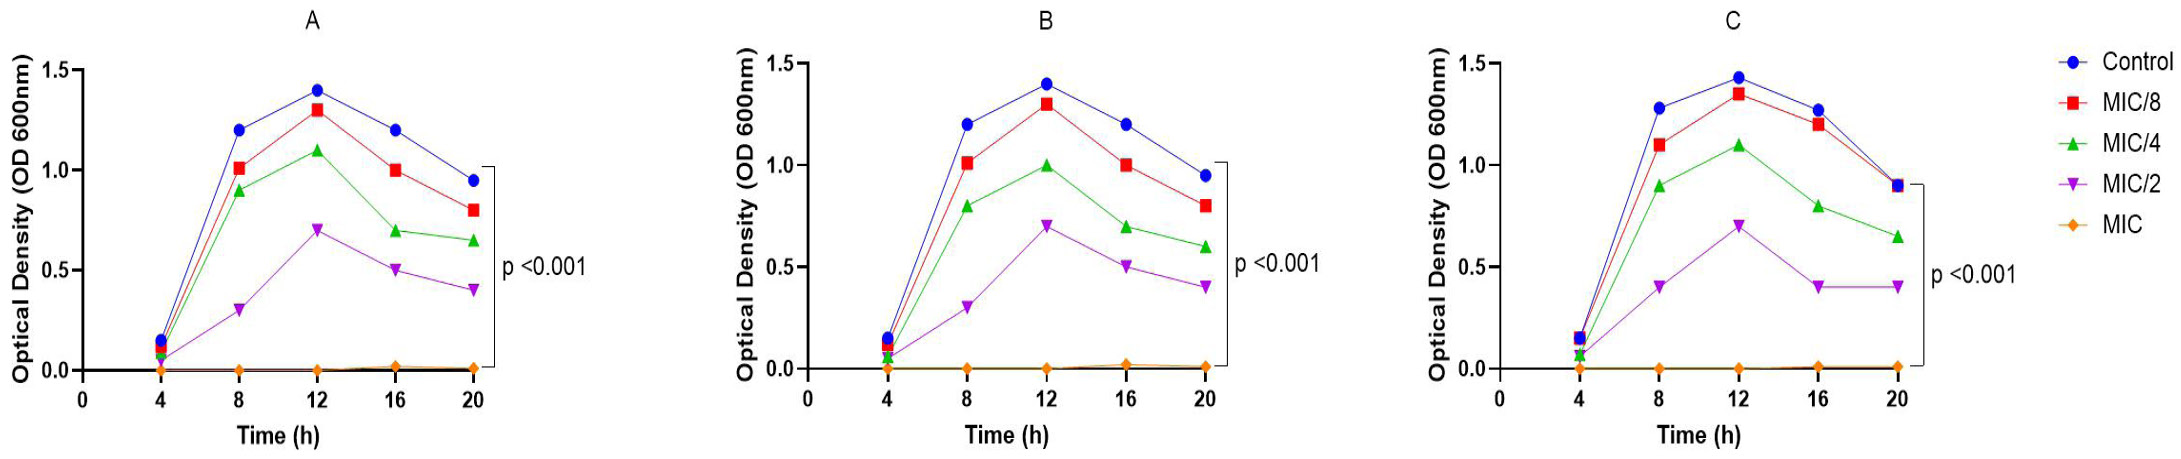
Growth curves of E. coli isolates: (A) E. coli from urine, (B) E. coli from sputum, (C) E. coli from wound, treated with M. azedarach leaf phenolic extract (MLPE) at sub- minimal inhibitory concertrations. p < 0.001 indicates statistically significant differences.
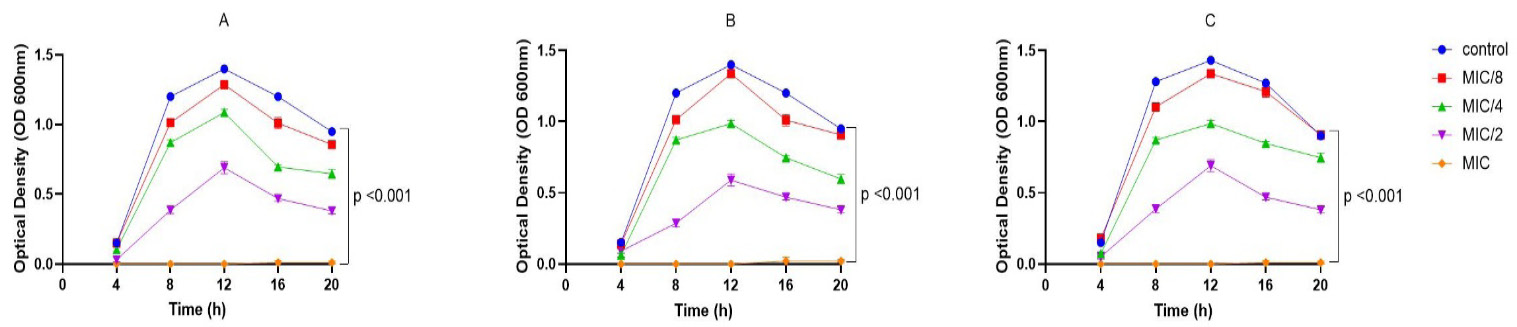
Growth curves of E. coli isolates: (A) E. coli from urine, (B) E. coli from sputum, (C) E. coli from wound, treated with M. azedarach leaf terpeniod extract (MLTE) at sub- minimal inhibitory concertrations. p < 0.001 indicates statistically significant differences.
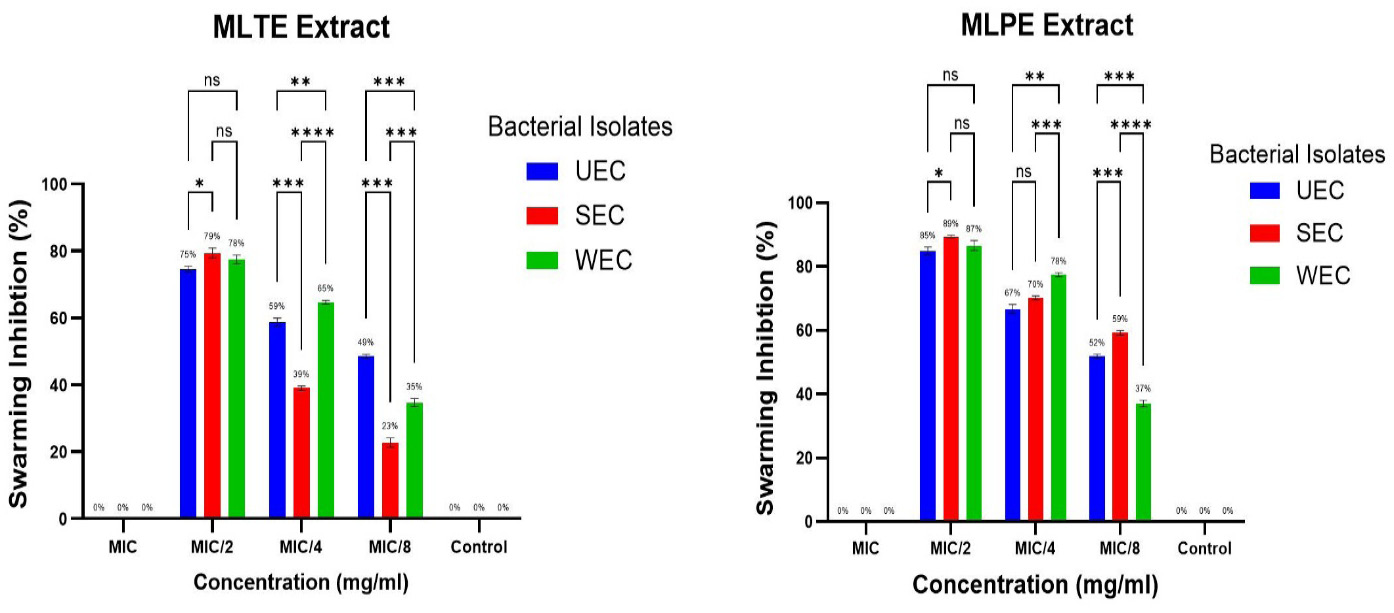
Swarming motility inhibition of E. coli isolates (UEC: E. coli from urine, SEC: E. coli from sputum, and WEC: E. coli from wound) upon exposure to sub- minimal inhibitory concertrations levels of the M. azedarach leaf phenolic extract (MLPE) and M. azedarach leaf terpeniod extract (MLTE). Error bars represent the standard deviation (SD) calculated from three independent experimental replicate. (* p < 0.05, ** p < 0.01, *** p < 0.001, and **** p < 0.0001 ) indicate statistically significant differences . ns indicates a non-significant difference.
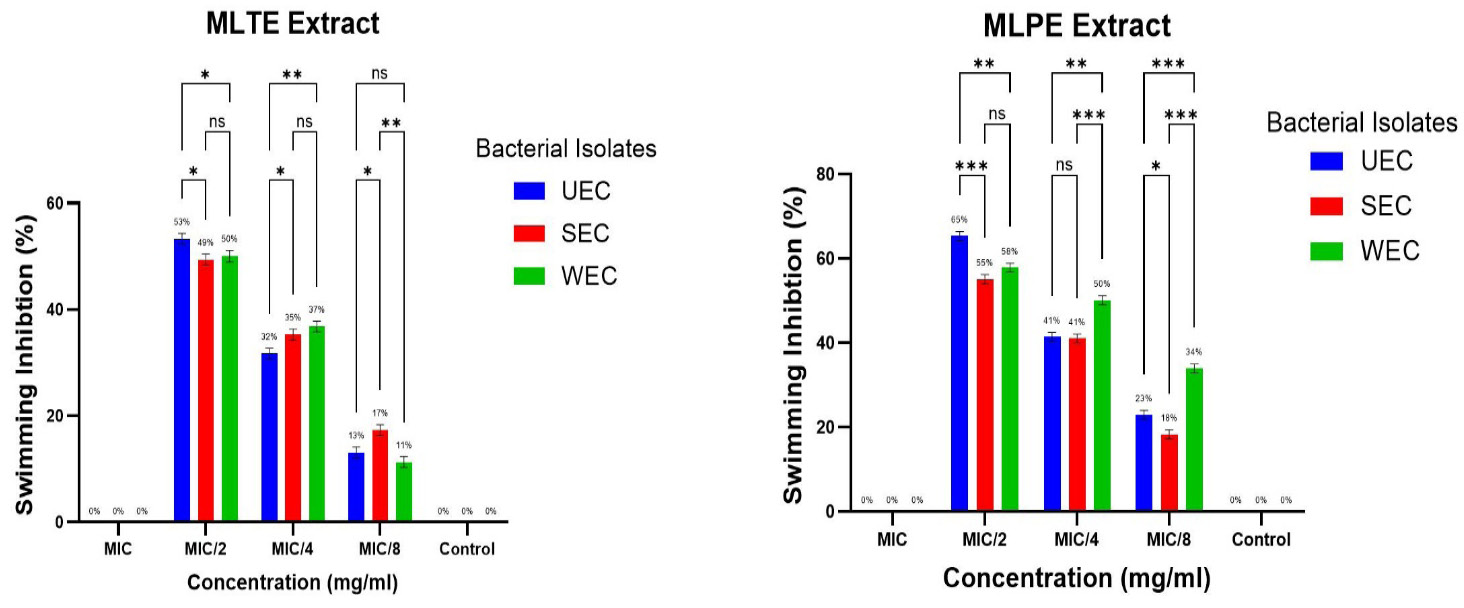
Swimming motility inhibition of E. coli isolates(UEC: E. coli from urine, SEC: E. coli from sputum, and WEC: E. coli from wound) upon exposure to sub- minimal inhibitory concertrations levels of the M. azedarach leaf phenolic extract (MLPE) and M. azedarach leaf terpeniod extract (MLTE ). Error bars represent the standard deviation (SD) calculated from three independent experimental replicate. (* p < 0.05, ** p < 0.01, and *** p < 0.001 ) indicate statistically significant differences . ns indicates a non-significant difference.
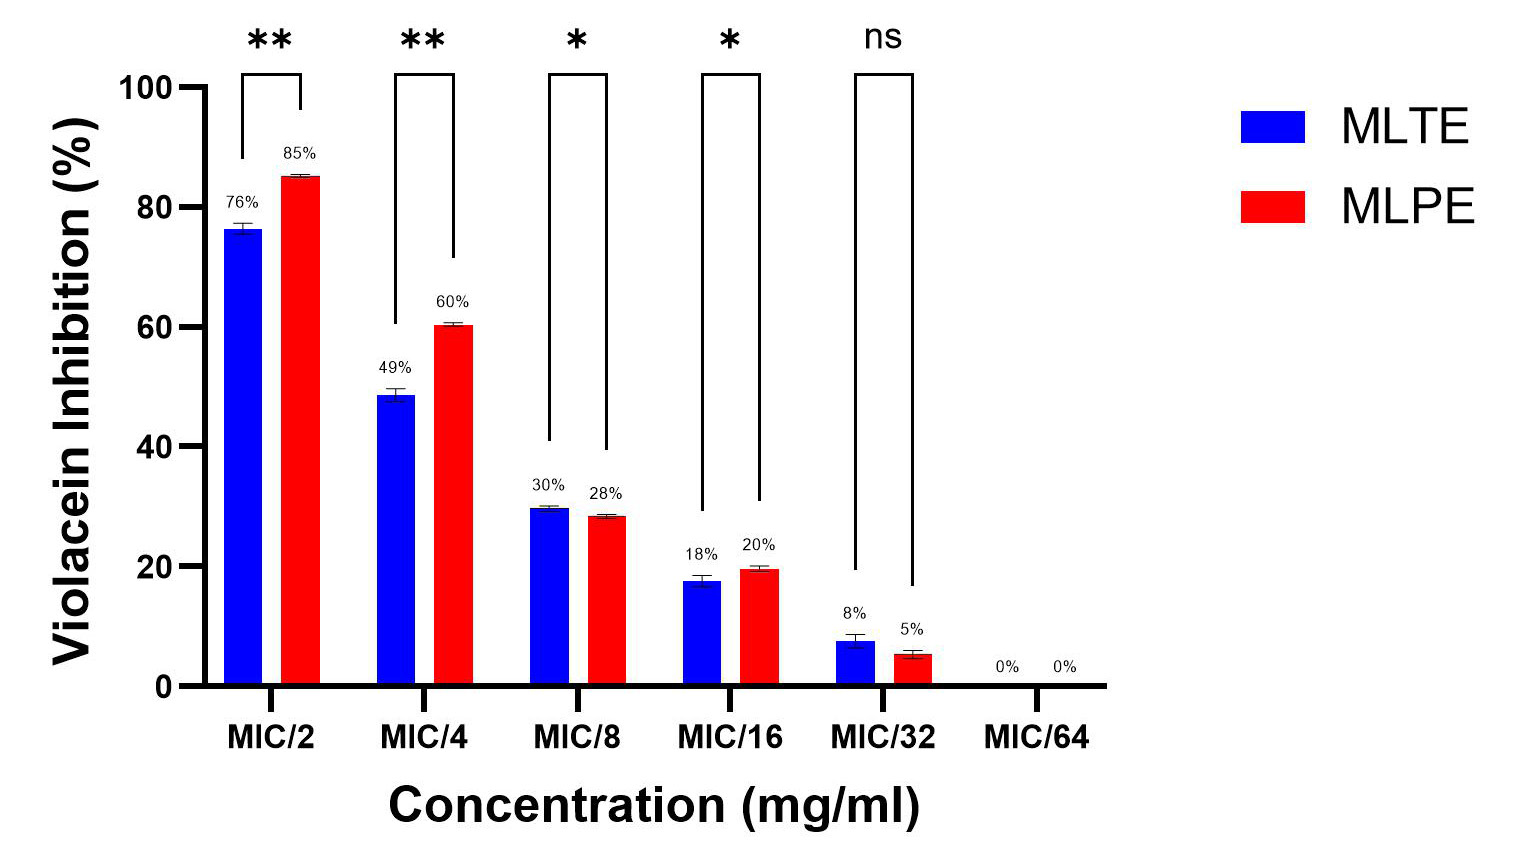
Effect of sub- minimal inhibitory concertration levels of the M. azedarach leaf phenolic extract (MLPE) and M. azedarach leaf terpeniod extract (MLTE) on violacein production by C. violaceum ATCC 12472 strain. (* p < 0.05, ** p < 0.01) indicate statistically significant differences . ns indicates a non-significant difference.
References
- Abdul Hamid, S.A. and Khoshaba, R.M., 2024. Antibiotic resistance, biofilm formation, and identification of FimH and FimA adhesion genes in uropathogenic Escherichia coli (UPEC) isolated from patients in Baghdad Province. Iraqi J. Sci., 65( 10): 5546-5554. https://doi.org/10.24996/ijs.2024.65.10.19[CrossRef]
- Al-Aboudi, Z.F. and Al-Azawi, A.H., 2024. Antibacterial and antibiofilm activity of phenolic compounds extracted from Camellia sinensis and evaluate the effect on the gene expression (Clfa) in Staphylococcus aureus. Pak. J. Life Soc. Sci., 22(1): 2288-2304. https://doi.org/10.57239/PJLSS-2024-22.1.00169[CrossRef]
- Al-Aboudi, Z.F. and Al-Azawi, A.H., 2025. Antibacterial and antibiofilm activity of phenolic compounds extracted from Camellia sinensis and evaluate its effect on the gene expression of pelA gene in Pseudomonas aeruginosa. Iraqi J. Biotechnol., 24(2): 55-70.
- Alrashidi, A.A., Noumi, E., Snoussi, M. and De Feo, V., 2022. Chemical composition, antibacterial and anti-quorum sensing activities of Pimenta dioica L. essential oil and its major compound (Eugenol) against foodborne pathogenic bacteria. Plants, 11: 540. https://doi.org/10.3390/plants11040540[CrossRef]
- Alshammari, M., Ahmad, A., Al-Khulaifi, M., Al-Farraj,D., Alsudir, S., Alarawi, M., Takashi, G. and Alyamani, E., 2023. Reduction of biofilm formation of Escherichia coli by targeting quorum sensing and adhesion genes using the CRISPR/Cas9-HDR approach, and its clinical application on urinary catheter. J. Infect. Publ. Health, 16: 1174–1183. https://doi.org/10.1016/j.jiph.2023.05.026[CrossRef]
- Al-Taie, L.H., Hassan, S., Al-Mayah, K. and Talib, S., 2014. Isolation and identification of bacterial burn wound infection and their sensitivity to antibiotics. Al-Mustansiriyah J. Sci., 25(2): 17-24.
- Batubara, I., Prayogo, Y.H., Dumarcay, S., Gerardin, C., Gerardin, P., Wayan Darmawan, W., Resmeiliana, I., Ruiz, M.C., Ilmiawati A., Kuspradini, H. and Rafi, M., 2025. Phytochemical profile and in vitro–in silico antibacterial activity of Melia azedarach leaf and twig extracts obtained using solvents of different polarities. Science, 7: 167. https://doi.org/10.3390/sci7040167[CrossRef]
- Benyoussef, W., Deforet, M., Monmeyran, A. and Henry, N., 2022. Flagellar motility during E. coli biofilm formation provides a competitive disadvantage which recedes in the presence of co-colonizers. Front. Cell. Infect. Microbiol., 12: 896898. https://doi.org/10.3389/fcimb.2022.896898[CrossRef]
- Bharti, A.K., Farooq, U., Singh, S., Kaur, N., Ahmed, R. and Singh, K., 2016. Incidence of enterococcal urinary tract infection and it’s sensitivity pattern among patients attending Teerthanker Mahaveer Medical College and Research Centre, Moradabad, India. Int. J. Sci. Study, 12(3): 115-119.
- Biswas, B., Golder, A., Mazumder, K. and Sadhu, S., 2021. Terpenoids enriched ethanol extracts of aerial roots of Ceriops decandra (Griff.) and Ceriops tagal (Perr.) promote diuresis in mice. Heliyon, 7: e07580. https://doi.org/10.1016/j.heliyon.2021.e07580[CrossRef]
- Bose, S.K., Chauhan, M., Dhingra, N., Sanjay, C.S. and Harjai, K., 2020. Terpinen-4- ol attenuates quorum sensing regulated virulence factors and biofilm formation in Pseudomonas aeruginosa. Future Microbiol., 15: 5111. https://doi.org/10.2217/fmb-2019-0204[CrossRef]
- Chaichana, N., Sukpondma, Y., Sermwittayawong, D. and Sermwittayawong, N., 2024. Inhibition of quorum sensing, biofilm and motility of Escherichia coli by Staphylococcus warneri MG1_8 Bioactive Compounds. Sains Malays., 53(12): 3291-3305. https://doi.org/10.17576/jsm-2024-5312-13[CrossRef]
- Dahham, S.S., Tabana,Y.M., Iqbal, M.A., Ahamed M.B., Ezzat, M.O., Majid, A.S. and Majid, A.S., 2015. The anticancer, antioxidant and antimicrobial properties of the sesquiterpene β-caryophyllene from the essential oil of Aquilaria crassna. Molecules, 20: 11808-11829. https://doi.org/10.3390/molecules200711808[CrossRef]
- David, K., Anumudu, C.K. and Onyeaka, H., 2026. Antibiofilm effect of nisin and clove oil (Syzygium aromaticum) on Escherichia coli biofilms. Heliyon, 12: e44501. https://doi.org/10.1016/j.heliyon.2026.e44501[CrossRef]
- Dimitrova, P.D., Damyanova, T. and Paunova-Krasteva, T., 2023. Chromobacterium violaceum: A model for evaluating the anti- quorum sensing activities of plant substances. Sci. Pharm., 91(3): 33. https://doi.org/10.3390/scipharm91030033[CrossRef]
- Fink, R., 2023. Terpenoids as natural agents against food-borne bacteria evaluati on of biofilm biomass versus viability reduction. Processes, 11: 148. https://doi.org/10.3390/pr11010148[CrossRef]
- Gagaletsios, L.A., Kikidou, E., Galbenis, C., Bitar, I. and Papagiannitsis, C.C., 2025. Exploring virulence characteristics of clinical Escherichia coli isolates from Greece. Microorganisms, 13: 1488. https://doi.org/10.3390/microorganisms13071488[CrossRef]
- García-Heredia, A., García, S., Merino-Mascorro, J.Á., Feng, P. and Heredia, N., 2016. Natural plant products inhibits growth and alters the swarming motility, biofilm formation, and expression of virulence genes in enteroaggregative and enterohemorrhagic Escherichia coli. Food Microbiol., 59: 124-132. https://doi.org/10.1016/j.fm.2016.06.001[CrossRef]
- Getahun, N., Fitwi, B.A. and Woshie, A.H., 2025. In vitro antibacterial evaluation of leaf extracts of medicinal plants in the treatment of Escherichia coli, Klebsiella pneumoniae, and Salmonella Calve Diarrhea. Preprints.org.
- Hassan, W.I., Zamani, A.A., Rashid, Y.D. and Jamshidi, A., 2025. Phytochemical composition of fruit and leaf terpenoid extracts of Melia azedarach L. and their bioactivity against Culex pipiens L. (Diptera: Culicidae). Sarhad J. Agric., 41(5): 60-70. https://doi.org/10.17582/journal.sja/2025/41.5.60.70[Full text][CrossRef]
- Hemdan, B.A., Mostafa, A., Elbatanony, M., El-Feky, A.M., Paunova-Krasteva, T., Stoitsova, S., El-Liethy, M.A., El-Tawee, G.E. and Abu Mraheil, M., 2023. Bioactive Azadirachta indica and Melia azedarach leaves extracts with anti-SARS-CoV- 2 and antibacterial activities. PLoS One, 18(3): e0282729. https://doi.org/10.1371/journal.pone.0282729[CrossRef]
- Ismail, S., Masi, M., Gaglione, R., Arciello, A. and Cimmino, A., 2024. Antimicrobial and antibiofilm activity of specialized metabolites isolated from Centaurea hyalolepis. PeerJ, 12: e16973.
- Kadhim, I.J., Kareem, F.H. and Segar, S.H., 2021. Effect of eggplant root extracts on the growth of storage fungi of wheat grains and their ability for aflatoxin production in babylon silos in Iraq. Arab J. Plant Prot., 39(1): 29-38. https://doi.org/10.22268/AJPP-39.1.029038[CrossRef]
- Kadhim, I.J., Jasim, A.A. and Hassan, H.A., 2026. Effect of grape seed extract on siderophore production by Klebsiella pneumoniae and histopathological effects of purified siderophore on mice. J. Appl. Biol. Chem., 69(14): 108‒118. https://doi.org/10.3839/jabc.2026.014[CrossRef]
- Maura, D., Ballok, A.E. and Rahme, L.G., 2016. Considerations and caveats in antivirulence drug development. Curr. Opin. Microbiol., 33: 41–46. https://doi.org/10.1016/j.mib.2016.06.001[CrossRef]
- Mayer, C., Soukarieh, F., Simões, M., Flament-Simon, S. Cámara, M. and Romero, M., 2025. AHL-based QS signalling promotes uropathogenic Escherichia coli settlement through the de-repression of biofilm formation by SdiA. PLOS One, 20(9): e0328837. https://doi.org/10.1371/journal.pone.0328837[CrossRef]
- Moradi, F., Hadi, N. and Bazargani, A., 2020. Evaluation of quorum-sensing inhibitory effects of extracts of three traditional medicine plants with known antibacterial properties.New Microbes. New Infect., 38: 100769. https://doi.org/10.1016/j.nmni.2020.100769[CrossRef]
- Mykhailenko, O., Hurina V., Herbina, N, Maslii, Y., Ivanauskas, L., Vladymyrova, I., Lytkin, D., Gudžinskas, Z., Severina, H, and Ruban O., 2025. Phenolic compounds and pharmacological potential of Lavandula angustifolia extracts for the treatment of neurodegenerative diseases. Plants, 14: 289. https://doi.org/10.3390/plants14020289[CrossRef]
- Naqid, I.A., Balatay, A.A, Hussein, N.R., Saeed, K.A. Ahmed, H.A. and Yousif, S.H., 2020. Antibiotic susceptibility pattern of Escherichia coli isolated from various clinical samples in Duhok City, Kurdistan Region of Iraq. Int. J. Infect., 7(3): e103740. https://doi.org/10.5812/iji.103740[CrossRef]
- Naveed, M., Ali, I., Aziz, T., Ali, N., Hassan, A., Rahman, S., Aziz, R. and Alharbi, M., 2024. Assessment of Melia azedarach Plant Extracts Activity Against Hypothetical Protein of Mycobacterium tuberculosis via GC-MS analysis and in silico approaches. J. Comput. Biophys. Chem., 23(3): 299–320. https://doi.org/10.1142/S2737416523500631[CrossRef]
- Nazir, N., Nisar, M., Ahmad, S., Wadood, S.F., Jan, T. and Zahoor, M., 2020. Characterization of phenolic compounds in two novel lines of Pisum sativum L. along with their in vitro antioxidant potential. Environ. Sci. Pollut. Res., 27: 7639–7646. https://doi.org/10.1007/s11356-019-07065-y[CrossRef]
- Nazmeen, A. and Maiti, S., 2018. Prevalence, types and antibiotic sensitivity pattern in urinary tract infection (UTI) in Midnapore Town, India. J. Clin. Mol. Pathol., 2(1:16): 1-8.
- O’May, C. and Tufenkji, N., 2011. The swarming motility of Pseudomonas aeruginosa is blocked by cranberry proanthocyanidins and other tannincontaining materials. Appl. Environ. Microbiol., 77: 3061–3067. https://doi.org/10.1128/AEM.02677-10[CrossRef]
- Rahman, S.U., Ahmad, M., Islam, B., Ullah, A., Rahman, M.U., Khan, Z., Ahmad, H.S. and Ullah, I., 2019. Isolation and identification of Escherichia coli from urine samples and their antibiotic susceptibility pattern. J. Entomol. Zool. Stud., 7(3): 259-264.
- Rafalskiy, V., Pushkar, D. and Yakovlev, S., 2020. Distribution and antibiotic resistance profile of key Gramnegative bacteria that cause community-onset urinary tract infections in the Russian Federation: Resource multicentre surveillance 2017 study. J. Glob. Antimicrob. Resist., (21): 188-194. https://doi.org/10.1016/j.jgar.2019.09.008[CrossRef]
- Ren, D., Sims, J. and Wood, T., 2001. Inhibition of biofilm formation and swarming of Escherichia coli by (5Z)-4-bromo-5-(bromomethylene)-3-butyl-2(5H)-furanone. Environ. Microbiol., 3(11): 731-736. https://doi.org/10.1046/j.1462-2920.2001.00249.x[CrossRef]
- Rütschlin, S. and Böttcher, T., 2019. Inhibitors of bacterial swarming behavior. Chemistry, 26: 964–979. https://doi.org/10.1002/chem.201901961[CrossRef]
- Saeki, E.K., Kobayashi, R.K.T. and Nakazato, G., 2020. Quorum sensing system: Target to control the spread of bacterial infections. Microb. Pathog., 142: 104068. https://doi.org/10.1016/j.micpath.2020.104068[CrossRef]
- Santos, C.A., Lima, E.M.F., Franco, B.D.G.M. and Pinto, U.M., 2021. Exploring phenolic compounds as quorum sensing inhibitors in foodborne bacteria. Front. Microbiol., 12: 735931. https://doi.org/10.3389/fmicb.2021.735931[CrossRef]
- Sheng, L., Olsen, S.A., Hu, J., Yue, W., Means, W.J. and Zhu, M.J., 2016. Inhibitory effects of grape seed extract on growth, quorum sensing, and virulence factors of CDC “top-six” non-O157 Shiga toxin producing E. coli. Int. J. Food Microbiol., 229: 24-32. https://doi.org/10.1016/j.ijfoodmicro.2016.04.001[CrossRef]
- Silva, V., Igrejas, G., Falco, V., Santos, T. P., Torres, C. and Oliveira, A.M.P., 2018. Chemical composition, antioxidante and antimicrobial activity of phenolic compounds extracted from wine industry by-products. Food Contr., 92: 516–522. https://doi.org/10.1016/j.foodcont.2018.05.031[CrossRef]
- Sorrentino, E., Succi, M., Tipaldi, L., Pannella, G., Maiuro, L. and Sturchio, M., 2018. Antimicrobial activity of gallic acid against food-related Pseudomonas strains and its use as biocontrol tool to improve the shelf life of fresh black truffles. Int. J. Food Microbiol., 266: 183–189. https://doi.org/10.1016/j.ijfoodmicro.2017.11.026[CrossRef]
- Soujanya, B.R. and Banashankari, G.S., 2023. Phenotypic Detection of Virulence Factors of Uropathogenic Enterobacteriaceae. J. Pure Appl. Microbiol., 17(2): 931-941. https://doi.org/10.22207/JPAM.17.2.22[CrossRef]
- Tewari, R., Mitra, S.D., Ganaie, F., Venugopal, N., Das, S., Shome, R., Rahman, H., Bibek, R. and Shome, R., 2018. Prevalence of extended spectrum β-lactamase, AmpC β-lactamase and metallo β-lactamase mediated resistance in Escherichia coli from diagnostic and tertiary healthcare centers in south Bangalore, India. Int. J. Res. Med. Sci., 6(4): 1308-1313. https://doi.org/10.18203/2320-6012.ijrms20181288[CrossRef]
- Touzout, S.N., Merghni, A., Laouani, A., Boukhibar, H., Alenazy, R., Alobaid, A., Alenazy, M., Ben-Attia, M., Saguem, K. and El-Bok, S., 2023. Antibacterial properties of methanolic leaf extracts of Melia azedarach L. against gram-positive and gram-negative pathogenic bacteria. Microorganisms, 11(8): 2062. https://doi.org/10.3390/microorganisms11082062[CrossRef]
- Zheng, D., Huang, C., Huang, H., Zhao, Y., Khan, M.R.U. and Zhao, H., 2020. Antibacterial mechanism of curcumin: A review. Chem. Biodivers., 17: e2000171. https://doi.org/10.1002/cbdv.202000171[CrossRef]
Services
Article usage statistics
Loading…