
The number of wild sables has declined dramatically in recent years due to the high value and increasing demand of their fur. In order to evaluate the genetic diversity and population structure for the conservation and management of sables (Martes zibellina), we developed six microsatellite markers using a method of fast isolation by AFLP of sequences containing repeats (FIASCO) from them in this study. The primers designed by Primer Premier 5.0 based on conservative regions were tested on 22 individuals. Our results demonstrated that the number of alleles per locus ranged from two to five and the mean number of alleles was 3.67. The observed and expected heterozygosities ranged from 0.227 to 0.545 and 0.201 to 0.630, respectively. The polymorphic information content value ranged from 0.181 to 0.573. Null allele frequency varied from -0.0548 to 0.0563. The sets of loci proved to correctly discriminate populations using Principal Coordinate analysis. These polymorphic markers will be useful tools for investigating genetic diversity and population structure of this species.
Short Communication · Volume 49, Issue 5, 4 October 2017 · Open Access
Isolation and Characterization of Microsatellite Markers for the Sable, Martes zibellina (Mammalia: Mustelidae)
· · · · ·
Affiliations & Notes ⌄
- 1College of Life Science, Qufu Normal University, Qufu, China 2College of Marine Life Sciences, Ocean University of China, Qingdao, China , Qinguo Wei and Wanchao Zhu contributed equally to this work. , * Corresponding author: zhanghonghai67@126.com
Article Info ⌄
- Journal:
- Pakistan Journal of Zoology
- Published:
- 4 October 2017

From the article
- Thirty primer pairs were designed, of which eight successfully yielded clear bands.
- Futhermore, only six markers yielded polymorphic amplification products in the test for polymorphisms across 22 individuals from two natural populations of M. zibellina.
Selected from the article's own text.
Abstract
Material and methods
Twenty two M. zibellina individuals, including specimens, bodies of natural death and road killing, were collected from two populations in Northeast China. Among them, 12 individuals of M. zibellina princeps were collected in Daxinganling (50°10′- 53°33′ N, 121°12′- 127°00′ E), and other 10 individuals (M. zibellina linkouensis) were collected in Xiaoxinganling (48°52′-49°11′ N, 126°45′-127°25′ E). All the muscle tissues were stored at -80°C. Total genomic DNA was extracted using DNeasy® Blood & Tissue Kit (QIAGEN GmbH) following the manufacturer’s guidelines. All DNAs showed qualified after the detection of 1% agarose gel electrophoresis.
In accordance with the FIASCO protocol , we constructed a partial genomic library and used 5’-biotinylated (AAAC)8 oligonucleptide probe for enrichment selection from it. Isolated DNA was digested by MseI and ligated to double strand AFLP linkers (MseI F: 5’-TACTCAGGACTCAT-3’ and MseI R: 5’-GACGATGAGTCCTGAG-3’). The hybrids strands were captured with Dynabeads® M-280 Streptavidin (Invitrogen) and were amplified to recover the dsDNA. The enriched fragments were ligated into pMD18-T simple cloning vector (TaKaRa) and transferred into Trans1-T1 chemically competent cells (TransGen Biotech). Recombinants were screened by PCR with three primers: vector primers (M13F and M13R) and (AAAC)8 oligonucleotide. Then, the PCR products of clones were examined by 1% agarose gel electrophoresis, and lanes showing multiple bands were considered as positive clones. The positive clones were sequenced by Sangon Biotech (Shanghai) with ABI3730XL Genetic Analyser (Applied Biosystems, Carlsbad, CA, USA).
A total of 196 positive clones were identified from 432 plasmids. Then 100 selected positive clones were sequenced and 79% of them had tandem repeats.
Thirty specific-primers were designed based on conserved regions using the software Primer Premier 5.0 and eight primers were successfully yielded clear bands. PCRs were performed in a 25-µl reaction volume containing 7.5 µl 2×Easy Taq PCR Supermix (TransGen Biotech), 100–200 ng genomic DNA and 2.0 pM of each primer pair (forward primer fluorescently labeled with FAM, HEX). PCR-amplifications were carried out in an Applied Biosystems (ABI) 9700 thermal cycler under the following conditions: a first denaturation at 95°C for 5 min, 35 cycles at 95°C for 30 s, 30 s at the annealing temperature (Table I), and 72°C for 30 s, followed by a last cycle at 72°C for 10 min, and a hold step at 4°C. PCR products were analysed on an ABI 3500 genetic analyser (Applied Biosystems) with a LIZ600 size standard, and the allele sizes were estimated using the software GeneMapper (version 5.0, ABI).
The detection of potential scoring errors (e.g. stutter bands, large allele dropout and null alleles) for the data was analysed using Micro-Checker 2.2.1 . The number of alleles (NA), observed heterozygosities (HO), expected heterozygosities (HE) and Principal Coordinate analysis (PCoA) were estimated using GenAlEx 6.5 . Linkage disequilibrium (LD) between pairs of microsatellite loci and deviations from the Hardy-Weinberg equilibrium (HWE) were calculated by GENEPOP v4.2 . Cervus 3.0 was used to assess the polymorphism information content (PIC) and the frequency of null alleles . Inbreeding coefficients (Fis) were determined by FSTAT v2.9.3.2 .
Table I.- Characterization for six microsatellite loci isolated from Martes zibellina.
| Locus | Primer sequence | Repeat motif | Ta (ºC) | Allele size (bp) | NA | HO | PHW | PIC | F (null) | Acce ssion no. |
| Mzf49 | F: CACCTTATTG CCATTCAG | (TGAA)7 | 52 | 163-171 | 3 | 0.36 | 0.380 | 0.34 | 0.05 | KX71 2105 |
| R: AAAGTGG GTATCATTGTC | ||||||||||
| Mzf51 | F: TTGTGGGTG CTTGGTAGTA | (GTTT)8 | 54 | 149-161 | 5 | 0.50 | 0.519 | 0.45 | 0.02 | KX71 2106 |
| R: CCTCATTTGG GTTGGTAG | ||||||||||
| Mzf56 | F: ATTGTGAGGG TAGGTTCG | (CCAT)8 | 54 | 292-296 | 2 | 0.50 | 0.816 | 0.34 | -0.05 | KX71 2107 |
| R: ATTTATGGGCT TGCTGTC | ||||||||||
| Mzf57 | F: AAACTCACTTT GCTGTAT | (TTGT)7 | 50 | 243-275 | 5 | 0.54 | 0.595 | 0.47 | -0.04 | KX7 12108 |
| R: GAATGAAATC GCTTAGGT | ||||||||||
| Mzf58 | F: GAATAGCCAA AGGAATGT | (AAAC)7 | 52 | 172-192 | 2 | 0.22 | 1.000 | 0.18 | -0.05 | KX7 12109 |
| R: GTCCATAAACT TGAGGGT | ||||||||||
| Mzf61 | F: TGTAGCCCCAT AGGTTTG | (TTTG)7 | 52 | 172-188 | 5 | 0.54 | 0.069 | 0.57 | 0.06 | KX71 2110 |
| R: TGCTTTGAATC GCATCTT |
Ta, annealing temperature; NA, number of alleles; HE, expected heterozygosity; HO, observed heterozygosity; PIC, polymorphic information content value; F, null allele frequency.
Table II.- Genetic diversity over all loci for the two populations of Martes zibellina.
| Locus | Daxinganling (N=12) | Xiaoxinganling (N=10) | ||||||||
| NA | NE | HO | HE | Fis | NA | NE | HO | HE | Fis | |
| Mzf49 | 3 | 1.291 | 0.250 | 0.226 | -0.065 | 2 | 1.980 | 0.500 | 0.495 | 0.043 |
| Mzf51 | 5 | 1.895 | 0.500 | 0.472 | -0.015 | 3 | 2.062 | 0.500 | 0.515 | 0.082 |
| Mzf56 | 2 | 1.800 | 0.500 | 0.444 | -0.082 | 2 | 1.835 | 0.500 | 0.455 | -0.047 |
| Mzf57 | 4 | 2.165 | 0.667 | 0.538 | -0.197 | 4 | 1.905 | 0.400 | 0.475 | 0.209 |
| Mzf58 | 2 | 1.180 | 0.167 | 0.153 | -0.048 | 2 | 1.342 | 0.300 | 0.255 | -0.125 |
| Mzf61 | 5 | 2.824 | 0.500 | 0.646 | 0.267 | 3 | 2.469 | 0.600 | 0.595 | 0.044 |
N, number of individuals tested; NA, number of alleles; NE, number of effective alleles; HE, expected heterozygosity; HO, observed heterozygosity; Fis, inbreeding coefficient.
Results and discussion
Although a high proportion of sequences contained repeats, the majority of them was unusable for primer design for several reasons such as the higher or lower annealing temperature . Thirty primer pairs were designed, of which eight successfully yielded clear bands. Futhermore, only six markers yielded polymorphic amplification products in the test for polymorphisms across 22 individuals from two natural populations of M. zibellina. DNA sequences of the six microsatellites were deposited into Genbank (accessions KX712105- KX712110).
NA per locus varied from two to five, with an average of 3.67 (Table I), which showed a lower level than previous study . At the species level, HO and HE ranged from 0.227 to 0.545 and from 0.201 to 0.630, with an average of 0.447 and 0.453, respectively (Table I).
None of these loci were found to deviate from the HWE (Table I), and significant LD was detected between the locus Mzf49 and Mzf56 after Bonferroni correction (p<0.05), which indicated significant allelic association between the two markers. The PIC value ranged from 0.181 to 0.573. Locus Mzf58 showed low polymorphism (PIC<0.25) and Mzf61 showed high polymorphism (PIC>0.5), while the rest were moderately polymorphic (0.25<PIC<0.5). The frequency of null alleles varied from -0.0548 to 0.0563 and none of these loci showed evidence of null alleles. None of the loci showed evidence for large allele dropout or stutter bands. Genetic diversity parameters in each population are presented in Table II. Numbers of effective alleles (NE) were all less than 3, and ranged from 1.180 to 2.824 in the two populations. The locus Mzf61 showed the highest inbreeding coefficient (Fis=0.267) in Daxinganling population. Furthermore, using the 6 microsatellites, PCoA permitted the discrimination of the populations of Daxinganling and Xiaoxinganling, although any overlap was observed. It suggested that the sets of loci proved to correctly discriminate populations (Fig. 1).
In conclusion, microsatellite DNA is an effective molecular marker for studying the genetic diversity of sables. The FIASCO protocol is fast and simple, and its utility is better than traditional enrichment methods. The six microsatellite markers show polymorphism in the two populations, which is helpful for the research and conservation of M. zibellina in the future.
Acknowledgments
This work was supported by the Special Fund for Forest Scientific Research in the Public Welfare (201404420), the National Natural Science Fund of China (31672313, 31372220), Science and technology research plan of Shandong Province (2013GSF11707).
Statement of conflict of interest
Authors have declared no conflict of interest.
Figures
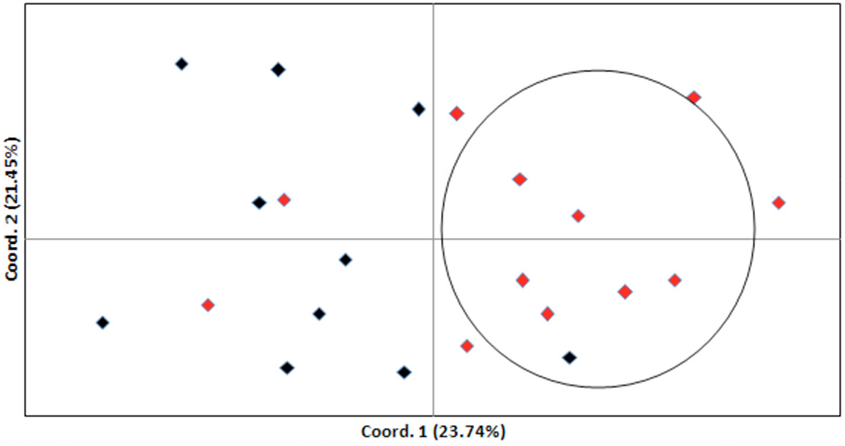
Principal coordinates analysis (PCoA) for the two regional populations of sable based on the six microsatellite loci (Red, Daxinganling; Black, Xiaoxinganling).
References
- Ferris, S.D., Sage, R.D., Huang, C.M., Nielsen, J.T., Ritte, U. and Wilson, A.C., 1983. Proc. natl. Acad. Sci. U.S.A., 80: 2290-2294. https://doi.org/10.1073/pnas.80.8.2290[CrossRef]
- Geptner, V.G., 1967. Sable, in Mlekopitayushchie Sovetskogo Soyuza: Khishchnye (Mammals of the Soviet Union: Carnivores), Vol. 2, Nauka, Moscow, pp. 507–533.
- Goldstein, D. and Schlöterer, C., 1999. Microsatellites: evolution and applications. Oxford University Press, Oxford.
- Goudet, J., 1995. J. Hered., 86: 485-486. https://doi.org/10.1093/oxfordjournals.jhered.a111627[CrossRef]
- Hosoda, T., Suzuki, H., Iwata, M.A., Hayashida, M., Watanabe, S., Tatara, M. and Tsuchiya, K., 1999. Mammal Study, 24: 25–33. https://doi.org/10.3106/mammalstudy.24.25[CrossRef]
- Inoue, T., Murakami, T., Abramov, A.V. and Masuda, R., 2010. Mammal Study, 35: 145-155. https://doi.org/10.3106/041.035.0301[CrossRef]
- Kashtanov, S.N., Afanasiev, K.I., Potapov, S.G. and Lazebny, O.E., 2011. Genetika, 47: 1622-1628.
- Kurose, N., Masuda, R., Siriaroonrat, B. and Yoshida, M.C., 1999. Zool. Sci., 16: 693-700. https://doi.org/10.2108/zsj.16.693[CrossRef]
- Kalinowski, S.T., Taper, M.L. and Marshall, T.C., 2007. Mol. Ecol., 16: 1099-1106. https://doi.org/10.1111/j.1365-294X.2007.03089.x[CrossRef]
- Lalitha, S., 2000. Biotech. Softw. Int. Rep., 1: 270. https://doi.org/10.1089/152791600459894[CrossRef]
- Murakami, T., Asano, M. and Ohtaishi, N., 2004. Japan. J. Vet. Res., 51: 135-142.
- Niu, Y., Li, M., Wei, F. and Feng Z., 2001. Hereditas, 23: 593-598.
- Peakall, R. and Smouse, P.E., 2012. Bioinformatics, 28: 2537-2539. https://doi.org/10.1093/bioinformatics/bts460[CrossRef]
- Reed, D.H. and Frankham, R., 2003. Conserv. Biol., 17: 230-237. https://doi.org/10.1046/j.1523-1739.2003.01236.x[CrossRef]
- Rousset, F., 2008. Mol. Ecol. Resour., 8: 103-106. https://doi.org/10.1111/j.1471-8286.2007.01931.x[CrossRef]
- Vandevliet, M.S., Diekann, O.E., Serrsao, E.T.A. and Beja, P., 2009. Mol. Ecol. Resour., 9: 425-428. https://doi.org/10.1111/j.1755-0998.2008.02436.x[CrossRef]
- van Oosterhout, C., Hutchinson, W.F., Wills, DM. and Shipley, P., 2004. Mol. Ecol. Notes, 4: 535-538. https://doi.org/10.1111/j.1471-8286.2004.00684.x[CrossRef]
- Zullo, S., Sieu, L.C., Slightom, J.L., Hadler, H.I. and Eisenstadt, J.M., 1991. J. mol. Biol., 221: 1223-1235. https://doi.org/10.1016/0022-2836(91)80123-C[CrossRef]
- Zane, L., Bargelloni, L. and Patarnello, T., 2002. Mol. Ecol., 11: 1-16. https://doi.org/10.1046/j.0962-1083.2001.01418.x[CrossRef]
- Zhi, Y.B., Ding, L., Wang, Y., Hu, L., Hua, Y., Zhao, K., He, J., Yang, C. and Zhang, B., 2014. Conserv. Genet. Resour., 6: 297-299. https://doi.org/10.1007/s12686-013-0135-y[CrossRef]
Services
Article usage statistics
Loading…