
The poverty of farmers is a major challenge to agricultural development in developing regions, including Gorontalo Province, Indonesia. Therefore, this study aims to analyze the capacity index of corn farmers at the provincial, Gorontalo Regency, and Boalemo Regency levels, as well as map the dynamics of the determinants using Interpretive Structural Modeling (ISM). The ISM approach was selected to provide a comprehensive picture of poor farmers capacity and the direction of needed policies. A household survey of poor corn farmers was conducted, supplemented by in-depth interviews, expert group discussions, and secondary data analysis. The capacity index was calculated with two weighting schemes, while the relationships between capacity elements were analyzed using ISM to identify drivers, connectors, and output factors. The results showed that farmers capacity at the provincial and Boalemo Regency levels was in the low category. Meanwhile, the capacity observed in Gorontalo Regency was relatively better, categorized as moderate. The main weaknesses were limited physical resources and low farmers knowledge and skills. The structural analysis confirms that technology, innovation, and market access can only develop when the foundations of infrastructure, education, institutions, and climate vulnerability are strengthened. All the obtained results emphasize the importance of agricultural development policies oriented towards increasing basic capacity before encouraging technological modernization and market integration. This research will help to shape agricultural policies, particularly those aimed at improving the capacity of impoverished farmers.
Research Article · Volume 39, Issue 3, 6 September 2026 · Open Access
Integration of Poor Corn Farmers’ Capacity Index with Interpretive Structural Modeling (ISM) to Map Agricultural Development Dynamics in Gorontalo Province, Indonesia
· · · ·
Affiliations & Notes ⌄
- 1Gorontalo State University, Faculty of Agriculture, Department of Agribussiness, Gorontalo, Jln. Prof. Ing. B.J. Habibie, Moutong, Kec. Tilongkabila, Kabupaten Bone Bolango, Gorontalo 96119
- 2University of Gorontalo, Faculty of Agriculture, Jln. Jend. Sudirman, Limboto, Kabupaten Gorontalo, Gorontalo
- 3Gorontalo State University, Faculty of Agriculture, Department of animal husbandry, Gorontalo, Jln. Prof. Ing. B.J. Habibie, Moutong, Kec. Tilongkabila, Kabupaten Bone Bolango, Gorontalo 96119
- 4Gorontalo State University, Faculty of Economic, Jln. Jend. Sudirman, Kota Gorontalo, Gorontalo 96128. *Correspondence | Irwan Bempah, Gorontalo State University, Faculty of Agriculture, Department of Agribussiness, Gorontalo, Jln. Prof. Ing. B.J. Habibie, Moutong, Kec. Tilongkabila, Kabupaten Bone Bolango, Gorontalo 96119
- 5Email: irwanbempah@ung.ac.id
Article Info ⌄
- Journal:
- Pakistan Journal of Agricultural Research
- Published:
- 6 September 2026
From the article
- In conclusion, this study confirms significant disparities in the FCI in Gorontalo Province, Gorontalo Regency, and Boalemo Regency.
- The results show that the capacity of poor corn farmers at the provincial and Boalemo Regency levels remains low, while Gorontalo Regency is in the moderate category.
- The main weaknesses lie in limited physical resources and low farmers knowledge and skills, which are essential foundations for capacity building.
- ISM analysis provides a systemic overview of the interrelationships between farmers capacity elements.
Selected from the article's own text.
Abstract
Introduction
Poverty is a relevant global challenge in various developing countries, including Indonesia. This challenge is closely related to the achievement of the Sustainable Development Goals (SDGs), Particularly the goal of eliminating extreme poverty in rural areas . International literature confirms that poverty is multidimensional, determined not only by income but also by access to education, health, social capital, and economic opportunities . The experience of China shows that economic reforms reduce extreme poverty but invent new challenges in the form of income inequality . This suggests that poverty alleviation strategies need to consider the structural and cultural contexts to be effective.
As an agricultural country, Indonesia faces a similar dilemma. The agricultural sector, being the backbone of most rural households, continuously contributes to the highest poverty levels. Mukhlis et al. (2021); Setiyowati et al. (2018) found that while the agricultural sector has a significant contribution to Gross Regional Domestic Product (GRDP), the impact on poverty reduction is relatively weak.
Gorontalo Province is a prime example of the described phenomenon. According to the Indonesia Statistics Agency (BPS) data (2025), Gorontalo is among the ten poorest provinces in Indonesia, with the poverty rate decreasing from around 15.22% in 2020 to 13.87% in 2024. This condition reflects the poverty described by , where low productivity leads to insufficient incomes hindering access to education, health care. Corn farmers remain the most vulnerable group despite cultivating the leading commodity of the province.
The efforts of central and regional governments tend to focus on short-term programs such as direct cash assistance, fertilizer subsidies, or grants for production inputs . While these measures help maintain consumption by poor households, the impact on strengthening long-term capacity is relatively limited. Dependence on aid can generate moral hazards and reduce program sustainability . Therefore, a new approach that focuses on farmers capacity building is essential to achieving sustainability in the agricultural sector.
Subsidies may provide a short-term solution, but without sustainable capacity development, farmers will remain trapped in a cycle of dependency. Through investments in training, access to technology, institutional strengthening, and the establishment of efficient market channels, the agricultural sector can increase productivity and contribute to long-term poverty alleviation. This shows the central and regional governments need to design more holistic policies that promote the resilience and independence of farmers in Indonesia ; .
The results obtained emphasize that capacity building is a key strategy for escaping the poverty trap. This concept includes skills development, access to information, institutional strengthening, and the development of socio-economic networks. Cross-contextual studies show the effectiveness of social capital and zakat, infaq, and alms instruments as redistribution mechanisms to support poor households. However, the solutions require an integrative model that bridges the technical, financial, social, and institutional dimensions ; .
This study aims to develop a framework for mapping the integration of the capacity of poor corn farmers. While previous studies have limited farmer capacity measurements to climate change resilience, livelihoods, and farm management ; ; , The novelty lies in identifying the constraints encountered by farmers through the Farmer Capacity Index (FCI) analysis, subsequently developing policy solutions through Interpretative Structural Modeling (ISM) analysis, and comparing the capacities of two districts in Gorontalo Province. This approach is expected to produce a comprehensive analytical framework for the support of evidence-based policies to strengthen the resilience of poor farmers in developing regions.
Materials and Methods
Study design
A mixed-methods approach was used in this study, predominantly exploratory qualitative analysis combined with quantitative analysis. The approach was selected to capture the complexity of poverty among corn farmers in Gorontalo, influenced by economic, social, and institutional factors. Quantitative data were used to measure the FCI and the relationships between variables, while qualitative data explored farmers meanings, perceptions, and adaptation strategies.
Location and respondents
This study was conducted in two regencies with
Table 1: Gorontalo province farmer capacity index (2025)
|
Indicator |
FAO percentage |
Score (0-100) |
Contribution FCI |
Kementan percentage |
Score (0-100) |
Contribution FCI |
|
Technology and innovation |
25% |
46 |
11.42 |
30% |
46 |
13.71 |
|
Knowledge & skills |
30% |
27 |
8.23 |
25% |
27 |
6.86 |
|
Institutions & policies |
15% |
48 |
7.15 |
20% |
48 |
9.53 |
|
Market Access & finance |
20% |
44 |
8.82 |
15% |
44 |
6.61 |
|
Physical resources |
10% |
30 |
2.98 |
10% |
30 |
2.98 |
|
Total FCI |
38.59 |
39.69 |
Description: Low – requires urgent intervention (FAO, 2018; Ministry of Agriculture, 2019).
the highest poverty rates, namely Gorontalo and Boalemo. The respondents were 200 poor corn farming households chosen through purposive selection. This figure was calculated using the Slovin formula, taking into account the enormous population size.
These also included farmers groups, the agricultural office, academics, NGOs, as well as actors in the seed and distribution industry.
Study stages
The study process was conducted in five different stages. These included (i) literature review and stakeholder mapping; (ii) primary data collection through surveys, in-depth interviews, FGDs, and participant observation; (iii) secondary data collection from BPS, RPJMD, agency reports, and CSR documents; (iv) model development and analysis using ISM and FCI calculations; as well as (v) participatory model trials in target villages with pre- and post-intervention evaluations.
Data analysis
Quantitative data were analyzed using descriptive to assess the relationship between farmers capacity and poverty levels. The outcomes were subsequently compared to the Farmer Capacity Index assessment standard (FAO, 2018; . ISM analysis was used to map the hierarchy of factor interrelationships, resulting in interaction matrices and graphs that highlight drivers, links, and dependent variables ; .
Results and Discussion
FCI at the gorontalo province level
The results show that farmers capacity in Gorontalo Province remains low, both according to the FAO weighting approach and the Indonesian Ministry of Agriculture. Total FCI calculated using FAO and the Ministry of Agriculture weighting was 38.59 and 39.69, respectively (Table 1). Both values consistently reflect conditions far from ideal, requiring urgent intervention in various aspects that support agricultural development at the provincial level.
Based on the indicators, technology and innovation scored 46,00 contributing 11.42% to the FAO’s weighting of FCI and 13.71% to the Ministry of Agriculture’s weighting. The relatively significant contribution does not show adequate technological mastery, particularly in the context of modern agriculture, which is increasingly based on digital innovation and mechanization. Knowledge and skills were recorded as very low with a score of 27, contributing only 6.86–8.23% of the total FCI. This situation confirms that farmers agricultural literacy, understanding of sustainable cultivation approach, and managerial skills are limited.
In terms of institutions and policies, the score achieved was 48 with a contribution of 7.15–9.53%, suggesting that institutional roles are quite visible but not optimal in supporting farmers independence. Market and financial access scored 44 with a contribution of around 6.61–8.82%, signifying the persistence of structural barriers in the agribusiness value chain. Physical resources, such as land availability, irrigation facilities, and agricultural infrastructure, had the lowest score at 30, with a contribution of 2.98%. This limitation corresponds with the report of FAO (2018), which emphasizes physical resources and infrastructure as important determinants in strengthening farmers capacity.
The current results show the main weaknesses of Gorontalo Province lie in knowledge and skills, as
Table 2: Gorontalo regency farmer capacity index (2025)
|
Indicator |
FAO percentage |
Score (0-100) |
Contribution FCI |
Kementan percentage |
Score (0-100) |
Contribution FCI |
|
Technology and innovation |
25% |
49 |
12.22 |
30% |
49 |
14.67 |
|
Knowledge & skills |
30% |
30 |
8.85 |
25% |
30 |
7.38 |
|
Institutions & policies |
15% |
49 |
7.42 |
20% |
49 |
9.89 |
|
Market access & finance |
20% |
45 |
9.09 |
15% |
45 |
6.82 |
|
Physical resources |
10% |
32 |
3.18 |
10% |
32 |
3.18 |
|
Total FCI |
40.76 |
41.93 |
Description: Moderate – needs improvement in technology and market access (FAO, 2018; Ministry of Agriculture, 2019).
Table 3: Boalemo regency farmer capacity index (2025)
|
Indikator |
FAO percentage |
Score (0-100) |
Kontribution FCI |
Kementan percentage |
Score (0-100) |
Kontribution FCI |
|
Technology and innovation |
25% |
42 |
10.62 |
30% |
42 |
12.75 |
|
Knowledge & skills |
30% |
25 |
7.61 |
25% |
25 |
6.34 |
|
Institutions & policies |
15% |
46 |
6.88 |
20% |
46 |
9.17 |
|
Market access & finance |
20% |
43 |
8.54 |
15% |
43 |
6.41 |
|
Physical resources |
10% |
28 |
2.78 |
10% |
28 |
2.78 |
|
Total FCI |
36.42 |
37.44 |
Description: Low – requires urgent intervention (FAO, 2018; Ministry of Agriculture, 2019).
well as limited physical resources, which are two interrelated aspects because low human capacity to manage physical resources leads to stagnant agricultural productivity. This is consistent with the Kementerian Pertanian (2019) guidelines for developing FCI, which prioritizes human resource capacity building and basic infrastructure support in Indonesia’s farmers capacity building strategy.
FCI at the gorontalo regency level
Table 2 shows that the FCI in Gorontalo Regency performed relatively better than the provincial average. The total index score based on the FAO and the Ministry of Agriculture weighting was 40.76 and 41.93, respectively. This category is classified as moderate, representing a stronger foundation for farmers capacity development, although structural weaknesses remain that need to be addressed.
Concerning the technology and innovation indicator, farmers in Gorontalo Regency scored 49 with a contribution of 12.22–14.67%. This shows a higher level of innovation adoption than the provincial average. Knowledge and skills increased by 30, but the contribution remains low (7.38–8.85%). Institutions and policies scored 49, with a contribution of around 7.42–9.89%, representing a relatively strong institutional role in supporting agricultural activities.
Market and financial access scored 45, contributing 6.82–9.09%, signifying persistent constraints on access to capital and formal markets. Physical resources remain a weak point with a score of 32 and a contribution of 3.18%, representing limited production support facilities. This result corresponds with the report of previous analysis ; that improving access to technology and markets will have a multiplier effect on increasing farmers capacity in developing regions. The results show that although Gorontalo Regency has a better capacity, the sustainability of increasing farmers capacity requires a focus on strengthening modern agricultural technology, digitalizing marketing, and implementing policy interventions to facilitate access to capital for farming businesses.
FCI at the boalemo regency level
Table 3 shows that Boalemo Regency has the lowest FCI score compared to the other two levels. The total index score obtained from the FAO weighting was 36.42, and the Ministry of Agriculture’s weighting produced a score of 37.44. Both fell into the low category, representing the weak capacity of farmers in Boalemo. Furthermore, technology and innovation scored 42, contributing 10.62–12.75%. Knowledge and skills were the weakest indicator, scoring 25 and contributing 6.34–7.61%. This situation shows a serious gap in agricultural literacy. Meanwhile, institutions and policies were relatively better, scoring 46, contributing 6.88–9.17%.
Market and financial access scored 43, contributing 6.41–8.54%, which represents limited access to formal markets and financial institutions among farmers. Physical resources scored the lowest, at 28, contributing 2.78% and reflecting the lack of basic agricultural infrastructure. This situation shows the urgent need for interventions to improve farmers skills and provide basic agricultural infrastructure. The described situation is consistent with the view of the Kemeterian Pertanian (2019), which emphasizes the importance of human resource capacity and infrastructure in increasing the competitiveness of farmers in underdeveloped regions.
Dynamics of ISM structure in the context of farmers capacity
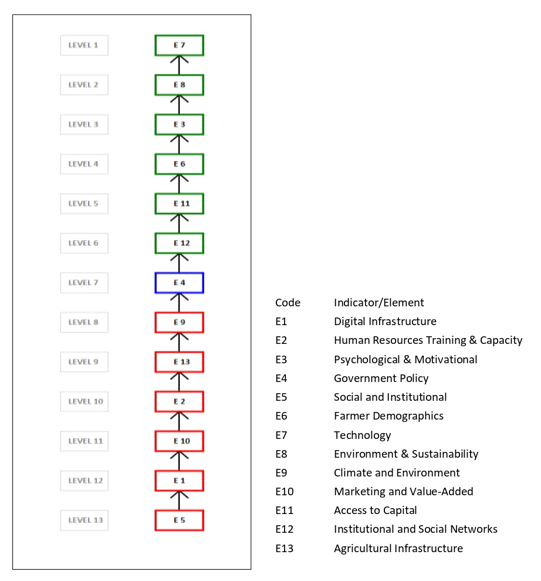
The ISM structure in Figure 1 (the model) and Figure 2 (the graph) shows a complex hierarchy among the factors that determine the capacity of poor corn farmers in Gorontalo Province. The structure has three main layers, including driver factors as the foundation, linkages as critical connections, and dependent factors as outputs influenced by the layers below. This hierarchical framework corresponds with the view of previous studies ; that complex socio-economic systems should be mapped through the interconnections between elements to understand the underlying causal flows.
At the driver level, there are six indicators that serve as the main drivers of system dynamics. First, pest and disease attacks, as well as the impact of climate change (E5), are fundamental components of corn cultivation vulnerability. Literature shows that climate change risks and the intensity of attacks by plant pests are fundamental factors suppressing the adaptive capacity of farmers in developing countries (Saad et al., 2024); Sarvina, (2019) Second, access to financial institutions and the availability of agricultural credit (E1) are key determinants of corn farmers resilience. Capital availability can impact the sustainability of farming. Third, the cost of technology adoption and farmers skills (E2) are also drivers. The high cost of adopting modern technology often limits smallholder farmers participation, specifically when technical literacy is low. Fourth, fear of crop failure and hesitation in adopting technology (E10) are psychosocial aspects that influence farmers behavior. A previous study confirms that yield uncertainty and low trust in innovation are latent barriers to the diffusion of agricultural technology. Fifth, formal education and farmers age (E13) are key drivers determining human resource quality. Previous analysis shows that education level and age demographic structure significantly correlate with the rate of innovation adoption and farmers managerial skills (FAO, 2018). Sixth, digital marketing networks and the increasing role of farmers cooperatives (E9) play a strategic role as drivers. The entire six indicators confirm that improvements in the foundations related to climate risk, technology costs, literacy, education, and institutional networks will enable the dynamics of agricultural systems to develop sustainably when implemented coherently.
At the linkage level, the availability of storage warehouses and village farm roads (E4) is a vital connecting element. This limited physical infrastructure is often referred to as the “missing link” in rural development because of the direct impacts on corn price stability, distribution efficiency, and harvest storage capacity . Without adequate storage, farmers tend to sell crops immediately after harvest at low prices, maintaining weak bargaining power. Therefore, this connection is key in determining the extent to which drivers can cascade effects to the dependent level. At the dependent level, there are six indicators structurally influenced by drivers and linkages. Organic farming practices and corn waste utilization (E12) show the direction of the transformation toward sustainable agriculture.
Adoption is only possible when farmers have adequate skills and infrastructure support . The use of digital agricultural applications (E11) is also a dependent factor, whose effectiveness is strongly influenced by technological literacy and market access. Without a foundation of knowledge and infrastructure, digital applications serve as symbolic instruments.
The floor price for corn and post-harvest programs (E6) are government policies often influenced by market conditions and institutional support .). The programs will be effective when farmers have the capacity to produce standardized quality (e.g., the moisture content of corn). The intensity of extension programs from the agricultural office (E3) is considered a dependent factor, as the success depends significantly on the readiness of farmers to accept new knowledge . Similarly, supply chain efficiency and improved corn selling prices (E8) are impossible to achieve without the support of storage warehouses, farm roads, and the role of cooperatives as linkages. Finally, partnerships with village-owned enterprises (BUMDES) as corn offtakers (E7) are at the top of the hierarchical structure. This partnership represents an advanced form of market integration but relies heavily on strengthening the foundational and connecting elements.
Synergy between FCI indicators and the impact on policy
The analysis of the FCI at three regional levels—Gorontalo Province, Gorontalo Regency, and Boalemo Regency—shows a pattern of disparity that needs to be understood through the perspective of synergy between indicators. The ISM hierarchical structure, as shown in Figure 1 and Figure 2, emphasizes that each capacity index indicator does not stand separately but interacts in an integrated system. Therefore, the interpretation of index results should be conducted systematically, not piecemeal.
At the provincial level, the FCI score is in the low category (38–39). The main weaknesses lie in physical resources and farmers knowledge and skills, reflecting weak basic capacity. This prevents the relatively better institutional and policy roles from functioning optimally. Abdullah et al. (2021) emphasize that poor rural infrastructure, such as farm roads and irrigation, limits access to inputs and slows the diffusion of innovation. Although technology and institutional indicators score higher, limitations at the driver level hinder the realization of this potential.
In Gorontalo Regency, conditions are more positive, with an index score in the moderate category (40–42). Technology and institutions are relatively strong, representing a more prepared basis for increasing capacity building. However, the knowledge and skills of farmers remain low, generating barriers to linkage functions. Godart et al. (2016) in Trust-Based Work Time and Innovation emphasize that innovation adoption is influenced by the availability of technology and the capacity of an individual to understand, adapt, and disseminate the innovation. Therefore, low farmers literacy and skills reduce the potential for technology to have a real impact.
Boalemo Regency showed the lowest FCI score of 36–37. Knowledge, skills, and physical resources indicators are weak, leading to a fragile system. Relatively advanced technology and market access have become powerless dependents due to the lack of supporting foundations. The result is consistent with the analysis of Andrianto and Iskandar (2019), asserting that capacity imbalances in marginalized regions can exacerbate food insecurity and deepen economic disparities. In the Boalemo context, this implies that intervention strategies should primarily focus on strengthening drivers and linkages, rather than technology or markets.
The synergy between FCI indicators shows that the success of farmers capacity building is highly dependent on consistency across hierarchical levels. As explained by the FAO (2018), farmers capacity building requires a holistic capacity development approach, where improving human resources, institutions, and infrastructure is a prerequisite for sustainable innovation and market access. In other words, indicators at the driver and linkage levels act as enablers, while dependent indicators represent outcomes that can only be realized after the foundation is strengthened.
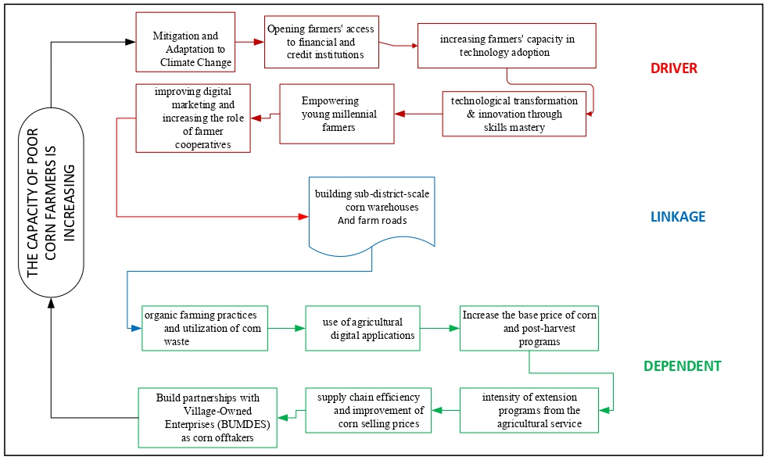
Figure 3 shows the policy model implications of the results, namely the importance of prioritizing stages that correspond to the ISM structure. At the provincial level, policies should prioritize the development of basic infrastructure and agricultural literacy. In Gorontalo Regency, strategies can be directed at optimizing new technologies with the support of training programs and institutional strengthening. Meanwhile, in Boalemo Regency, policies should be more radical, with a simultaneous focus on providing physical infrastructure and strengthening human resource capacity. This principle is consistent with the polycentric governance framework proposed by Ostrom (2010), where interventions should be tailored to the specific context of each region but remain in a broader coordination framework.
Multilevel integration: Provincial, District, and National
Policy strategies should be developed in a tiered and adaptive manner, consistent with the specific capabilities of each region. At the provincial level, institutional development should be strengthened—including coordination between districts. Gorontalo Regency could become a sustainable pilot project, with a hybrid intervention in the form of improving rural infrastructure while simultaneously providing intensive training. Boalemo Regency requires a more inclusive approach, through an intensive transformational program, simultaneously providing capital support, physical development, and capacity building.
The approach examines the adaptive and multilevel policy principles suggested by Ostrom (2010), stating that managing complex systems requires “polycentric governance” reforms—complementary interventions from the ground up to the implementation stage. In this context, the interaction between the ISM and FCI structures provides a specific roadmap. Drivers and linkages should be gradually strengthened, thereby allowing dependent outcomes to grow sustainably.
The discussion section provides a cohesive theoretical and policy framework for enhancing farmers capacity in Gorontalo based on systemic (ISM) and empirical (FCI) analysis. This is consistent with global approaches to strengthening the agricultural sector in developing regions.
Conclusions and Recommendations
In conclusion, this study confirms significant disparities in the FCI in Gorontalo Province, Gorontalo Regency, and Boalemo Regency. The results show that the capacity of poor corn farmers at the provincial and Boalemo Regency levels remains low, while Gorontalo Regency is in the moderate category. This difference reflects the unequal distribution of resources and knowledge, which directly impacts the ability of farmers to adapt and sustain farming operations. The main weaknesses lie in limited physical resources and low farmers knowledge and skills, which are essential foundations for capacity building.
ISM analysis provides a systemic overview of the interrelationships between farmers capacity elements. Driver factors include education, financial access, technology costs, climate vulnerability, and the role of cooperatives and digital networks. These serve as the foundation for driving change. Linkage factors, such as village farm roads, storage facilities, and farmers institutions, serve as critical connections that determine the effectiveness of driver influence. Meanwhile, dependent factors, such as technology adoption, digital applications, organic farming practices, extension intensity, market access, and partnerships with Village-Owned Enterprises (Bumdes), are output factors that can only develop when the foundation and connections are strengthened.
This study contributes to the literature by integrating capacity index analysis and ISM, providing a systemic framework for evidence-based agricultural policy in developing regions. The policy implications for Gorontalo are that growth in agriculture must begin with improving basic infrastructure, supplying production inputs, and expanding human resource capacity through education and training.
Further studies are recommended to explore the long-term impacts of specific policy interventions, as well as the relationship between farmers capacity, food security, and regional economic transformation.
Acknowledgments
This research was supported by Ministry of Higher Education, Research, and Technology of Indonesia through the Penelitian Fundamental Reguler (PRF) 2025 as outlined in the Decree of the Rector of Universitas Negeri Gorontalo No: 082/C3/DT.05.00/PL/2025, under Contract No: 744/UN47.D1/PT.01.03/2025
Novelty Statement
The novelty of this study lies in mapping the capacity of poor corn farmers through the integration of FCI Analysis and ISM. The approach has not been widely used in local contexts, particularly when comparing two regencies in a single province, thereby producing a systemic and comprehensive picture for evidence-based policy recommendations.
Author’s Contribution
Irwan Bempah: Responsible for study conceptualization, theoretical framework formulation, and overall supervision of the article writing process.
Bachtiar: Directed the methodological design, instrument validation, and quantitative analysis of the Farmer Capacity Index.
Fahrudin Zain Olilingo: Led field data collection, survey implementation, and primary and secondary data integration.
Fahrul Ilham: Conducted qualitative analysis, processed Interpretive Structural Modeling (ISM) results, and interpreted the findings.
Sahmin Noholo: Drafted the discussion section and policy recommendations, as well as aligned the manuscript with international academic standards.
Generative AI and AI-assisted technology statement
The authors declare that no generative AI and AI assisted technology was used in the creation of this manuscript.
Conflict of interest
The authors have declared no conflict of interest
Figures
Sub elements enabling the development of farmer capacity in a hierarchical framework
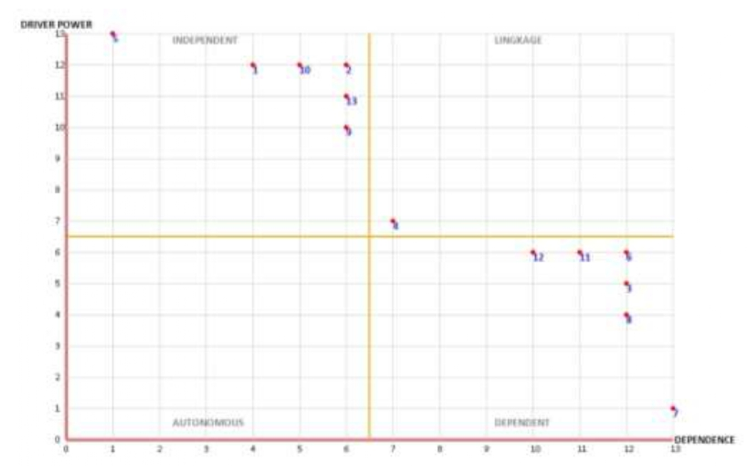
Diagram of classification for auxiliary component for the development of farmer capacity
Model of policy stages to enhance capacity of law-imcone corn farmers in gorontalo
References
- Abdullah, M.R.T.L., S. Siraj, and Z. Ghazali. 2021. An ISM Approach for Managing Critical Stakeholder Issues Regarding Carbon Capture and Storage (CCS) Deployment in Developing Asian Countries. Sustaina., 13(12): 6618. https://doi.org/10.3390/su13126618[CrossRef]
- Andrianto, I. and D.A. Iskandar. 2019. Program Pembangunan Dalam Konvergensi/Divergensi Wilayah. J. Litbang Sukowati Media Penelitian Dan Pengembangan., 4(1): 13. https://doi.org/10.32630/sukowati.v4i1.101[CrossRef]
- Ascarya, A., M.N. Hosen, and S. Rahmawati. 2022. Designing Simple Productive Waqf Models for Indonesia. Int. J. Eth. Syst., 38(3): 380–401. https://doi.org/10.1108/ijoes-07-2020-0101[CrossRef]
- Adelesi, O.O., Y.U. Kim, J. Schuler, P. Zander, M.M. Njoroge, L. Waithaka, A.L. Abdulai, D.S. MacCarthy, H. Webber. 2024. The potential for index-based crop insurance to stabilize smallholder farmers’ gross margins in Northern Ghana. Food Poli., [Volume]([Issue]), [Start page]-[End page]. https://doi.org/10.1016/j.agsy.2024.104130[CrossRef]
- Albore, A., G. Tesfay, A. Zenebe, N. Abadi. 2025. Livelihood resilience capacity and its determinants of lowland agro-pastoral communities in Ethiopia. Sustain. Futur., [Volume]([Issue]), [Start page]-[End page]. https://doi.org/10.1016/j.1016/j.2666188825009311[CrossRef]
- Amelia, D., D. Dayat, N. Widyastuti. 2020. Kapasitas Petani Pada Usahatani Jagung (Zea mays) Di Kecamatan Sukadana Kabupaten Ciamis. J. Ilmiah Pertan. (JIP), 1([Issue]), [Start page]-[End page]. https://doi.org/https://doi.org/10.47492/jip.v1i3.66[CrossRef]
- Berita Gorontalo. 2023. Program Subsidi Pupuk di Gorontalo.
- BPS. 2023. Statistik Kemiskinan Provinsi Gorontalo.
- Ettah, I., E.A. Emmanuel, A. Ikutal, and G.M. Ubi. 2020. Determinants of Poverty Status Among Crop and Fish Farmers in Southern Nigeria. Ann. Res. Rev. Biol., 87–96. https://doi.org/10.9734/arrb/2020/v35i330203[CrossRef]
- Fahrudin, A. and H. Santoso. 2023. Dampak Bantuan Sosial terhadap Kemandirian Nelayan.
- Food and Agriculture Organization (FAO). 2018. Transforming Food and Agriculture to Achieve the SDGs. Rome: FAO
- Godart, O., H. Görg, and A. Hanley. 2016. Trust-Based Work Time and Innovation: Evidence From Firm-Level Data. Ilr Rev., 70(4): 894–918. https://doi.org/10.1177/0019793916676259[CrossRef]
- Kementerian Pertanian RI (Kementan). 2019. Pedoman Umum Pemetaan Indeks Kapasitas Petani. Badan Penyuluhan dan Pengembangan SDM Pertanian, Pusat Data dan Sistem Informasi Pertanian (Pusdatin), Jakarta
- Khan, Md. R., M.J. Alam, N. Tabassum, M. Burton, and N.A. Khan. 2022. Investigating Supply Chain Challenges of Public Sector Agriculture Development Projects in Bangladesh: An Application of Modified Delphi-BWM-Ism Approach. Plos One., 17(6): e0270254. https://doi.org/10.1371/journal.pone.0270254[CrossRef]
- Kurniawan, M.A., D.N. Sari, and N. Fauziyah. 2024. Tinjauan Terhadap Kebijakan Ekonomi Tiongkok Sebagai Pemuncak Global: Analisis Perbandingan Dengan Amerika Serikat. Dinam. Sos. J. Pendidikan Ilmu Pengetahuan Sos., 3(1): 30–39. https://doi.org/10.18860/dsjpips.v3i1.6360[CrossRef]
- Kushwaha, D., D. Singh, R. Rajak, R. Gupta, & U.S. Kushwaha. 2024. Agrocraft- Afresh Farm Agricultural Products. Int. Res. J. Moderniz. Engineer. Technol. Sci., https://doi.org/10.56726/irjmets51467[CrossRef]
- Mukhlis, I., I.M. Hendrati, Ö.S. Gürçam, and S.H. Utomo. 2021. Poverty and Food Security: A Reality in ASEAN Countries. J. Ekonomi Dan Studi Pembangun., 13(1): 1. https://doi.org/10.17977/um002v13i12021p001[CrossRef]
- Nyeleker, K.P. and Suswanta. 2025. Zero-Poverty Villages? The Effectiveness of the Village Sustainable Development Goals Policy in Indonesia. IOP Confer. Ser: Earth Environ. Sci., 1475(1). https://doi.org/10.1088/1755-1315/1475/1/012030[CrossRef]
- Ostrom, E. 2010. Beyond Markets and States: Polycentric Governance of Complex Economic Systems. Amer. Econ. Rev., 100(3): 641-672. DOI:https://doi.org/10.1257/aer.100.3.641.[CrossRef]
- Rahman, A. 2022. Agricultural Transformation in Indonesia: Evaluation of Policy Implementation and Challenges Faced. Jurnal Ilmiah Ilmu Administrasi Publik: J. Pemikir. Dan Penelit. Administ. Publik., 12: 691–700. Retrieved September 12, 2025, from http://ojs.unm.ac.id/iap
- Rahman, A. and S. Siradjuddin. 2020. Islamic Economic Concept in Poverty Alleviation. J. Asian Multicult. Res. Econ. Manag. Stud., 1(2): 67–74. https://doi.org/10.47616/jamrems.v1i2.68[CrossRef]
- Rust, N.A., P. Stankovics, R.M. Jarvis, Z. Morris-Trainor, J.R. Vries, J. de, J. Ingram, J.A. Mills, J. Glikman, Z. Parkinson, R. Tóth, R. Hansda, J. McMorran, Glass, and M.S. Reed. 2021. Have Farmers Had Enough of Experts? Environ. Manag., 69(1): 31–44. https://doi.org/10.1007/s00267-021-01546-y[CrossRef]
- Supriyanto, S. 2025. An Exploratory Study of the Economic and Social potential of Rumbia Village as a Basis for Sustainable Development Planning in the Sub-district. Innovative: J. Soc. Sci. Res., 5(4): 9159–9171. https://doi.org/10.31004/INNOVATIVE.V5I4.20937[CrossRef]
- Sumaila, S., I. Bempah, and Y. Bakari. 2022. Akses Masyarakat Miskin Pedesaan Terhadap Sumberdaya Alam Di Desa Bonedaa Kecamatan Suwawa Selatan Kabupaten Bone Bolango. DOI: https://doi.org/10.37046/agr.v7i1.18959[CrossRef]
- Saad, H., I. empah, K. Arsyad. 2024. Adaptasi Dampak Perubahan Iklim Melalui Adopsi Pertanian Berkelanjutan. J. Penyuluhan Pertan., 19(1): 1–11. https://doi.org/10.51852/JPP.V19I1.755[CrossRef]
- Sarvina, Y. 2019. Dampak Perubahan Iklim Dan Strategi Adaptasi Tanaman Buah Dan Sayuran Di Daerah Tropis / Climate Change Impact and Adaptation Srategy for Vegetable and Fruit Crops in the Tropic Region. J. Penelitian Dan Pengembangan Pertanian., 38(2): 65. https://doi.org/10.21082/jp3.v38n2.2019.p65-76[CrossRef]
- Shakoor, U., A. Saboor, I.A.A.P.J. Baig. 2015. undefined. (n.d.). Climate variability impacts on rice crop production in Pakistan.NAPakistan Journal of Agricultural Research; H- Index: 2. Academia.EduU Shakoor, A Saboor, I Baig, A Afzal, A RahmanPakistan Journal of Agricultural Research
- Setiyowati, I.L., S. Sasongko, and I. Noor. 2018. Farmer Exchange Rate and Agricultural Land Conversion Analysis to Agricultural Sector Poverty in Indonesia. J. Ekonomi Dan Studi Pembangunan., 10(1): 35–43. https://doi.org/10.17977/um002v10i12018p035[CrossRef]
- Singh, S. and S.K. Srivastava. 2021. Decision Support Framework for Integrating Triple Bottom Line (TBL) Sustainability in Agriculture Supply Chain. Sustain. Account. Manag. Policy J., 13(2): 387–413. https://doi.org/10.1108/sampj-07-2021-0264[CrossRef]
- Zhang, Y. and J. Huai. 2023. A Case Study of Farmers’ Behavioral Motivation Mechanisms to Crack the Fractal Multidimensional Relative Poverty Trap in Shaanxi, China. Agric., 13(11): 2043. https://doi.org/10.3390/agriculture13112043[CrossRef]
- Zhong, F., C. Ying, & D. Fan. 2022. Public Service Delivery and the Livelihood Adaptive Capacity of Farmers and Herders: The Mediating Effect of Livelihood Capital. Land., 11(9): 1467. https://doi.org/10.3390/land11091467[CrossRef]
Services
Article usage statistics
Loading…