
The present study was conducted to study impact of soil types on rodent distribution and abundance in North Punjab. The survey was conducted from February to December, 2015 using snap traps by applying line transect technique in wild area by using over 3840 trap nights in eight type of soil (sand, loamy sand, sandy loam, sandy clay loam, loam, clay loam, silt loam, silty clay loam). A total of 1571 animals were captured belonging to species of Nesokia indica, Mus musculus, Mus budooga, Millardia meltada, Tatera indica and Golunda elliotti. The maximum number of rodents was captured in loamy soil type with population density (53.3±19.8) per hectare. The lowest rodent population density was captured in silty clay loam soil type with population density (22.5±5.7) per hectare. The population density in other soil types differ significantly (P≤ 0.05). The statistical results of this study found the following habitat preference of the species: clay loam for N. indica, sand for Mus musculus and Mus booduga, respectively, loam for Tatera indica and silty clay loam for Golunda ellioti and Millarda meltada, respectively. The PCA results indicate loam as a preferred soil type for N indica and T. indica). The species G. elliotti and M. meltada prefer soil containing silt and clay (silty clay loam). The species M. musculus and M. booduga prefer sand and positively correlated with two soil type (sandy loam and sandy clay loam). The present study provides baseline abiotic soil data for conservation needs and harboring of studied species.
Short Communication · Volume 50, Issue 1, 19 January 2018 · Open Access
Impact of Soil Types on the Abundance of Murid Population in North Punjab, Pakistan
· ·
Affiliations & Notes ⌄
- 1Department of Zoology, Women University of Azad Jammu and Kashmir, Bagh, Pakistan 2Bioresource Research Centre, 34-Bazar Road, G-6/4, Islamabad, Pakistan , * Corresponding author: sabulhussan@gmail.com
Article Info ⌄
- Journal:
- Pakistan Journal of Zoology
- Published:
- 19 January 2018

From the article
- We captured 1571 samples which belonged to the following 6 species Nesokia indica, Mus musculus, Mus budooga, Tatera indica, Millardia meltada and Golunda ellioti trapped over 3840 trap nights (Table II).
- The house mouse (Mus musculus) prefers sand soil type (22%) followed by loamy sand (19%), sandy loam (17%) sandy clay loam 14%, loam 11%, clay loam 8%, silt loam 6% and least preferred soil was silty clay loam (3%) (Table III).
- This species shows negative relation with silt and clay and no relation with EC and pH, in correlation matrix of principal component analysis.
Selected from the article's own text.
Abstract
Materials and methods
North Punjab (Pakistan) includes hilly undulates of Pothwar Plateau and northern Parts of the Indus Plain is land of two major rivers Indus and river Jhelum, several seasonal streams, ravine belts and cultivated areas. The study area has various mountain ranges, such as, Kala Chitta Range, Margalla Hills Range, Salt Range and Khairi Murat (www.dawn.com/weekly/herald/herald33.htm). The climate is sub-humid to semi-arid, annual rainfall varies from 38 cm in southwest to 150 cm in the northeast .
The small mammals were trapped from 8 randomly selected localities from four districts, viz., Attock (Chura Sharif, Makhad Sharif, Mankur), Chakwal (Bharpur, Noor pur Sethi, Khokherzer), Rawalpindi (Dullah), Jhelum (Sroba). In each location uncultivated wild land was selected, where four trap lines transect were set trapping rodents over some 100 hectare following . A trap-line transect consisting of 30 trap stations laid on a straight line at of distance of 17 m from each other. At each station three snap traps (2 Rat and one mouse) were set and trapping executed for three nights consecutively. Each trap was baited with bread with application of vegetable ghee . Trapping nights were calculated by multiplying number of traps with number of nights. The traps were set late in the evening and checked next morning, specimen removed and identified to species level using key (Robert, 1997) and recorded separately for sampling site and day.
Three soil samples (total 24 from eight villages) were taken from each locality from at a depth of 30 cm, which were packed in plastic bags for laboratory processing.
The texture class was determined as relative proportions of different soil fractions (dried and grinded sand, silt and clay) using the USDA textural triangle. The soil samples (10g) were taken in a 600 ml beaker to which 60 ml of dispersing solution (40 g of sodium hexametaphosphate, 10 g of sodium carbonate dissolved in distilled water and the volume made up one liter) was added and left for 24 h. The contents of beaker were transferred into soil-stirring cup, and the cup was filled with water to about three-quarters. The suspension was stirred at high speed for 3 min using the special stirrer, when stirring paddle was rinsed in the cup and was allowed to stand for 1 min. The suspension was transferred into a 1-L hydrometer jar and distilled water added to make a volume of 1 L . The heights of clay, silt and sand layers was recorded and relative proportions calculated by dividing each height with total thickness of the solid layers and converted into percentiles for the proportional representation of each soil component.
The saturation paste prepared by dissolving soil sample in KCl solution (0.7456 g in 1 liter of distilled water). was passed through moist filter paper and extract obtained by applying pressure. The electrical conductivity determined by passing the extract through conductivity meter in mS cm-1 or dS m-1. Saturated paste of soil (10 g) was prepared by adding deionized water and allowed to equilibrate for 18-24 h, pH was measured with pH meter (PHS-3D-02 pH Meter) .
Principal components analysis (PCA) was used to find association between rodent population abundance and soil content (sand, silt and clay).
Results and discussion
Table I shows a total of eight soil types recognized on the basis of relative proportions of three basic soil components, i.e., clay, silt and sand The percentage of sand varies from 20% to 85%, silt from 7% to 55%, and clay from 8% to 25%. The soil samples were normal to alkaline with pH ranging from 6.9 to 8.0 and EC varied from 0.3 to 0.92 EcdS m-1.
We captured 1571 samples which belonged to the following 6 species Nesokia indica, Mus musculus, Mus budooga, Tatera indica, Millardia meltada and Golunda ellioti trapped over 3840 trap nights (Table II). Trapping success was the highest in loam (66.6%), consecutively followed by clay loam (55.2%), sandy (42.7%), loamy sand (35.4%), clay loam (34.3%), sandy loam (33.3%), clay loam (34.3%), silt loam (31.4%) and the lowest trapping success in silt clay loam (28.1%) (Table II).
The house mouse (Mus musculus) prefers sand soil type (22%) followed by loamy sand (19%), sandy loam (17%) sandy clay loam 14%, loam 11%, clay loam 8%, silt loam 6% and least preferred soil was silty clay loam (3%) (Table III). This species shows negative relation with silt and clay and no relation with EC and pH, in correlation matrix of principal component analysis. The most preferable habitat
Table I.- Characteristics of the soil and coordinates of at different localities.
| Locality | Soil type | Components (%) | EC (dS m-1) | pH | ||
| Sand | Silt | Clay | ||||
| Chura Sharif | Sand | 85 | 7 | 8 | 0.58 | 7.6 |
| Bharpur | Loamy sand | 75 | 10 | 15 | 0.35 | 7.4 |
| Makhad Sharif | Sandy loam | 70 | 20 | 10 | 0.87 | 7.52 |
| Mankur | Sandy clay loam | 50 | 30 | 20 | 0.83 | 7.12 |
| Sroba | Loam | 40 | 35 | 25 | 0.92 | 6.92 |
| Noor Pur Sethi | Clay loam | 30 | 30 | 40 | 0.80 | 7.8 |
| Khokherzer | Silt loam | 25 | 50 | 45 | 0.30 | 8.0 |
| Dullah | Silty clay loam | 20 | 55 | 25 | 0.61 | 7.0 |
Table II.- Trapping success of rodents in different soil types.
| Locations | Coordinates | Soil Type | Total trap nights | Capturing night | Total capture | Capture per night | ||
| 1 | 2 | 3 | ||||||
| Sroba | 32°34'17.53"N, 72°49'22.88"E | Loam | 480 | 120 | 109 | 91 | 320 | 0.6 |
| Noor Pur Sethi | 32°40'8.07"N, 72°34'50.74"E | Clay loam | 480 | 103 | 88 | 74 | 265 | 0.55 |
| Chura Sharif | 33°27'24.29"N, 72° 6'33.25"E | Sand | 480 | 90 | 70 | 45 | 205 | 0.4 |
| Bharpur | 32°51'0.94"N, 72°33'58.10"E | Loamy Sand | 480 | 65 | 55 | 50 | 170 | 0.4 |
| Mankur | 33°28'18.58"N, 71°54'47.14"E | Sandy clay loam | 480 | 64 | 58 | 43 | 165 | 0.34 |
| Makhad Sharif | 33° 2'9.51"N, 71°47'13.40"E | Sandy loam | 480 | 60 | 55 | 45 | 160 | 0.3 |
| Khokherzer | 32°48'59.24"N, 72°50'4.92"E | Silty clay loam | 480 | 60 | 48 | 43 | 151 | 0.31 |
| Dullah | 33° 9'27.81"N, 72°41'4.17"E | Silt Loam | 480 | 55 | 45 | 35 | 135 | 0.2 |
| 3840 | ||||||||
Table III.- Relative abundance of different rodent species in different soil types.
| Soil type | M. musculus | M. booduga | T. indica | N. indica | G. ellioti | M. meltada |
| Sand | 80 | 60 | 55 | 10 | 0 | 0 |
| Loamy Sand | 70 | 50 | 0 | 50 | 0 | 0 |
| Sandy loam | 60 | 40 | 0 | 60 | 0 | 0 |
| Sandy clay loam | 50 | 30 | 0 | 70 | 5 | 10 |
| Loam | 40 | 25 | 140 | 80 | 20 | 15 |
| Clay Loam | 30 | 20 | 80 | 90 | 25 | 20 |
| Silt Loam | 20 | 10 | 20 | 46 | 30 | 25 |
| Silty clay loam | 10 | 10 | 10 | 40 | 35 | 30 |
of Indian field mouse (Mus booduga) was sand (24%), followed by loamy sand (20%), sandy loam (16%), sandy clay loam (12%), loam (10%), clay loam (8%) and lowest preferred soil type was silt loam (4%) and silty clay loam (4%). This species also show similar behavior like Mus musculus and show negative relation with silt and clay and no relation with EC and pH, in correlation matrix of principal component analysis.
The Indian gerbil (Tatera indica) prefers loam soil (46%), followed by clay loam (26%), sand (18%), silt loam (7%) and least preferred soil was silty clay loam (3%). There was no capturing of T. indica in soil type, loamy sand, sandy loam and sandy clay loam (Table III).
The order of preferred soil by fossorial rodent species the short-tailed rat (Nesokia indica) was clay loam (20%), (Loam (18%), sandy clay loam (16%), sandy loam (14%), loamy sand (11%), silt loam (10%), silt clay loam (9%) and sand (2%) (Table III).
The complete absence of Indian Bush Rat or coffee rat (Golunda ellioti) in soil type sand, loamy sand and sandy loam was registered. The most preferred soil for this rat species was silty clay loam (30%) followed by silt loam (26%), clay loam (22%), loam (17%) and least preferred soil was sandy clay loam (4%) (Table III). The species show negative relation with sand, silt and clay in correlation matrix of principle component analysis (Supplementary Table I).
The eigenvalues was the highest in F1 (6.663), consecutively followed by F2 (2.094), F3 (1.144), F4 (0.729), F5 (0.285), F6 (0.055), and F7 (0.030) (Supplementary Table I). The eigenvalue corresponds to a factor in one dimension. The eigenvalues correspond to a high % of the variance; ensure that the factors are a good quality projection (Fig. 1).
The correlation circle on axes (F1 and F2) shows a projection of variables in the factors space. The variables Nesokia indica, Tatera indica density (loam are far from the center, and are significantly positively correlated (r close to 1). The variables (G. elliotti, M. meltada) density (silty clay loam) are also far from the center and are significantly positively correlated (r close to 1). The distribution of Mus musculus and Mus booduga and sand concentration are also far from the center, and are significantly positively correlated (r close to 1) (Fig. 2).
The study revealed six species of rodents (Table III) in six type of soil (sand, loamy sand, sandy loam, sandy clay loam, loam, clay loam, silt loam, silty clay loam). We identified three type of rodent communities: Mus musculus and Mus booduga (Community 1), Nesokia indica and Tatera indica (Community 2), Glounda elliotti and Millardia meltada (Community 3). The composition of rodent community varies in different soil types. The Community one is widely distributed and abundant in sand soil type, while the community two is widely distributed and abundant in loamy soil type. The distribution and
abundance of third rodent community is limited to silty clay loam soil type. The results support the conclusion that soil type is limiting factor in distribution and abundance rodents according to the findings of Massawe et a. (2008).
The Indian bush rat (Glounda elliotti) is widely distributed and abundant in silt clay loam soil type and the complete absence in soil types such as sand, loamy sand and sandy loam, indicates that soil texture (sand, silt, clay) directly affect the distribution and abundance of these rodent species and is support the results according to finding of . The distribution of (G. elliotti is already reported in silty soil (http://www.iucnredlist.org2017). The samples of the species was captured from vicinity of rocky and hilly tracts and analysis of soil result (silty clay loam) is also confirmed by previous findings
The species Millardia meltada is widely distributed in south Asia (Sri Lanka, India and Nepal) and is Least Concern (http://www.iucnredlist.org2017), with no major threats known affecting its population . The results of our study indicate that the species shows similar habitat association like Glounda elliotti and is distributed in silty clay loam soil types at cultivated crop arid lands and our results are also conform the findings of Molur et al. (2005).
The species Tatera indica is widely distributed in south Asian countries and is reported in abundance at Pothwar (Punjab) . The results of our study also indicate burrowing rodent Tatera indica prefers loamy soil (Fig. 2) of dry river slopes which is mostly loamy and confirm our findings.
The species Nesokia indica is also widely distributed in south Asian countries but there are no study on its population abundance known to date . The results of our study also indicate that it is an example of another one species which prefers loamy soil (Fig. 2).
The house mouse (Mus musculus) is widespread, abundant and commonly regarded as a pest species . The results of present study indicate that the species show direct relation with soil type (sandy loam) and an inverse relationship with the percentage of silt and clay . It was captured from all soil types.
The mouse Mus booduga is another widespread, abundant rodent native to South Asian countries (India, Sri Lanka, Pakistan, southern Nepal, Bangladesh) . The results of present study indicate that it is also shows direct relation with soil type (sandy) and an inverse relationship with the percentage of silt and clay . It was as well captured from all soil types.
Supplementary material
There is supplementary material associated with this article. Access the material online at: http://dx.doi.org/10.17582/journal.pjz/2018.50.1.sc8.
Statement of conflict of interest
Authors have declared no conflict of interest.
Figures
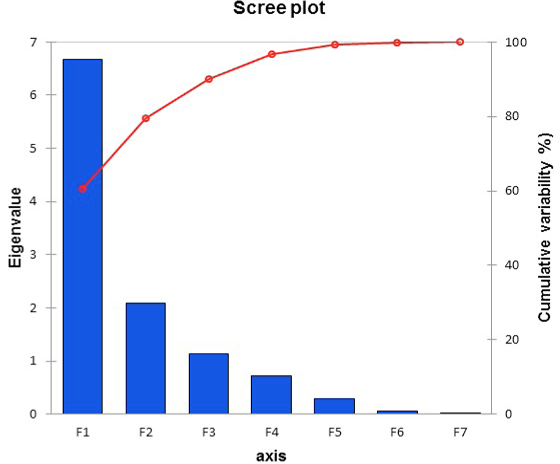
PCA plot showing eigenvalues.
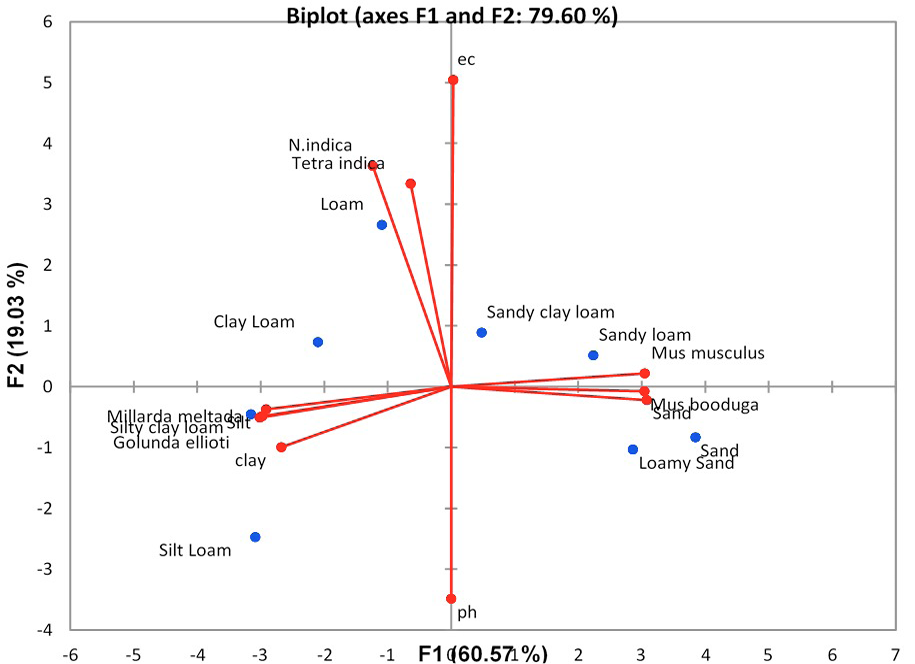
PCA plot showing the distribution of different species in different soil types.
References
- Amori, G., 2007. Mus musculus. The IUCN red list of threatened species 2007: e.T13972A4375664. Downloaded on 15.11.2017 (http://www.iucnredlist.org2017)
- Anonymous, 1976. Repot of the Punjab Barani Commission. Government of the Punjab, Lahore.
- Beg, M.A., Mushtaq-ul-Hassan, M., Shahwar, D. and Nadeem, M.S., 2010. Pakistan J. Zool., 42: 311-323.
- Bouyouces, G.J., 1962. Agron. J., 53: 464-465.
- Cunningham, D.M. and Moors, P.J., 1996. Guide to the identification and collection of New Zealand rodents. Department of Internal Affairs, Wellington.
- DiMinin, E., Fraser, I., Slotow, R. and MacMillan, D.C., 2013. Anim. Conserv., 16: 249-258.
- Faiz, H.A., Abbas, F.I., Ali, Z., Nadeem, S., Mushtaq, M., Zahra, L. and Safder, L., 2015. J. Anim. Pl. Sci., 25(Supp. 3): 441-445.
- Faiz, H.A. and Abass, F., 2016. Pakistan J. Zool., 48: 1209-1212.
- Feldhamer, G., 1979. Great Basin Natural., 393: 207-218.
- Hussain, R.S., 2005. Pak. J. agric. Sci., 42: 1-2.
- Massawe, A.W., Rwamugira, W., Leirs, H., Makundi, R.H., Mulungu, L., Ngowo, V. and Machang, R.U., 2008. Integr. Zool., 3: 27-30.
- Kumar, P. and Pasahan, S.C., 1993. J. Biosci., 18: 149-153. https://doi.org/10.1007/BF02703046[CrossRef]
- Molur, S., Srinivasulu, C., Srinivasulu, B., Walker, S., Nameer, P.O. and Ravikumar, L. (eds.), 2005. Status of South Asian non-volant small mammals: Conservation assessment and management plan (C.A.M.P.). Workshop Report, Zoo Outreach Organization, CBSG-South Asia, Coimbatore, India, pp. 618.
- Molur, S. and Nameer, P.O., 2008. In: IUCN red list of threatened species, Version 2009. 2. www.iucnredlist.org Downloaded on 26.11.2009.
- Reichman, O.J. and Smith, S.C., 1990. In: Current mammalogy (ed. H.H. Genoways), Volume 2. Plenum Press, New York, pp. 596.
- Roberts, T.J., 1997. Mammals of Pakistan. Oxford University Press, Karachi, pp. 525.
- Rodriguez, D., 2009. J. Arid Environ., 73: 444-448.
- Schofield, R.K. and Taylor, A. W. 1955. Soil Sci. Soc. Am. J., 19: 164-167. https://doi.org/10.2136/sssaj1955.03615995001900020013x[CrossRef]
- Sieg, C.H., 1987. Small mammals: Pests or vital components of the ecosystem. Great Plains Wildlife Damage Control Workshop Proceedings, pp. 97.
- Zhang, Y., Zhibin, Z. and Jike, L., 2003. Mammal Rev., 33: 284-294. https://doi.org/10.1046/j.1365-2907.2003.00020.x[CrossRef]
Supplementary material
Cited by 2 articles
In journals published by ResearchersLinks.
- Distribution and Abundance of Vertebrate Pests of Cultivated Maize and their Eco-Friendly Management in District Bagh, Azad Jammu and Kashmir, PakistanPakistan Journal of Zoology · 2020
- Burrowing Activity of Rodents Alter Soil Properties: A Case Study on the Short Tailed Mole Rat (Nesokia indica) in Pothwar Plateau, Punjab, PakistanPakistan Journal of Zoology · 2018
Services
Article usage statistics
Loading…