
In arid and semi-arid environments such as Iraq, limited rainfall, high temperatures, and elevated evapotranspiration rates lead to severe freshwater scarcity. This necessitates the adoption of alternative irrigation sources such as well and drainage water , along with efficient irrigation techniques particularly alternating irrigation to mitigate water scarcity and promote sustainable agriculture. A field experiment was conducted in Balad Ruz, Diyala Governorate, to investigate the effects of irrigation water salinity and soil texture on wheat performance. The study employed a split-plot design with three replications, where irrigation water types constituted the main plots and soil textures the subplots. River water consumption was measured at 467.9 mm, 450.7 mm, and 438.4 mm for clay, sandy, and alluvial clay soils, respectively , indicating variation due to soil properties. Alternating irrigation methods yielded water savings of 2298.175 m³ ha-¹, 2253.65 m³ ha-¹, and 2192 m³ ha-¹ for clay, sandy loam, and silty clay soils respectively. Crop coefficient (Kc) values across the growth period were 0.78 (December), 0.79 (January), 1.12 (February), 0.96 (March), and 0.46 (April). Grain yields improved significantly under alternating irrigation, reaching 4.81 Mg ha-¹ and 4.13 Mg ha-¹, representing increases of 87.9% and 61.3% over single-source irrigation treatments. Sandy loam soils produced the highest yield (4.43 Mg ha-¹), surpassing silty loam by 15.9%. Water use efficiency was highest in sandy loam (0.96 kg m-³), exceeding clay soils (0.88 kg m-³) by 9%. 847.5 IQD and 714.7 IQD for drainage–river and well–river irrigation methods, respectively, highlighting the economic advantage of mixed water use. These findings emphasize the vital role of integrated irrigation strategies in enhancing water sustainability and supporting long-term food security under Iraq’s arid climatic conditions.
Research Article · Volume 39, Issue 3, 3 September 2026 · Open Access
Irrigation Management with Variable Water Quality and Its Effects on Water Use and Wheat Productivity in Diverse Soils under Arid Iraqi Conditions
· · · ·
Affiliations & Notes ⌄
- 1College of Agriculture, University of Kirkuk, 9487, Kirkuk, Iraq
- 2Ministry of Education, General Directorate of Education in Diyala, Diyala, 32001, Iraq
- 3Baladruz Education Department, Diyala Education Directorate, Iraq
- 4Upper Euphrates Centre for Sustainable Development Research, University of Anbar, 31001, Iraq
- 5Department of Soil Science and Water Resources, College of Agriculture, University of Al-Qadisiyah, Al-Diwaniyah, Iraq. *Correspondence | Mustafa Qais Hamid, College of Agriculture, University of Kirkuk, 9487, Kirkuk, Iraq
- 6Email: mustafa.qais@qu.edu.iq
Article Info ⌄
- Journal:
- Pakistan Journal of Agricultural Research
- Published:
- 3 September 2026
From the article
- In addition, extending intermittent irrigation with well–river or drainage–river water irrigated effectively up to 0.5 ha and enhanced the wheat yield per unit water applied when compared with the tradition river-water method of irrigation.
- AL was found to be more effective in the improvement of grain yield, field water use efficiency and economic water productivity compared with saline SGSIMs.
- This strategy was an efficient way to mitigate the reductions in relative yield usually induced by saline irrigation and consequently achievement of sustainable water management with plant production in arid regions.
Selected from the article's own text.
Abstract
Introduction
Water resources are fundamental to agricultural productivity, especially in arid and semi-arid regions such as Iraq, where limited rainfall, elevated temperatures, and evapotranspiration rates that surpass precipitation levels result in persistent water scarcity (Ghani et al., 2022; Alshamary and Noori, 2024). The situation is further exacerbated by the declining and irregular flow of the Tigris and Euphrates rivers, which intensifies the strain on freshwater resources (Al-Ansari et al., 2021). Consequently, water scarcity has emerged as a global challenge that demands immediate action through improved irrigation management and sustainable water resource planning (Nafi, 2013).
Global warming, which is due to the build-up of greenhouse gases, puts additional stress on freshwater availability with increased temperatures and evaporation rates thereby affecting both the quantity and quality of this essential resource (Khazal and Azeez, 2024; Mohammed and Azeez, 2024). Modeling suggests that a 3°C increase in air temperature may elevate irrigation water requirements by around 15% (Al-Amud, 2010). To make matters even worse, man-made activities including over-abstraction and reckless handling of freshwater resources exacerbate the problem, highlighting the demand for alternative sources of water and creative ways of irrigation.
The use of saline water sources has been proposed as a method for dealing with the decrease in freshwater availability. Nevertheless, the indiscriminate use of high saline water can deteriorate soil structure and crop productivity as well as environmental sustainability because of salt accumulation and ion toxicity (Choudhary and Bajwa, 2021). Field experiments performed in Iraq investigated the possibility of using saline well and drainage water, as well as estuarine water for irrigation of major crops like wheat, barley, maize, cotton and sunflower (Lateef et al., 2024; Alshamary et al., 2021; Tuama et al., 2024). It is concluded that saline water can be used commer-cially if it is complemented with proper water, soil and crop management practices to keep a salinity balance within the root zone preventing losses of productivity.
One of these recommended strategies is alternate application of saline and freshwater irrigation (as opposed to mixed or blended) in order to preserve high quality water for sensitive crops while reducing the risk of soil salinity (Hamid et al., 2025, Mahmoud et al., 2025). Hence, in this paper the possibility of irrigation by saline water to wheat under arid situation is examined in Iraq. More precisely, it evaluates the impact of salinity of irrigation water and texture of soils on water use, irrigation efficiency, crop yield and economic profitability. In summary, given that water resources in Iraq are becoming increasingly limited as a result of both climatic and anthropogenic influences, it is necessary to introduce suitable irrigation strategies which would use the available water efficiently while providing acceptable agricultural yield. Accordingly, such a study is sought in this work to investigate the effects of irrigation water salinity and soil texture on water use, grain yield and economic efficiency of wheat production. The results could be incorporated into the national strategy as part of the programs developed for sustainable water management and food security in Iraq’s dry lands.
Table 1: presents the physical and chemical properties of the soil samples before planting.
|
Trait |
Value |
Unit |
|||
|
Soil 1 |
Soil 2 |
Soil 3 |
|||
|
Electrical conductivity |
1.7 |
2.4 |
2 |
dS m-1 |
|
|
pH |
7.3 |
7.1 |
7.4 |
||
|
Organic matter |
18 |
22 |
24 |
g kg-1 |
|
|
CaCO3 |
115 |
124 |
117 |
||
|
CaSO4 |
32 |
37 |
32 |
||
|
Sand |
688.8 |
168.8 |
208.8 |
g kg-1 |
|
|
Silt |
120 |
380 |
140 |
||
|
Clay |
191.2 |
451.2 |
651.2 |
||
|
Texture classes |
Sandy loam |
Silty clay |
Clay |
||
|
Bulk density |
1.32 |
1.31 |
1.30 |
Mg m-3 |
|
|
Particle density |
2.65 |
2.63 |
2.62 |
||
|
Porosity |
50.01 |
50.19 |
50.38 |
% |
|
|
Volumetric soil moisture at tensions (kPa) |
33 |
0.26 |
0.38 |
0.41 |
cm3cm-3 |
|
1500 |
0.12 |
0.22 |
0.30 |
||
|
Available water |
0.14 |
0.16 |
0.11 |
cm3cm-3 |
|
Materials and Methods
greenhouse pot experiment was conducted in the Baladruz district of Diyala province to examine how irrigation water of different salinity levels affects wheat growth and yield across soils with varying textures. Soil samples were collected by three replicates in depth of 0–30 cm at the representative sites of the district. These samples were air-dried, crushed and passed through a 2 mm sieve prior to physical and chemical analyses (Table 1). The experiment consisted of two main factors; the first was the quality of irrigation water, which involved five treatments such as (1) river, (2) well or salty water (3) Drainage water), (4) well and then secondly with River, and finally (5) Drainage followed by River. The chemical characteristics of the irrigation waters are described in Table 2. Soil texture was the second factor, described in three categories: sandy loam, silty clay and clay soil.
Table 2: summarises the chemical characteristics of the irrigation water sources employed in the experimental treatments.
|
Trait |
Value |
Unit |
|||
|
River water |
Well water |
Drainage water |
|||
|
EC |
1.1 |
3.15 |
1.92 |
dS m-1 |
|
|
pH |
7.05 |
7.13 |
7.06 |
||
|
Cations and anions |
Ca++ |
4.2 |
7.2 |
5 |
meq litre-1 |
|
Mg++ |
2.5 |
5.1 |
3.8 |
||
|
Na+ |
1.2 |
10.5 |
4.5 |
||
|
K+ |
0.1 |
0.7 |
0.5 |
||
|
Cl- |
1 |
1.6 |
1.3 |
||
|
So4-- |
1.2 |
2.5 |
2.1 |
||
|
No3- |
0.1 |
0.43 |
0.33 |
||
|
Co3-- |
0.3 |
1.3 |
1 |
||
|
Hco3- |
2.1 |
3.8 |
3.2 |
||
|
SAR |
0.65 |
4.25 |
2.15 |
||
|
Class |
C3S1 |
C4S1 |
C3S1 |
||
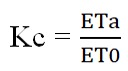
The experiment was performed in split-plot design with three replications. Irrigation water type was used as a main plot factor and the soil texture was assigned to subplots. Pots (30 × 30 × 30 cm) were made and filled up with the soil of respective treatments. Phosphate and potash, together with half of the total nitrogen dose, 150 kg N ha-¹ 100 kg K₂O ha-¹ and 100 kg P₂O₅ ha-¹ respectively) were added at sowing according to common agronomic practices.The remaining nitrogen was applied 45 days post-planting (Ali, 2014). Wheat seeds of the Nizar cultivar were sown on 1 December 2023, with two rows per pot, spaced 15 cm apart and 4 cm between plants, resulting in 15 plants per pot, equivalent to a planting density of approximately 166,665 plants ha-¹. Drip irrigation was implemented using GR-type drip lines with an emitter discharge of 4 L h-¹. Irrigation was scheduled when 50% of the available water had been depleted, with the depth calculated according to the equation described by Alkhateeb et al. (2019).
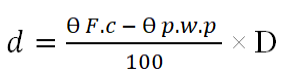
d= Added water depth (cm); θF.c = Volumetric moisture at field capacity (cm3 cm-3); θbi = Volumetric moisture before irrigation and actually calculated (cm3 cm-3). D = Depth of root system in the soil (cm) as shown in Table 3.
Crop factor (Kc) values as reported in FAO 56 (Allen et al., 1998b) were adopted, while the depths of the root zone according to the stages of plant growth have been proven through field observations.
The volume of water applied to the soil to meet the leaching requirement for salt removal was determined using the equation proposed by Haman (2000), under surface irrigation conditions, as outlined below:

LR = leaching requirement; ECiw = salinity of irrigation water (dS m-1).
MAXECe = the threshold salinity level in field soils at which wheat yield declines to zero, According to Ayers and Westcot (1976), is approximately 20 dS m-¹. This critical value varies depending on the crop species under consideration.
The calculated leaching requirement ratios as percentages of the applied irrigation depth were 2.75%, 7.87% and 4.8% from river, well and drainage water, respectively. These values for the DIs were then converted into their respective irrigation depths according to Haman (2000) as follows:
dL = LR * d
dL: water depth to be added as leaching requirements, (cm).
LR: quantity of leaching requirements, (%).
d: depth of water to be added, (cm).
The total irrigation depth is determined by the sum of the depth of water to be added (d) and the depth
Table 3: shows stages of wheat crop growth, root depths and crop factor
|
No. |
Growth stages |
Period |
period (day) |
Crop factor (KC) |
Roots depth (cm) |
|
|
from |
to |
|||||
|
1- |
Germination and vegetative growth |
١/١٢/٢ ٠٢٤ |
٢٧/١٢/ ٢٠٢٤ |
27 |
0.8 |
10 |
|
٢- |
Elongation and lining |
٢٨/١٢/ ٢٠٢٤ |
٢٢/٢/ ٢٠٢٤ |
57 |
1.2 |
20 |
|
٤- |
Flowering |
٢٣/٢/٢٠٢٤ |
٢٧/٤/٢٠٢٤ |
63 |
1 |
30 |
|
٥- |
Maturity |
٢٨/٤/٢٠٢٤ |
٢٥/٥/٢٠٢٤ |
28 |
0.5 |
٣٠ |
of leaching requirements (dL), as expressed in the following equation.
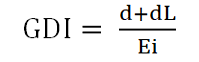
GDI = Total Irrigation depth (cm).
Ei = efficiency of surface drip irrigation system (90%).
dL = depth of leaching requirements (cm).
d= the depth of water added to the soil (cm).
Irrigation was scheduled based largely on information from US Evaporation Basin A, which became the primary indication for initiating soil sampling in the field. Residual soil moisture was later on determined gravimetrically (after the above-mentioned routine) at which point 50% of PAWC had been used up, in an iterative manner (Al-Shamary et al., 2021). When the soil moisture exceeded this value, it was assessed again to know exactly when the irrigation should be made.
Calculation of water consumption for wheat
Actual water consumption Eta
The actual water consumption of wheat was estimated through the application of the water balance equation, as outlined by Zhang et al. (2021).
(I+P+C) ̶ (Eta+Dp+R) = ± ∆S
ETa = I+P+ ±∆S
ETa= Actual evapotranspiration (mm).
I = depth of irrigation water added (mm).
P = depth of rainwater (mm).
C = 0 water height capillary property (mm)
By observing groundwater and found that it is deep.
∆S = Change in soil moisture storage over a specified period of time (mm).
R = 0 as the ground is flat and there is no runoff.
Results and Discussion
Total depth of irrigation (TDI)
Seasonal irrigation requirements for wheat varied significantly across soil textures and irrigation water qualities (Figure 1). Under river water irrigation, the seasonal water use efficiency was 467.9, 450.6 and 438.4 mm application which met with wheat requirements (Ali, 2010) for the growth of wheat that this crop required approximately 400 mmvas Liu et al. (2011) Nasr (2020), Al-Abbasi,(2023). Well water irrigated plots exhibited relatively higher consumptive use (491.2–460.1 mm) because of its high salinity status (3.15 dS m-¹), which enhanced the leaching requirement by about 7.9%. The alternating irrigation (the application of salt water is following by river water) caused a significant reduction in the
Table 4: The amount of water saved and the additional areas that can be invested in for irrigation water of different quality
|
No. |
Quality of irrigation water |
Soil texture |
|||||
|
Sandy Loam |
Silty Clay |
Clay |
|||||
|
Saved water (m3ha-1) |
Additional area (ha) |
Saved water (m3ha-1) |
Additional area (ha) |
Saved water (m3ha-1) |
Additional area (ha) |
||
|
River |
nil |
0 |
0 |
0 |
0 |
٠ |
|
|
Well |
4507.3 |
1 |
4384 |
1 |
4678.55 |
1 |
|
|
Drainage |
4507.3 |
1 |
4384 |
1 |
4678.55 |
1 |
|
|
Drainage-river |
2253.65 |
0.5 |
2192 |
0.5 |
2298.175 |
0.5 |
|
|
Well-river |
2253.65 |
0.5 |
2192 |
0.5 |
2298.175 |
0.5 |
|
total quantity of applied water, 464.2–442.7 mm for drainage–river and 471.1–449.3 mm for well-river irrigations. Increased pressures for water conservation are causing this reduction in the root zone, thereby conserving more water, while maintaining good soil health for continued productivity.
The quantity of water saved and the additional spaces that can be invested
Table 4 illustrates the water savings and additional areas that can be cultivated under different irrigation water sources and soil textures. In sandy loam soils, water savings reached 0,4507.3 and 2253.65 m³ ha-¹ for river water, well/drainage water, and alternating irrigation (drainage–river or well–river) treatments, respectively. River Fresh water irrigation from river did not conserve any resources (100% fresh water). In comparison, well or drainage water irrigation saved 4507.3 m³ ha-¹ enough to irrigate one additional hectare of wheat or other crops. Alternate furrow irrigation saved 2253.65 m³ ha-¹ water that was sufficient to irrigate a half hectare of land and also kept soil salinity balanced through alternate saline and freshwater application. The successive practice of saline-freshwater use reduces salt accumulation, promotes soil structure change and this is in agreement with research findings (Zhou and Zhi Zhao 2019; Al-Mehmady 2011) that a system by which irrigation was alternated on saves 50-75% of freshwater to increase cultivated area or support intolerant crops.
Actual Consumptive use (Actual Evapotranspiration) (ETa)
Figure 2 shows the monthly estimated water consumption (ETa) of wheat in three soil textures. Water use differed depending on stage of growth, soil and climate: In December consumption was 44mm, 42 mm, and 40 mm for clay, sandy loam and silty clays respectively. Values for January rose to 49.5, 49 and 48 mm suggesting better vegetative growth. In February consumption rose again to 77, 70 as well as 64 mm. In Mar 105, 99 and 96 mm were peak consumptions which contributed to about 31–32% of total seasonal use (329–335.5 mm). This peak demand was associated with ear formation and flowering, where increased leaf area (LA), greater root depth at 30–60 cm, and higher transpiration rates were the contributing factors. Late April (maturity): Water use declined to 72, 66, and 63 mm as physiological activity slowed during grain filling and final irrigation (weaning stage). Overall, water consumption rose with crop growth, peaking in March before decreasing at maturity. These results align with previous studies (Al-Shamary et al., 2021; Al-Aridhee, 2022; Al-Abbasi, 2023) showing evapotranspiration is highest at flowering and decreases as vegetative activity declines.
Crop coefficient (Kc):
Previous studies proposed Kc values of 0.8, 1.2, 1.0, and 0.5 for germination, elongation, heading, and maturity. However, field measurements for the 2024
season yielded new monthly Kc values of 0.78, 0.79, 1.12, 0.96, and 0.46 for December–April, averaged across soil types (Figure 4). By soil texture, Kc values were: Sandy loam: 0.78, 0.80, 1.12, 1.01, 0.44 Silty clay: 0.74, 0.78, 1.02, 0.92, 0.50 Clay: 0.82, 0.81, 1.23, 0.95. Kc increased progressively until flowering, then declined as water requirements decreased as water requirements decreased. Lower Kc values in silty clay soils reflected reduced water consumption compared to sandy loam and clay soils.
Table 5 shows that irrigation water quality significantly affected wheat yield across soil textures. The highest yield was obtained with river water (5.88 Mg ha-¹), while the lowest was recorded under well water irrigation (2.56 Mg ha-¹), representing a 56.5% reduction.
This decline is attributed to high salinity levels (3.15 dS m-¹) in well water, causing osmotic stress, ionic toxicity (notably from sodium ions, 10.5 meq L-¹), and nutrient imbalances due to reduced calcium and potassium uptake. Collectively, these property leads to suppression of root growth, water intake and planting physiological process including photosynthesis that results in low seed yield (Hussain et al., 2019; Dahham et al., 2025).
Table 5: Effect of management method of different types of irrigation water on total wheat yield (mg ha-1) for three different soil types
|
Quality of irrigation water |
Soil texture |
Average of water quality |
||
|
Sandy loam |
Silty clay |
Clay |
||
|
River |
٦.٢١A |
٥.٤٥ B |
٦.٠٠ A |
٥.٨٨ A |
|
Well |
٢.٨٠GH |
٢.٢٠ I |
٢.٧٠ H |
2.56 E |
|
Drainage |
٣.٧٣F |
3.00GH |
٣.٢٠ G |
3.31 D |
|
Well – Drainage |
٤.٤٤ED |
٣.٨٥ F |
٤.١٠ EF |
٤.١٣ C |
|
Drainage - River |
٥.٠ C |
4.63CD |
4.8 CD |
4.81 B |
|
Average of soil textures |
٤.٤٣ A |
٣.٨٢ C |
٤.١٦ B |
|
The alternate irrigation strategy could effectively mitigate the adverse influence of salinity on wheat productivity. The grain yields under the drainage–river and well–river treatments were 4.81 Mg ha-1 and 4.13 Mg ha-1, which were respectively 87.9% and 61.3%, higher than its corresponding treatment with irrigation by well water alone. The alternating applications of river water reduced salt accumulation in the root zone and leaching was a good control option to dispose of salinity, similarly that reported by Alshamary et al. (2021) and Soothar et al. (2019). The yield was also significantly influenced by soil texture; the sandy loam recorded highest yield which was 4.43 Mg ha-¹ and superior to silty loam in 15.96%. This increase is mainly due to more effective leaching, a beneficial variation of the soil structure in addition to a larger root system under sandy loam soils and eventually better water and nutrient use potential (Zhao et al., 2019; Almashhadani et al., 2026).
Efficiency of field water use (kg m-3)
Table 6 reveals that the wheat water use efficiency (WUE) values differed substantially in relation to soil texture by irrigation water quality. Water and nutrient use efficiency Water–nutrient use efficiency was found to be maximum in river water irrigation (1.30 kg m-³), which was higher by 140.7%, 83.1%, 46.1% and 23.8% over well water, drainage water, well–river, and drainage–river treatments respectively. On alternating irrigation, the WUE increases compared with saline water alone: river treatments reached values of 1.05 kg m-³ and 0.89 kg m-³, respectively versus that of 0.71kg/m-³(drainage) and of 0.54 kg/m-³(well water). The enhancement is attributed to the lowering of salt levels in in the root zone, decreasing osmotic stress and increasing water uptake and plant productivity. Soil texture also influenced WUE: sandy loam soils achieved a 9% greater value at 0.96 kg m-³, compared to clay soils (0.88 kg m-³) due to improved leaching efficiency and soil structure promoting salt removal and water
Table 6: Effect of management method of different types of irrigation water on field water use efficiency (kg m-3) for three different types of soils
|
Irrigation water quality |
Soil texture |
Average of soil quality |
||
|
Sandy loam |
Silty clay |
Clay |
||
|
River |
1.38 A |
1.24 B |
1.28 B |
1.30 A |
|
Well |
0.59 GH |
0.47 I |
0.55 IH |
0.54 E |
|
Drainage |
0.81 F |
0.67 G |
0.67 G |
0.71 D |
|
well – river |
0.95 ED |
0.85 F |
0.87 EF |
0.89 C |
|
drainage –river |
1.09 C |
1.04 CD |
1.03 CD |
1.05 B |
|
Average of soil textures |
0.96 A |
0.85 B |
0.88 B |
|
Productivity or profitability of irrigation water (ID m-3)
Results in Table 7 demonstrate that river irrigation provided the greatest economic returns per m³ (847.53 ID m-³) followed by drainage–river alternating (714.72 ID m-³). The above were substantially higher than when the one sources of water well water and drainage water were used (432.20 interdecile m-³, 574.18 interdecile m-³) respectively which indicated a clear economic benefit to mixed use of integrated management irrigation to irrigated production fields. This improvement is associated with saved water of alternate irrigation treatments (Table 4). For example, in clay soils alternating would put 2298.175 m³ ha-¹ in the field which is enough to irrigate.5 hectares more per hectare; and drainage or well alone could be stretched by new irrigation area of 1 hectare. These expansions make a difference particularly much in the macroscopic scale. When determining the increased yield of these enlarged areas, it will be 2405 kg ha-¹ and 2065 kg ha-¹ for drainage–river and well–river treatments, respectively. Multiplying these factors with the original hectare finally results in total yields of 7215 and 6195 kg ha-¹, respectively, both exceeding the river water irrigated yield (5880 kg ha-¹) but without an increased amount of water used for irrigation (Figure 1). These results support those reported by Abraheem (2017) which emphasized the possibility of better yield intensification obtained under water–saving irrigation approaches. Soil texture was an important factor in determining the profitability of irrigation water. Sandy loam soils had the highest, 773.33 ID m-³, while silty clay soils showed the lowest value of 687.24 ID m-³. This difference may be attributed to pore size distribution of sandy loam soils was generally larger and more heterogeneous than that of silt loam soils, in which the large pores would generate high leaching efficiency induced salt movement out of the root zone, thereby providing a more favorable condition for root growth and nutrient uptake. Notably, Gelaye et al. (2019) found that clay and silty clay soils did not yield notably different results, indicating (pore structure-dependent) textural effects may have a large influence irrespective of soil group.
Table 7: Effect of management method of different types of irrigation water on water productivity (id m-3) for three different types of soils
|
Irrigation water quality |
Soil texture |
Average of water quality |
||
|
Sandy loam |
Silty clay |
Clay |
||
|
River |
1102.21 A |
994.53 B |
1025.97 B |
1040.90 A |
|
Well |
474.31 GH |
382.51 I |
439.78HI |
432.20 E |
|
Drainage |
649.13 F |
536.90G |
536.50 G |
574.18 D |
|
well – river |
762.30 DE |
685.57 F |
696.27EF |
714.72 C |
|
drainage – river |
878.72 C |
836.67 CD |
827.21CD |
847.53 B |
|
Average of soil textures |
773.33 A |
687.24 B |
705.15 B |
|
Relative yield (%)
As shown in Figure 5, Percentage wheat Relative yield in different quality of irrigation water and soil texture:The percentage relative Wheat yield has significantly been varied with Quality Irrigation water and Soil texture.TABLE –1: Growth parameters of wheat crop under various treatments. On river waterirrigation, relative yields were 100%, 97.9% and 96% for sandy loam, clay and silty clay soils respectively. In
comparison, the lowest yields were in well irrigation with relative yields reduced to 69%, 66%, and 63% that were decreased by 44.9 %,49.4% and45653 other than river water irrigation, respectively. The decrease is mainly due to adverse physiological effects of saline irrigation water. The high osmotic potential and ionic imbalance limited water uptake and enzyme activity, which ended up in growth suppression (El Sabagh et al., 2021). However, relative yield was increased by the alternate irrigation treatments. Consecutive drainage–river and well–river water applications led to relative yields of 94%, 94%, and 91% and 84%, 81%, and 79% for sandy loam, clay, and silty clay soils, respectively. These gains clearly reflect the effectiveness of alternate drip-irrigation in leaching soil salinity, decreasing osmotic stress and enhancing water and nutrient absorption. Moreover, beneficial nutrients like calcium and potassium in well water influenced plant metabolism and yield development (Devkota et al., 2022; Hamid, 2026).
Conclusions and Recommendations
The findings of this study that the application of drainage or well water alone as irrigation may supply enough resources to support plantings on maize grown for approximately one additional year (1 ha wheat or other crops) and that prolonged use might lead to increased soil salinity, development of impermeable layers in some spots, degraded soil structure, and worse water infiltration/leakage problems related to drainage flow management. In addition, extending intermittent irrigation with well–river or drainage–river water irrigated effectively up to 0.5 ha and enhanced the wheat yield per unit water applied when compared with the tradition river-water method of irrigation. Moreover, the research defined new crop coefficient (Kc) values according to regional climatic characteristics in which Kc over December–April, for three textured soils, were 0.78, 0.79, 1.12, 0.96 and 0.40 respectively on average basis. AL was found to be more effective in the improvement of grain yield, field water use efficiency and economic water productivity compared with saline SGSIMs. This strategy was an efficient way to mitigate the reductions in relative yield usually induced by saline irrigation and consequently achievement of sustainable water management with plant production in arid regions. future research is recommended to evaluate the long-term effects of alternating irrigation practices over multiple cropping seasons and to test their applicability for other strategic crops under similar arid conditions.
Novelty Statement
This study is one of the first in Iraq to assess alternating irrigation with improvised water resources at different soil textures and arid conditions. These results show the potential of DS to improve wheat yield, water use efficiency and economic return while saving freshwater resources.
Author’s Contribution
All authors contributed equally to the design, implementation, analysis, and preparation of this study.
Generative AI and AI-assisted technology statement
The authors declare that no generative AI and AI assisted technology was used in the creation of this manuscript.
Conflict of interest
The authors have declared no conflict of interest.
Figures


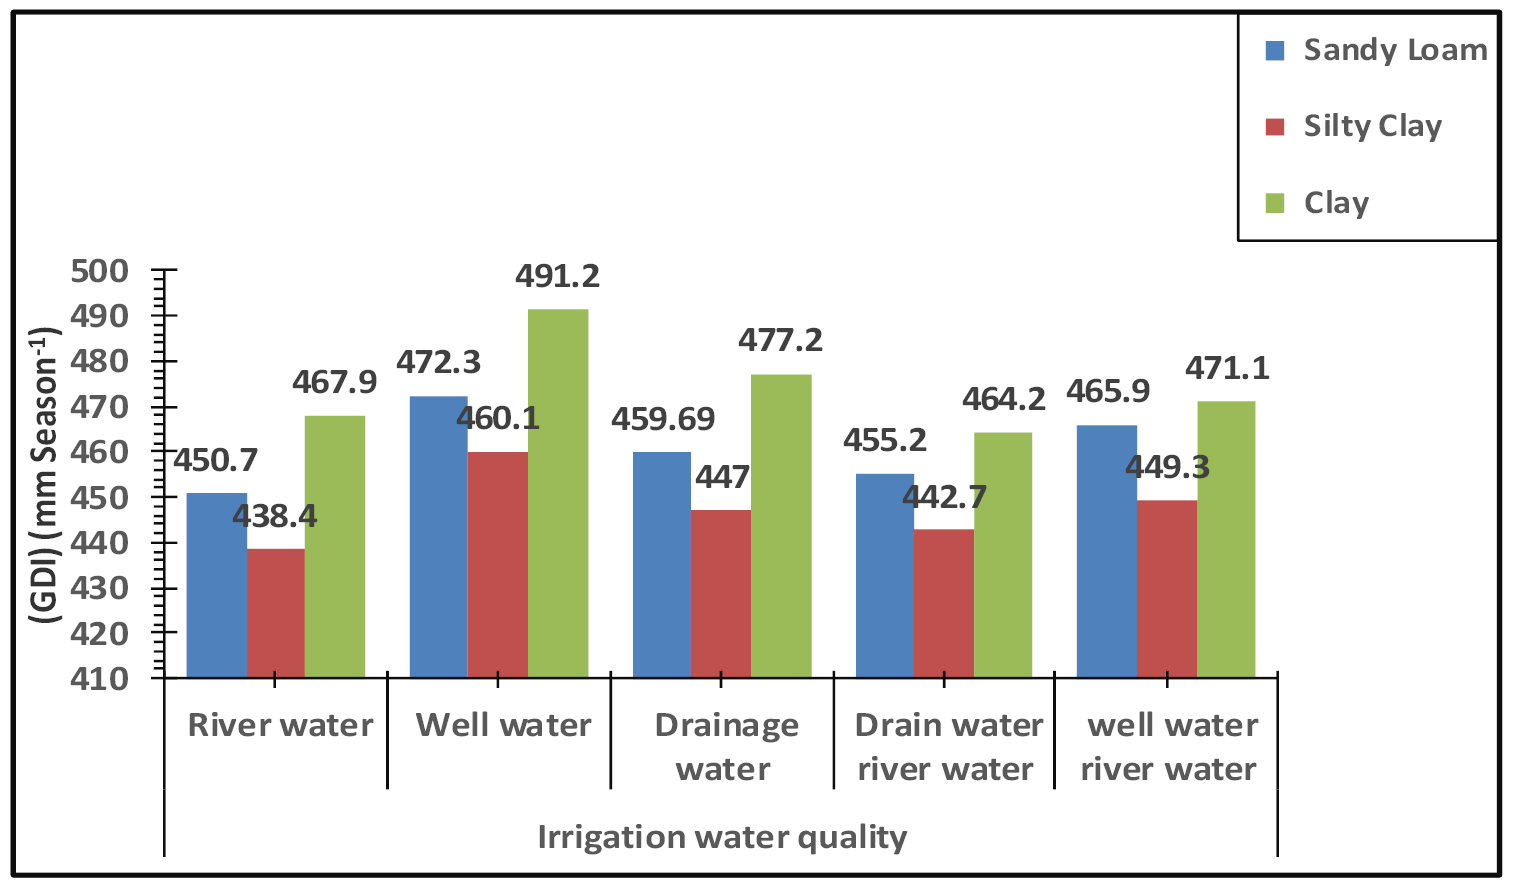
Total Depth of Irrigation (TDI) (mm season-1) for different types of irrigation water and for three different soil textures
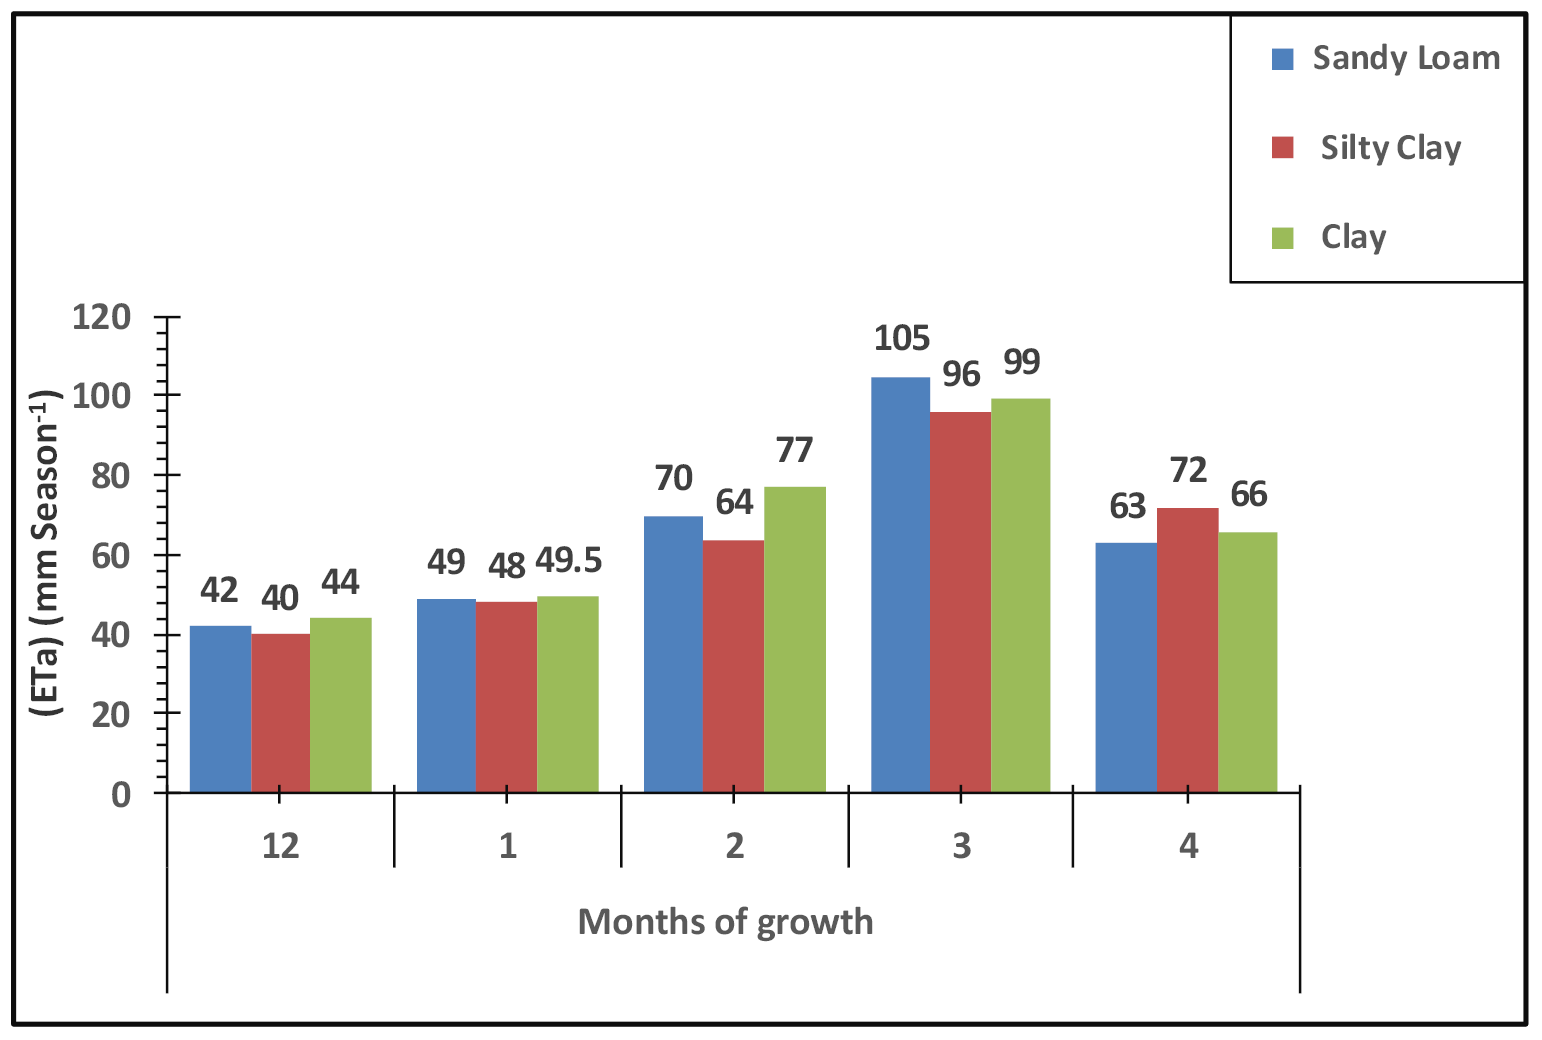
Actual water consumption ETa (mm month-1) for the growing months of the wheat crop for three different soil tissues
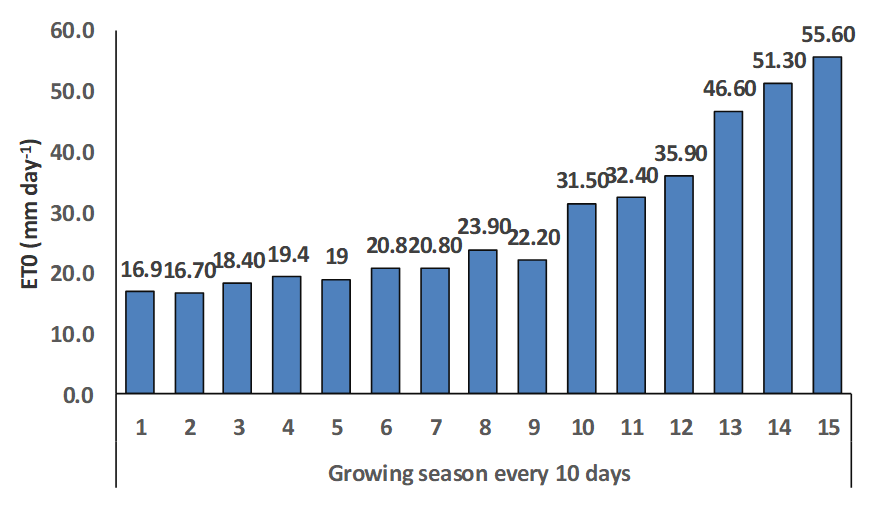
Reference water consumption (mm day-1) of wheat crop during the growing season
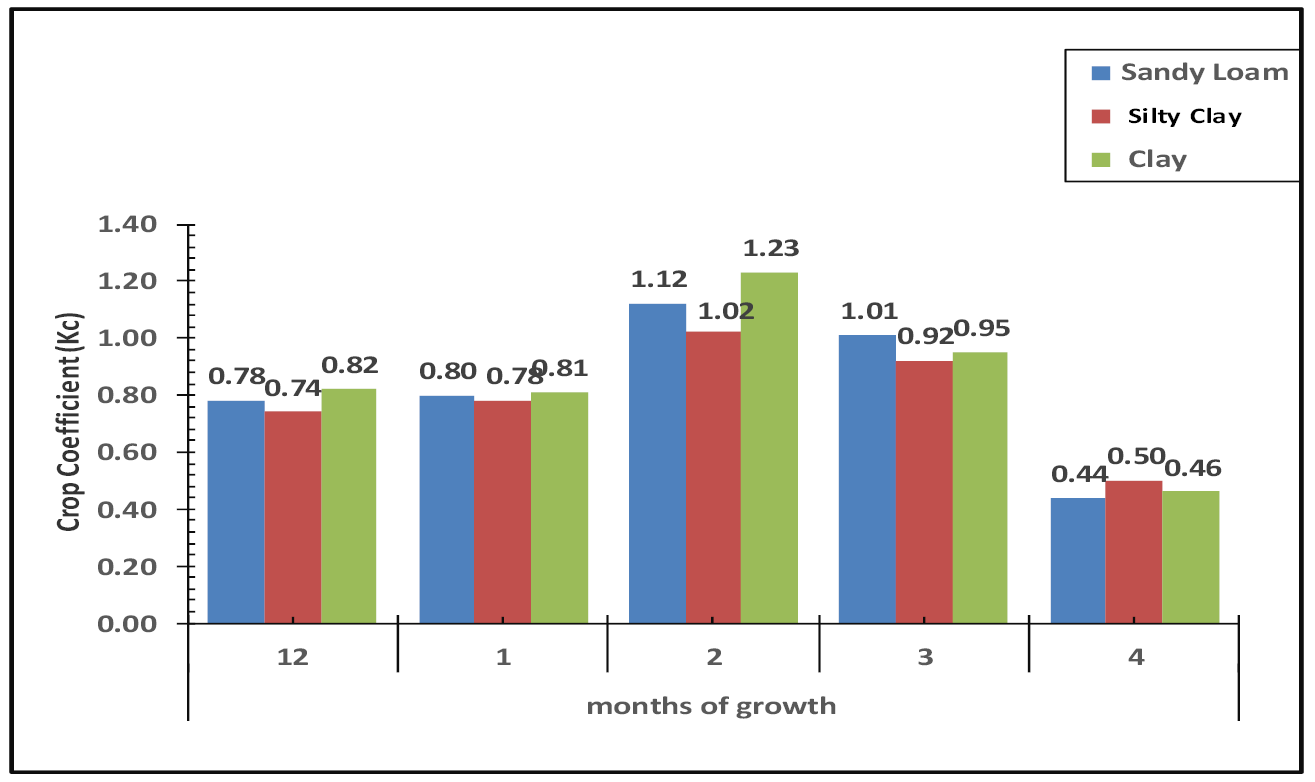
Crop coefficients according to the months of growth of wheat crop for three different soil textures
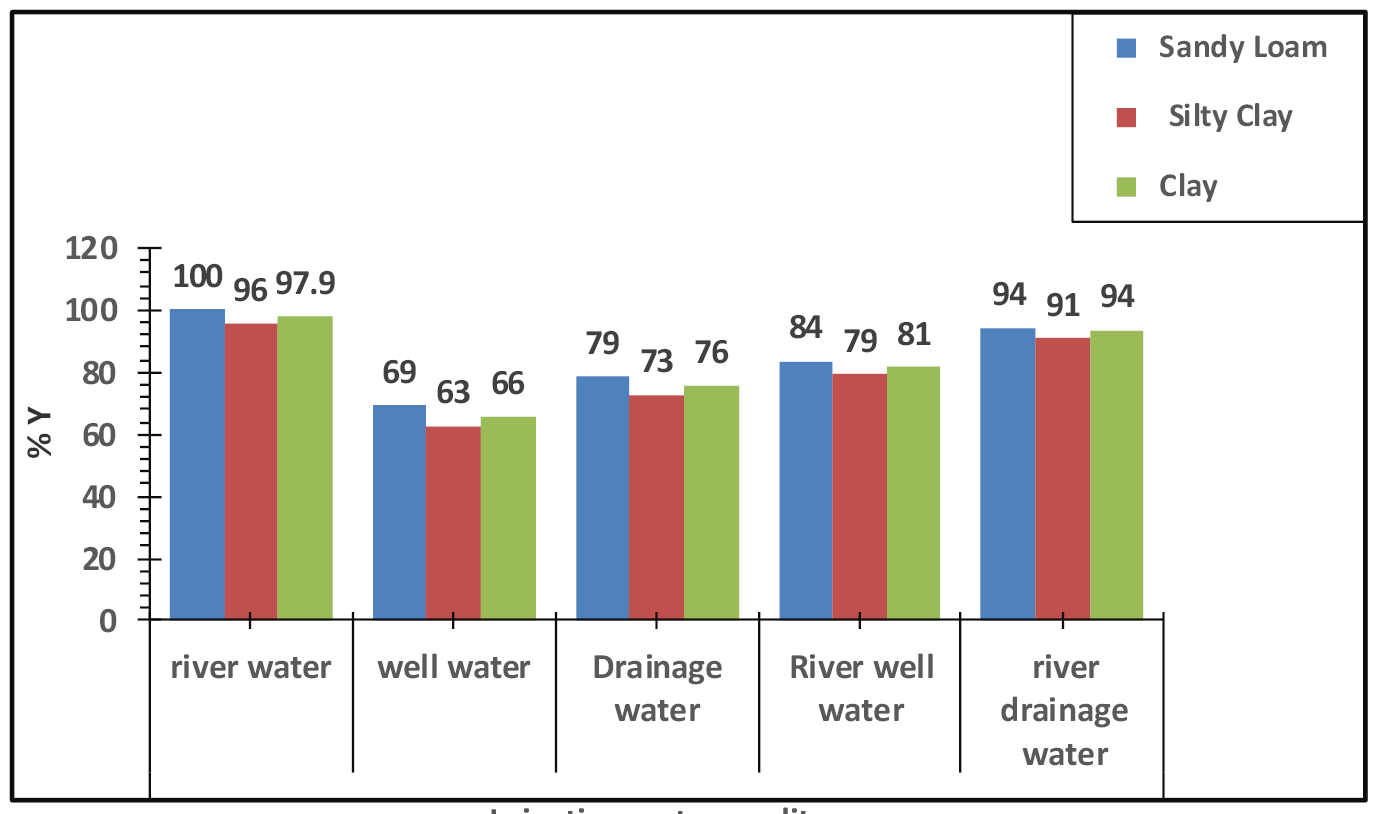
Percentage of relative yield (Y) by Experiment treatments
References
- Reference evapotranspiration (ET₀) was estimated based on the climatic conditions prevailing in the study area. Meteorological data corresponding to the experimental period (2023–2024) were obtained from the Meteorological Department of the Ministry of Agriculture. The estimation of ET₀ was conducted using the modified Penman–Monteith equation as recommended by the Food and Agriculture Organization (FAO) (Allen et al., 1998a).
- ET₀= Crop reference evapotranspiration (mm day-1).
- Rn = Net radiation at crop surface (MJ m-2 day-1).
- G = daily air heat flow at an altitude of 2 ⸰C (⸰C).
- U2= Wind speed measured at a height of 2 m (m s-1).
- ea= Saturated vapour pressure (kPa).
- γ= Psychometric constant (kPa ⸰C).
- The variables in the above equation were calculated using Cropwat computer program (Clarke et al., 2001) and then the value of ET0 was calculated and expressed in units (mm-day-1) according to the crop factor for plant growth stages.
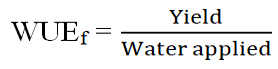
- The final irrigation, commonly referred to as weaning irrigation, was administered on 28 April 2023, and harvesting was carried out on 18 May 2024. Grain yield was determined by calculating the average yield per plant within each anvil, which was subsequently converted to kilograms per hectare by multiplying the mean anvil yield by the plant density. Field Water Use Efficiency (FWUE) was then computed using the equation proposed by Hasanuzzaman (2019).
- WUEf = = Field water use efficiency (kg m-3)
- Yield = Total yield (kg ha-1).
- Water applied = Volume of water added during the season (m3 ha-1).
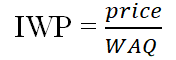
- The productivity of irrigation water (IWP), expressed in Iraqi Dinars per cubic metre (ID m-³), was calculated using the following equation, which quantifies the economic return per unit of irrigation water applied:
- IWP = irrigation water productivity (ID m-3).
- WAQ = Water applied quantity (m3 ha-1).
- A grain price of 800 Iraqi Dinars per kilogram (ID kg-¹) was adopted for the analysis, as officially quoted by the Iraqi Ministry of Agriculture. To calculate the area that can be invested (AI) from water savings, the following relationship can be applied (Masood, 2015):
- AI = the area that can be invested (ha).
- AWS = amount of water saved (m3 ha-1).
- WAQ = Water applied quantity (m3 ha-1).
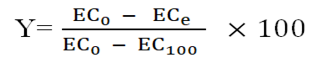
- The relative yield values of Y were calculated using the following statistical equation:
- EC0 = the electrical conductivity value of the extract of the saturated paste of the root layer at which the relative yield is equal to zero and equal to (20) (Al-Zubaidi, 1989).
- ECe = the value of the electrical conductivity of saturated soil paste.
- EC100 = salinity Impact threshold Value – i.e. the relative yield at this value of electrical conductivity is equal to 100 and 6 for wheat crop (Al-Zubaidi, 1989).
- Statistical analysis of the data was performed in accordance with the experimental design using SAS 2000 software. Treatment means were compared using Duncan’s polynomial test at a significance level of 0.05.
Services
Article usage statistics
Loading…