Research Article · Volume 14, Issue 10, 18 September 2026 · Open Access
Identification and Genetic Analysis of FABP4 Gene Variation in IPB D1 Chickens
· · · · ·
Affiliations & Notes ⌄
1Graduate School. Department of Animal Production and Technology, IPB University, Bogor, 16680, Indonesia
2Department of Animal Science, Faculty of Agriculture, University of BengkuluKandang Limun, Bengkulu, 38371A, Indonesia
3Department of Animal Production and Technology, Faculty of Animal Science, IPB University, Bogor, 16680, Indonesia
4Department of Nutrition and Feed Technology, Faculty of Animal Science, IPB University, Bogor, 16680, Indonesia
5Research Center for Applied Zoologi, National Research and Innovation Agency (BRIN) Jl. Raya Jakarta-Bogor, Cibinong, Bogor, 1691, Indonesia. *Correspondence | Cece Sumantri, Department of Animal Production and Technology, Faculty of Animal Science, IPB University, Bogor, 16680, Indonesia, Email: ceces@apps.ipb.ac.id
A total of 10 SNPs were identified in the FABP4 gene, distributed across intron 2, exon 3, and intron 3.
One SNP, a missense mutation (g.121038074A>G), was identified that had the potential to alter the protein structure of FABP4.
This finding indicates the presence of genetic variation that may contribute to phenotypic variations.
Selected from the article's own text.
Abstract
FABP4 is involved in fatty acid metabolism in adipocytes and other related tissues. This study aimed to identify and analyze the genetic variation of the FABP4 gene in IPB D1 chickens using molecular techniques. A total of 140 IPB D1 chickens were used in the study from the IPB University Livestock Field Laboratory and UP3J. DNA sequencing is a DNA analysis test used to assess variation. The parameters used to measure FABP4 gene variation are genotype frequency, allele frequency, observed heterozygosity (Ho), expected heterozygosity (He), and Hardy-Weinberg equilibrium (HWE). The results showed 10 Single Nucleotide Polymorphisms (SNPs) in the FABP4 gene, distributed across intron 2 (g.121038256A>G, g.121038154C>T, g.121038136A>C, g.121038101A>T), exon 3 (g.121038074A>G, g.121038058G>A, g.121038019G>A), and intron 3 (g.121037881T>C, g.121037861A>G, g.121037807) of the gene. Among these variants, one missense SNP (g.121038074A>G; Asn89Ser) was detected, resulting in an amino acid substitution from asparagine to serine, which may influence the FABP4 protein structure or lipid-binding function, potentially altering the protein structure of FABP4 in the exon. Based on genotype and allele frequencies, all identified FABP4 SNPs were polymorphic in the IPB D1 chickens maintained in the IPB University Livestock Field Laboratory. In contrast, several SNPs were monomorphic in IPB D1 in the UP3J, indicating lower genetic variation. Meanwhile, polymorphism was observed at g.121038154C>T, g.121038074A>G, g.121038019G>A, g.121037881T>C, and g.121037861A>G. Most SNP loci in the laboratory population are in HWE, with Ho (0.121–0.556) and He values (0.114–0.483). In contrast, the UP3J population showed significant deviation from HWE, with Ho (0.000–0.683) that tended to be higher than He values (0.000–0.500). In conclusion, the FABP4 gene is polymorphic and therefore has potential as a selection marker in IPB D1 chickens.
FABP4, a fatty acid-binding protein (FABP) family member, is involved in fatty acid metabolism in adipocytes and related tissues. In chickens, FABP4 serves as a candidate gene for abdominal fat accumulation and fatness phenotypes in broiler and other chicken lines ; Abdalla et al., 2018). The impact of FABP4 genetic variation on fat traits can be assessed by single-nucleotide polymorphism (SNP) genotypes, allele frequencies, and population measures, revealing genetic contributions to phenotypic variation. Studies have also examined FABP4’s ligand-binding affinity and protein isoform changes associated with fat phenotypes, suggesting that FABP4 SNPs likely alter protein function and influence fat accumulation . Despite these findings, previous studies have mainly focused on commercial broiler chickens, and information on the genetic variation and population genetic characteristics of FABP4 in newly developed Indonesian chicken breeds is scarce.
The IPB D1 chicken is a new, high-performance local breed officially recognized by the Indonesian Ministry of Agriculture (Decree No. 693/KPTS/PK.230/M/9/2019). It was developed by crossing F1 (Pelung × Sentul) and F1 female (Kampung × Cobb Broiler Parent Stock), each contributing 25% of the genetic makeup, resulting in 75% local chicken and 25% commercial broiler . This unique genetic background enables IPB D1 chickens to combine the adaptability, disease resistance, and desirable meat characteristics of indigenous chickens with the superior growth performance of commercial broilers. Consequently, IPB D1 chickens represent an important genetic resource for sustainable poultry production and genetic improvement programs in Indonesia. To provide a more comprehensive assessment of FABP4 genetic variation, this study evaluated two populations of IPB D1 chickens reared under different management systems. The first population was reared at the IPB University experimental farm under a controlled intensive management system, whereas the second population originated from the UP3J breeding station, where the IPB D1 chickens were reared under different breeding and management conditions. A comparison between these two populations allows for an evaluation of whether FABP4 genetic variation and population genetic characteristics are consistently maintained across the entire IPB D1 population and provides valuable information for future conservation and breeding programs. Previous studies on the molecular genetics of IPB D1 chickens have identified prolactin (PRL) gene polymorphisms associated with increased egg production . Genetic markers in CD1B and AvBD2 genes support selective breeding for disease resistance ; .
Despite this progress, research on the genetic variation of FABP4 in IPB D1 chickens remains limited. In particular, no comprehensive study has characterized the genetic variation in the FABP4 gene in IPB D1 chickens. Furthermore, information regarding SNP distribution, genotype and allele frequencies, genetic variation indices, and Hardy–Weinberg equilibrium in this population is unavailable. This lack of information limits the use of FABP4 as a potential molecular marker in the IPB D1 breeding program. Therefore, characterizing genetic variation in the FABP4 gene is an essential first step toward identifying informative polymorphisms to support marker-assisted selection and the future genetic improvement of IPB D1 chickens.
Accordingly, this study evaluated the genetic variation and population genetic characteristics of the FABP4 gene in IPB D1 chickens using DNA sequencing and population genetic analyses. The findings provide baseline information on FABP4 sequence variation and population genetic characteristics that may support the identification of molecular markers for future marker-assisted selection and genetic improvement of IPB D1 chickens.
Materials and Methods
Animal and ethical statement
A total of 140 IPB D1 chickens were used in this study. Ninety-nine IPB D1 chickens were obtained from the IPB University Livestock Field Laboratory under a closed-house management system, and forty-one were from the IPB D1 chicken sample at the the Jonggol Animal Science Teaching and Research Unit (Unit Pendidikan dan Penelitian Peternakan Jonggol/UP3J) under a free-range management system, representing different breeding and management environments. Therefore, the analysis of these two populations allowed for the validation of genotype distribution and allele frequencies across all populations. This approach strengthens the reliability of the identified SNPs and enhances the relevance of the research results for future IPB D1 chicken genetic improvement programs. Both male and female chickens were included in this study, and sex was not considered an experimental factor. The animal experiments conducted in this study adhered to established ethical standards and received approval from the University of Bengkulu Research Ethics Committee (approval no. 73/KER/LPPM/EC/2024).
DNA extraction and genotyping
To extract DNA and perform genotyping, the Wizard Genomic DNA Purification Kit (Promega Corporation, Madison, WI, USA) was used to isolate DNA from fresh whole blood samples from chickens, following the manufacturer’s guidelines. In a 1.5 mL microtube, 200 μL of Cell Lysis Solution was mixed with 300 μL of blood, which had been previously diluted in a 1:5 (v/v) ratio with 1× PBS. The mixture was gently mixed by inversion five or six times until it became uniform, then left to incubate at room temperature for 10 minutes with occasional stirring. The samples were then centrifuged for 20 seconds at 16,000 rpm, and the supernatant was discarded. The white blood cell pellet was carefully resuspended in 300 μL of Nucleic Lysis Solution. After incubating at 37°C for 15 minutes until the lysate was clear, 1.5 μL of RNase Solution was added. The tube was gently mixed, maintained at 37°C for another 15 minutes, and then allowed to cool to room temperature.
To isolate the protein, 100 μL of precipitation solution was added, followed by a brief 10-second vortex mix, and then the mixture was centrifuged at 15,000 rpm for 3 minutes. For DNA extraction, the supernatant was moved to a fresh tube with 300 μL of isopropanol, gently mixed until strands became visible, and then centrifuged at 16,000 rpm for 1 minute. The DNA pellet was then washed with 300 μL of 70% ethanol and left to air-dry at room temperature. The dried pellet was rehydrated in 100 μL of DNA Rehydration Solution and incubated at 65°C for 1 hour with occasional mixing. The extracted DNA was stored at 4°C until required.
Polymerase chain reaction
The Polymerase Chain Reaction (PCR) reaction mixtures included 1 μL of DNA template, 0.35–0.4 μL of primers, 0.3 μL of dNTP mix, 1 μL of 25 mM MgCl₂, 1.5 μL of 10× buffer, and 0.15 μL of Taq polymerase, with the total volume adjusted to 50 μL using nuclease-free water. Primers were designed for the FABP4 gene, referencing the nucleotide sequence with accession number ENSGALG00010002655. Primers were manually designed using MEGA software and subsequently evaluated using PrimerStats to assess their physical properties and in silico quality, including melting temperature (Tm), GC content, and potential secondary structures before PCR amplification. The primers were oriented as follows: forward 5′-GGGTAGTGGTAAACCATCAG-3′ and reverse 5′-GGATGAGGATAGCATACCTACG-3′, resulting in a 641 bp fragment. The thermal cycling conditions were: an initial denaturation at 94°C for 5 minutes, followed by 35 cycles of 94°C for 10 seconds, 53°C for 20 seconds (annealing), and 72°C for 30 seconds (extension), concluding with a final extension at 72°C for 10 minutes. The annealing temperature (53°C) was selected based on preliminary PCR optimization (gradient PCR). The calculated melting temperatures (Tm) of the forward and reverse primers were approximately 56°C and 58°C, respectively, indicating that 53°C was within the appropriate annealing range and that this temperature produced specific amplification of the 641-bp FABP4 fragment. After electrophoresis on a 2.5% agarose gel, the PCR products were visualized using a UV illuminator.
Genotyping of the FABP4 gene
DNA sequencing using a sequencer machine (ABI Prims 3100-Avant Genetic Analyzer) on the forward and reverse primer fragments through the 1st Base sequencing services company in Selangor, Malaysia.
Data analysis
Sequence chromatograms were edited and analyzed using BioEdit software to evaluate sequence quality, perform nucleotide base correction, and detect single nucleotide polymorphisms (SNPs). The obtained sequences were subsequently aligned with the reference sequence in MEGA to identify polymorphic sites and characterize genetic variation within the studied chicken population.
Equation (1). Genotype Frequency
Figure 5.
Where: Xii = genotype frequency; Xi = number of individuals with genotype ii; N = total number of individuals analyzed.
Equation (2). Allele Frequency
Figure 2.
Where: Xi = frequency of allele i; nij = number of homozygous individuals (ii); nij = number of heterozygous individuals (ij); N = total number of individuals.
The polymorphism status of each SNP was determined based on the allele frequencies. Loci with a major allele frequency greater than 0.99 were classified as monomorphic, whereas loci with a major allele frequency of 0.99 or less were considered polymorphic.
Equation (3). Observed Heterozigosity
Figure 3.
Where : Ho = observed heterozygosity; nij = number of heterozygous individuals; = total number of individuals.
Equation (4). Expected Heterozigosity
Figure 4.
He = expected heterozygosity; χ i2 = the frequency of allele i; q = the total of allele.
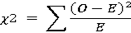
Equation (T). Hardy-weinberg Equilibrium
Figure 1.
Where: χ2 = the Hardy-weinberg proportion; O = the observed frequency of Genotype and; E = the expected frequency of genotype.
Hardy–Weinberg equilibrium was evaluated using the chi-square (χ²) test with 1 degree of freedom (df = 1) at a significance level of α = 0.05.
Genotype frequency was calculated using Equation (1), and allele frequency was estimated using Equation (2). The observed and expected heterozygosities were calculated using Equations (3) and (4), respectively. The Hardy–Weinberg equilibrium was evaluated using the chi-square test (Equation (5))
Results and Discussion
Amplification of the FABP4
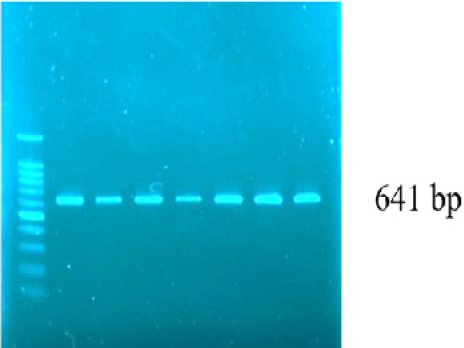
Amplification of the FABP4 gene produced a 641-bp DNA fragment, as shown in Figure 1. The amplified fragment includes intron 2, exon 3, and intron 3. The presence of a clear and specific DNA band of that size indicates that the primers successfully amplified the target region of the FABP4 gene at the expected size. Furthermore, the uniformity of the bands across all samples indicated that the quality of the genomic DNA and PCR conditions used were adequate, making the amplification products suitable for sequence analysis and SNPs identification in the FABP4 gene.
Identification of SNPs and sequence alignment in the FABP4 gene
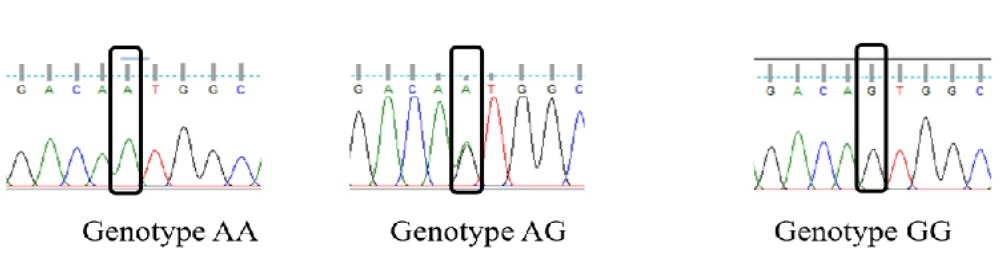
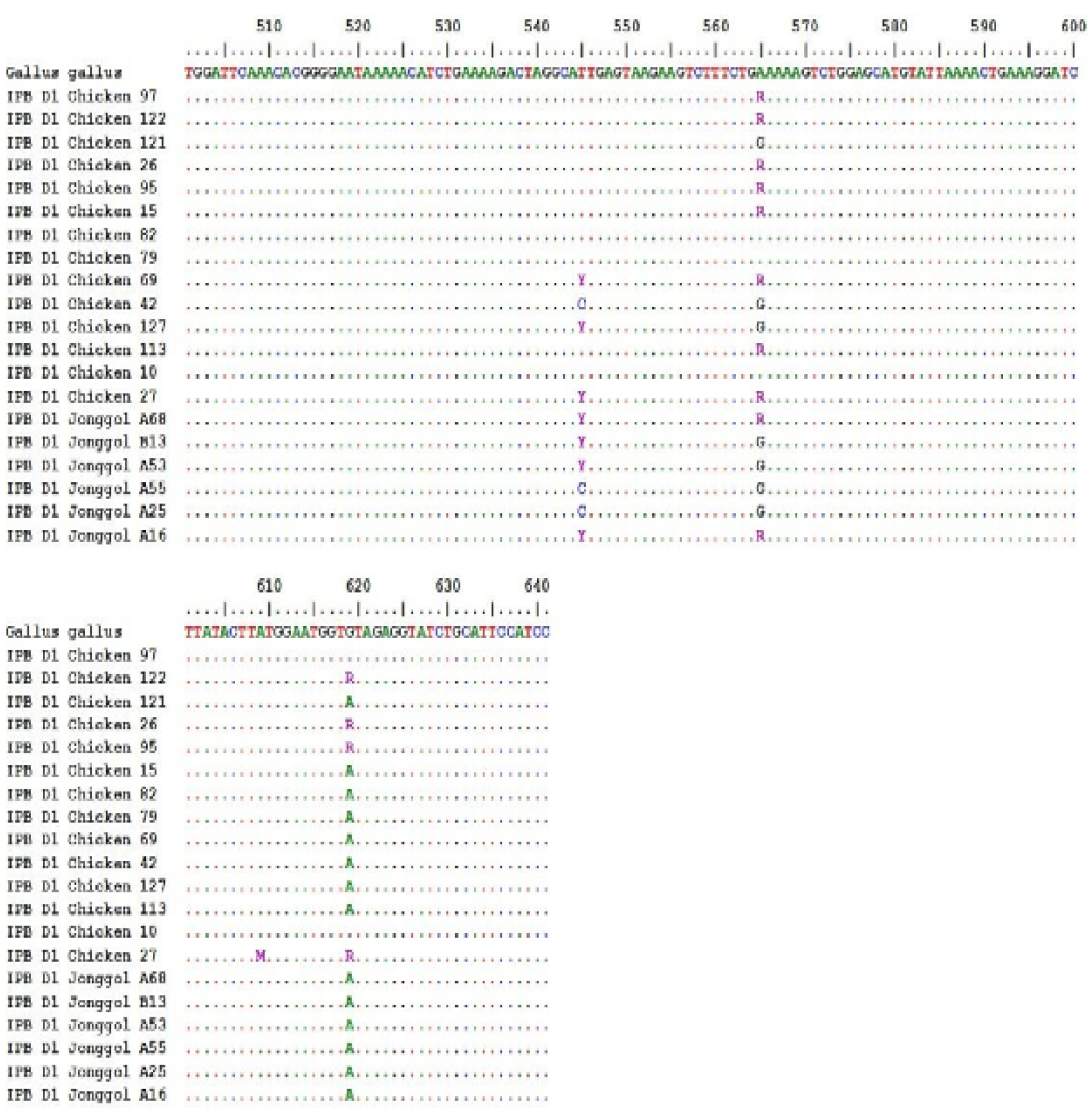
The base changes in the DNA sequence, based on the sequencing analysis results, are presented in Figure 2. Multiple sequence alignments of the FABP4 gene fragments were performed using all 140 samples. For clarity and readability, Figure 3 presents representative aligned sequences that highlight the identified SNP loci. These results show nucleotide variation in the observed FABP4 gene region, indicating the presence of Single Nucleotide Polymorphisms (SNPs) in the IPB D1 chicken population. Among the identified variants, most SNPs were located in intronic regions, whereas three SNPs were identified in exon 3 of FABP4. The results showed 10 Single Nucleotide Polymorphisms (SNPs) in the FABP4 gene, distributed across intron 2 (g.121038256A>G, g.121038154C>T, g.121038136A>C, g.121038101A>T), exon 3 (g.121038074A>G, g.121038058G>A, g.121038019G>A), and intron 3 (g.121037881T>C, g.121037861A>G, g.121037807). This distinction is important because intronic SNPs are generally less likely to directly alter protein structure. In contrast, exonic SNPs may affect protein function, depending on whether they are synonymous or nonsynonymous variants. The base differences detected by sequencing analysis and confirmed by the alignment results indicate genetic variation at the loci studied. This variation may serve as a source of genetic variation that could potentially influence gene expression or specific phenotypic traits, particularly those related to lipid metabolism and meat quality.
The SNPs identified in the FABP4 gene of IPB D1 chickens in the present study indicates molecular genetic variation within this population. This finding suggests that the FABP4 gene is polymorphic in IPB D1 chickens. Similar observations were reported by Wang et al. (2009), who identified a G>A polymorphism in the chicken FABP4 exon 3 gene in Chinese Baier and Broiler chickens. Zhang et al. (2020) reported that genetic variation in FABP4 has been detected in various species and is associated with lipid metabolism and fat-related phenotypic traits.
Multiple sequence alignment was performed using all 140 samples to identify SNP loci; only representative aligned sequences are presented to improve the figure’s readability.
SNPs of the FABP4 gene
In this study, 10 Single Nucleotide Polymorphisms (SNPs) were identified in the FABP4 gene of IPB D1 chickens, specifically in intron 2, intron 3, and exon 3 (Table 1). Of the 10 SNPs detected, 3 were located in exon 3, and the other were in introns 2 and 3. The observed variations comprised of transitions and transversions (A to G, C to T, A to C, and T to C). The SNPs found in exon 3 have the potential to change codons: AAT/AGT (asparagine to serine codon), CAG/CAA (glutamine codon), and AGG/AGA (arginine codon). However, due to ‘silent’ mutations, many codon changes do not result in amino acid changes. Most identified SNPs were located in intronic regions and were not expected to directly alter the amino acid sequence or primary structure of FABP4 protein. However, intronic variants may influence gene function by affecting pre-mRNA splicing and other regulatory mechanisms. In contrast, the nonsynonymous SNP identified in exon 3 resulted in an amino acid substitution that may affect the structural stability or functional properties of the FABP4 protein. However, its biological significance remains unclear and requires further functional validation.
The study results identified that the FABP4 gene in IPB D1 chickens had significant genetic variation from SNPs in intron 2, intron 3, and exon 3. SNPs in introns can affect RNA splicing, including alternative splicing, which may ultimately alter gene expression and produce proteins with different functions . SNPs located in the exon region can cause changes in protein structure and function by creating new start or stop codons (such as nonsense SNPs) or deleterious amino acid substitutions (for example, missense SNPs) . Among the identified variants, one missense SNP (g.121038074A>G; Asn89Ser) was detected in exon 3, resulting in an amino acid substitution from asparagine to serine. As FABP4 functions as an intracellular fatty acid-binding protein, this amino acid substitution may alter the ligand-binding properties and consequently influence intracellular fatty acid transport and lipid metabolism. Previous studies have shown that the Asn89Ser substitution affects the ligand-binding affinity of chicken FABP4, suggesting a potential role in fat deposition, although its biological significance in IPB D1 chickens remains to be experimentally validated . This interpretation is consistent with previous reports showing that polymorphisms in the FABP4 gene are associated with intramuscular fat deposition, fattening rate, and growth performance in livestock .
Several studies have suggested that mutations in the FABP4 gene exon, particularly those resulting in amino acid changes, may affect fatty acid binding capacity and be associated with phenotypic characteristics such as meat fat content and growth rate. Studies on Nigerian Fulani Ecotype Chickens identified the SNP c.266A>G in exon 3, which is recommended as a marker for studying growth and performance in chicken breeding programs . However, not all SNPs found in intronic regions significantly impact production traits, as reported in Jenoubi cattle, where intronic FABP4 variants were not strongly associated with milk quality traits. Nevertheless, such variations still provide added value for further genetic studies, such as haplotype association analysis and expression studies
Genotype and allele frequency of the FABP4 gene
The genotype frequency (Table 2) and allele frequency (Table 3) analysis results of the FABP4 gene in IPB D1 chickens show considerable genetic variation at several Single Nucleotide Polymorphisms (SNPs), both between the IPB D1 Livestock Field Laboratory and UP3J populations. At the SNP g.121038256A>G, the genotype distribution in IPB D1 was as follows: AA (0.02), AG (0.26), and GG (0.72). In contrast, the UP3J population presented only the GG genotype (1.00) is monomorphic. The same situation was found with SNP g.121038136A>C and SNP g.121038154A>T, where the minor alleles were virtually absent from the UP3J population, indicating fixation of some alleles. Allele frequency values also show the dominance of major alleles, such as the G allele (0.85) for SNP g.121038256A>G in IPB D1, and the G allele (1.00) for SNP g.121038256A>G in UP3J. The allele frequency was 1.00, indicating the absence of allelic variation at these sites and suggesting a reduced genetic variation within this breeding population. Such fixation may result from founder effects, genetic drift, directional selection, or long-term maintenance of a relatively closed population with a limited effective population size, leading to the loss of alternative alleles over generations. Although genetic uniformity may facilitate the stabilization of desirable production traits, it also reduces the genetic variability available for future selection and adaptive responses to environmental changes, potentially increasing the risk of inbreeding and limiting long-term breeding progress . Consequently, the monomorphic SNPs identified in the UP3J population have limited value for association studies and marker-assisted selection, highlighting the importance of conserving genetic variation in breeding populations.
Generally, the FABP4 gene in the IPB D1 chicken population from the laboratory IPB collection is polymorphic, while in IPB D1 UP3J, it is monomorphic. FABP4 genotype polymorphisms, such as g.121038154C>T, showed a more balanced distribution (CC, CT, TT), although one allele still dominated. Some SNPs, such as g.121038074A>G of
Table 1: SNPs of the FABP4 gene in the IPB D1 chicken.
and g.121038058T>C, also showed segregation different genotypes in both populations. These findings suggest differentiation or genetic variation between IPB D1 livestock field laboratotry and UP3J populations, and indicate some SNPs that have undergone genotype fixation in specific populations. Allendorf et al. (2022) stated that genotype and allele frequencies greater than 0.99 indicate that these SNPs are monomorphic.
Ho, He, and HWE on the FABP4 gene
Analysis of various Single Nucleotide Polymorphism (SNPs) positions in the genes of the IPB D1 livestock field laboratory and IPB D1 UP3J populations showed variation in observed heterozygosity (Ho) and expected heterozygosity values for each locus tested (Table 4). Heterozygosity values varied between the IPB D1 livestock field laboratory and IPB D1 UP3J populations, indicating differences in genetic variation among the FABP4 loci. The Ho values for IPB D1 chickens from the livestock field laboratory ranged from 0.121 to 0.556, while those for IPB D1 chickens from UP3J ranged from 0.000 to 0.683. The highest heterozygosity value in IPB D1 chickens was observed at SNP g.121038154C>T (Ho = 0.556), whereas in UP3J chickens it was observed at SNP g.121038058G>A (Ho = 0.683). Based on this classification, most SNPs in the FABP4 gene exhibited moderate to high genetic variation, particularly at loci g.121038154C>T, g.121038058G>A, g.121038019G>A, and g.121037881T>C. According to Nei and Kumar (2000), heterozygosity values are classified as follows: < 0.20 = low, 0.20–0.50 = moderate, and > 0.50 = high. These findings indicate that alleles at these loci remain genetically diverse and have not yet become fixed within populations. Moreover, the relatively high observed heterozygosity may also reflect population admixture resulting from the composite genetic background of IPB D1 chickens, which were developed from crosses between indigenous chickens (75%) and commercial broiler lines (25%) .
Table 4: Heterozygosity of the FABP4 gene in IPB D1 chickens.
Such admixtures can increase heterozygosity by combining alleles from genetically differentiated parental populations . However, other evolutionary processes, including balancing selection or heterozygote advantage, may also contribute to heterozygote excess and should be investigated in future studies .
Rohmah et al. (2022) found that Ho was higher than He at several loci, indicating relatively high heterozygosity at those loci, as well as the presence of several polymorphic SNPs. Karsli and Balcıoğlu (2019) noted that Ho < He often indicates a heterozygosity deficit (positive FIS) and potential inbreeding, whereas Ho>He may reflect selection for heterozygous variation or a complex population structure. However, an excess of observed heterozygosity (Ho > He) should not be interpreted as evidence of high genetic variation. This may also result from population admixture, balancing selection, or heterozygote advantage, depending on the evolutionary history of the population . In the present study, population admixture is the most plausible explanation because IPB D1 chickens were developed as a composite breed consisting of approximately 75% indigenous chicken and 25% commercial broiler ancestry. The combination of genetically differentiated parental populations is expected to increase the heterozygosity at several loci. Moreover, the deviation from Hardy–Weinberg equilibrium observed in the UP3J population is likely associated with the combined effects of this composite genetic background and artificial selection during breed development rather than migration or genetic drift, which are less likely under a controlled breeding program. The Inbreeding Coefficient (FIS), FST (Fixation Index), and Nm (gene flow) indices facilitate the interpretation of differentiation among subpopulations and the degree of gene interaction between chicken breeding populations.
Most SNPs were classified as non-significant (ns), indicating a non-significant deviation from HWE (Table 5). These results suggest that most FABP4 loci are in genetic equilibrium. In the UP3J population, several SNPs, such as g.121038256A>G, g.121038136A>C, g.
121038101A>T, g.121038074A>T, g.121037861A>G, and g.121037807G>A, showed deviations from the HWE. This condition is likely related to the high frequency of certain alleles close to fixation, which causes the genotype distribution to deviate from the Hardy–Weinberg expectations. In general, deviations from the HWE may result from evolutionary forces such as selection, migration, genetic drift, population subdivision, or non-random mating. However, in the present study, population admixture and artificial selection were the most plausible explanations. IPB D1 chickens were developed from crosses between
Table 5: Hardy-Weinberg equilibrium of the FABP4 gene in IPB D1 chickens.
N = number of individuals; HWE = Hardy–Weinberg equilibrium; χ² = chi-square statistic for the Hardy–Weinberg equilibrium test; ns = not significant (χ² < 3.841; P > 0.05), indicating no significant deviation from Hardy–Weinberg equilibrium (in HWE); * = significant (χ² ≥ 3.841; P < 0.05), indicating significant deviation from Hardy–Weinberg equilibrium. The critical χ² value was 3.841 at α = 0.05 with 1 degree of freedom (df = 1); NA: not applicable (Monomorphic ).
indigenous chickens (75%) and commercial broiler lines (25%), and this composite genetic background is likely to contributed to the deviations from HWE because the allele frequencies inherited from the parental populations has not yet have reached equilibrium . Furthermore, artificial selection during the development and maintenance of IPB D1 chickens may have altered allele and genotype frequencies across generations, leading to a
departure from the Hardy–Weinberg equilibrium . Similar patterns have been reported in selectively bred chicken populations, where admixture and selection are important factors in shaping the population genetic structure .
The present findings provide baseline information on the genetic variation of the FABP4 gene in IPB D1 chickens and contribute to the understanding of molecular variation within this newly developed composite breed. The identification of polymorphic loci, including missense SNP (g.121038074A>G; Asn89Ser), suggests that FABP4 may be a promising candidate for future molecular breeding studies , . However, the present study was limited to the characterization of genetic variation and population genetic parameters and did not evaluate the association between FABP4 polymorphisms and economically important traits such as growth performance, carcass characteristics, fat deposition, or meat quality. In addition, although two IPB D1 populations were analyzed, the relatively small sample size of the UP3J population may have reduced the precision of allele frequency estimates and genetic variation parameters. Therefore, the identified polymorphisms should be considered as baseline genetic information, and their potential application in marker-assisted selection requires further validation in larger populations.
Future studies should investigate the association between the identified FABP4 polymorphisms and economically important traits in larger IPB D1 chicken populations to validate their potential as molecular markers for genetic improvements , . Furthermore, computational protein structural modeling and functional analyses are required to determine whether the Asn89Ser substitution affects the structural stability or ligand-binding properties of FABP4, given the continuing evidence that FABP4 is involved in lipid metabolism and economically important traits in poultry . Integrating these approaches with transcriptomic and metabolomic analyses would provide a more comprehensive understanding of the molecular mechanisms underlying lipid metabolism and facilitate the development of molecular breeding strategies for IPB D1 chickens
Conclusion
A total of 10 SNPs were identified in the FABP4 gene, distributed across intron 2, exon 3, and intron 3. One SNP, a missense mutation (g.121038074A>G), was identified that had the potential to alter the protein structure of FABP4. This finding indicates the presence of genetic variation that may contribute to phenotypic variations.
ACKNOWLEDGEMENT
The authors sincerely appreciate the financial support provided by Beasiswa Pendidikan Indonesia (BPI), the Ministry of Higher Education, Science, and Technology of the Republic of Indonesia, the Ministry of Finance, Indonesia Endowment Fund for Education (LPDP), and Riset Inovatif Produktif (RISPRO) (grant number: PRJ/28/LPDP/2019).
NOVELTY STATEMENT
This study’s uniqueness lies in the comprehensive identification and genetic characterization of FABP4 variations in IPB D1 chickens, an Indonesian composite chicken population for which FABP4 genetic information is currently unavailable. This study identified several polymorphic sites, including nonsynonymous variants, and characterized the distribution of alleles and genotypes, as well as their genetic diversity. These findings provide new molecular evidence of FABP4 genetic variation in IPB D1 chickens.
Author’s Contribution
All authors contributed to this research. ASH, CS, S, IK, and AG were responsible for conception and design of the study, drafting the manuscript, and critical review. ASH and ZW were acquisition of data. ASH, S, and IK were analysis and interpretation of data.
Generate AI and AI assisted technology statement
The authors declare that no generative AI and AI assisted technology was used in the creation of this manuscript.
Conflict of interest
The authors declare no conflicts of interest.
Figures
Figure 1:.
Visualization of PCR amplification of the FABP4 gene.
Figure 2:.
Visualization of SNP identification in the FABP4 gene at SNP g.121038074A>G in IPB D1 chickens
Figure 3:.
Representative multiple sequence alignment of the FABP4 gene fragment from IPB D1 chickens.
References
Abdalla BA, Chen J, Nie Q and Zhang X (2018). Genomic insights into the multiple factors controlling abdominal fat deposition in a chicken model. Front. Genet., 9:262. https://doi.org/10.3389/fgene.2018.00262[CrossRef]
Akinbami BO, Toye AA (2019). A molecular marker for fatty acid binding protein 4 (FABP4) growth determinant function in Nigerian Fulani ecotype chickens. Niger. J. Anim. Prod., 3(3): 83-94. https://doi.org/10.12972/jabng.20190010[CrossRef]
Al-Habib MF, Murtini S, Gunawan A, Ulupi N, Sumantri C (2020). Asosiasi c.248 A>G gen CD1B dengan IgY dan titer ND pada ayam Sentul galur Sensi-1 Agrinak. Jurnal Ilmu Produksi dan Teknologi Hasil Peternakan, 8(1):30–35. https://doi.org/10.29244/jipthp.8.1.30-35[CrossRef]
Allendorf FW, Funk WC, Aitken SN, Byrne M, Luikart G, Antunes A (2022). Conservation and the genomics of populations. 3rd ed. Oxf. Univ. Press. Oxf., UK. https://doi.org/10.1093/oso/9780198856566.001.0001[CrossRef]
Guo Y, Ou JH, Zan Y, Wang Y, Li H, Zhu C, Chen K, Zhou X, Hu X, Carlborg Ö (2021). Researching on the fine structure and admixture of the worldwide chicken population reveal connections between populations and important events in breeding history. Evol. Appl., 15(4):553-564. https://doi.org/10.1111/eva.13241[CrossRef]
Karsli T, Balcioglu MS (2019). Genetic characterization and population structure of six brown layer pure lines using microsatellite markers. Asian-Australas. J. Anim. Sci., 32(1):49–57. https://doi.org/10.5713/ajas.17.0870[CrossRef]
Lawal, RA, Hanotte O (2021). Domestic chicken diversity: Origin, distribution, and adaptation. Anim. Genet., 52: 385-394. https://doi.org/10.1111/age.13091[CrossRef]
Lestari DP, Masruroh M, Khaerunnisa I, Murtini S, Ulupi N, Gunawan A, Sumantri C (2022). Variation and association of avian β-defensin 2 gene with the concentration of immunoglobulin Y and the titer of Newcastle disease antibody in IPB-D1 chicken. Trop. Anim. Sci. J., 45(2):121–127. https://doi.org/10.5398/tasj.2022.45.2.121[CrossRef]
Li J, Zhou Z, Zhang Z, Zheng X, Sun Y, Guo S, Li Y, Yang X, Kong S, Cai D, Lin D, Mo Y, Cai B, Nie Q (2025). Indigenous broilers in crossbreeding: Impacts on meat quality and candidate gene screening. Poult. Sci., 104(7):105245. https://doi.org/10.1016/j.psj.2025.105245[CrossRef]
Lin H, Hargreaves KA, Li R, Reiter JL, Wang Y, Mort M, Cooper DN, Zhou Y, Zhang C, Eadon MT, Dolan ME, Ipe J, Skaar TC, Liu Y (2019). RegSNPs-intron: A computational framework for predicting pathogenic impact of intronic single nucleotide variants. Genome Biol., 20:254. https://doi.org/10.1186/s13059-019-1847-4[CrossRef]
Maharani, D, Park, HB, Jung, YK, Jung, S, Jo, CR, Lee, JH (2011). Investigation of SNPs in FABP3 and FABP4 Genes and Their Possible Relationships with Fatty Acid Composition in Broiler. Korean J. of Poult. Sci. Korean Soci. Poult. Sci., https://doi.org/10.5536/KJPS.2011.38.3.231[CrossRef]
Nei M, Kumar S (2000). Molecular evolution and phylogenetics. Oxford University Press, New York, USA. https://doi.org/10.1093/oso/9780195135848.001.0001[CrossRef]
Nusrath A, Beema Raiza PT (2015). Review on single nucleotide polymorphism analysis methods. Int. J. Eng. Res. Technol. (ijert) rtpptdm – 2015 3(30):1–4. Conference proceedings. Issn: 2278-0181
Rohmah L, Darwati S, Ulupi N, Khaerunnisa I, Sumantri C (2022). Polymorphism of prolactin (PRL) gene exon 5 and its association with egg production in IPB-D1 chickens. Arch. Anim. Breed., 65(4):449–455. https://doi.org/10.5194/aab-65-449-2022[CrossRef]
Sumantri C, Darwati S, Mulyono RH, Sumiati, Afnan R, Ulupi N, Arief II, Wulandari Z, Cyrilla L, Baihaqi M (2023). Ayam lokal unggul IPB D1: Pengembangan bibit, manajemen produksi, pengolahan produk dan uji pasar. IPB Press, Bogor, Indonesia. ISBN: 978-623-467-894-9.
Ulupi N, Sumantri C (2015). Peranan kelompok gen triglyceride lipase, fatty acid synthase dan fatty acid binding protein pada metabolisme lemak ayam broiler. WARTAZOA, 25(1):15–22. https://doi.org/10.14334/wartazoa.v25i1.1124[CrossRef]
Wang Q, Guan T, Li H, Bernlohr DA (2009). A novel polymorphism in the chicken adipocyte fatty acid-binding protein gene (FABP4) that alters ligand-binding and correlates with fatness. Comp. Biochem. Physiol. B Biochem. Mol. Biol., 154(3):298–302. https://doi.org/10.1016/j.cbpb.2009.07.002[CrossRef]
Wang C, Mu T, Feng X, Zhang J, Gu Y (2023). Study on fatty acid binding protein in lipid metabolism of livestock and poultry. Res. Vet. Sci. 158:185–195. doi.org/10.1016/j.rvsc.2023.03.011[CrossRef]
Zhang Y, Zhang J, Ren Y, Lu R, Yang L (2020). Tracing the evolution of fatty acid-binding proteins (FABPs) in organisms with a heterogeneous fat distribution. FEBS Open Bio, 10(5):861–872. https://doi.org/10.1002/2211-5463.12840[CrossRef]