Research Article · Volume 14, Issue 8, 8 August 2026 · Open Access
GroPro®, a Yeast-Derived Feed Additive, Modulates Immune Markers and Gut Microbiota in Laying Hens at the Starter Phase
· · · · · · ·
Affiliations & Notes ⌄
1Doctoral Student, Faculty of Animal Science and Technology, Universitas Brawijaya, Malang 65145, Indonesia
2Faculty of Animal Science and Technology, Department of Feed and Animal Nutrition, Universitas Brawijaya, Malang, 65145, Indonesia
3Angel Yeast Co., Ltd., 168 Chengdong Avenue, Yichang, Hubei, 443003, P. R. China. *Correspondence | Osfar Sjofjan, Faculty of Animal Science and Technology, Department of Feed and Animal Nutrition, Universitas Brawijaya, Malang, 65145, Indonesia
In this research, the influence of Gropro®, a yeast-derived supplementary feed additive, on immune cell markers (CD4, CD8, and CD45) in laying hens was determined and is summarized in Table 1.
GroPro® supplementation modulated immune and gut microbial indicators in starter-phase laying hens.
Ileal microbiota analysis indicated that GroPro® preserved the core ileal microbial structure dominated by Bacillota and Lactobacillus, while promoting a broader distribution of beneficial lactic acid bacteria at genus and species levels.
These results support GroPro® as a potential yeast-derived additive for enhancing early gut and immune development in young layers.
Selected from the article's own text.
Abstract
The present study evaluated the effects of GroPro®, a yeast-derived feed additive, on splenic immune markers and ileal gut microbiota in starter-phase Hy-Line laying hens. A total of 480 one-day-old chicks were allocated to four dietary groups: control, 0.2% GroPro®, 0.5% GroPro®, and 1% GroPro® for 49 days. At the end of the trial, spleen samples were analyzed by flow cytometry for CD4+, CD8+, and CD45+ cell populations, while ileal digesta from the control and 1% level of GroPro®-supplemented group were subjected to full-length 16S rRNA sequencing using Oxford Nanopore technology. GroPro® supplementation significantly modulated splenic CD4+ T-cell frequency, with the 0.2% inclusion level showing the greatest increase compared with the control, whereas CD8+ and CD45+ populations were not significantly affected. Microbiota analysis showed that Bacillota dominated both groups at the phylum level, indicating preservation of the core microbial structure. At the genus level, Lactobacillus remained the predominant genus, while GroPro® supplementation expanded detectable genus diversity and altered the relative abundance of Romboutsia, Streptococcus, Enterococcus, Limosilactobacillus, and Ligilactobacillus. Species-level profiling revealed a broader distribution of lactic acid bacteria-associated taxa in the treatment group, including enrichment of Lactobacillus johnsonii and Lactobacillus kitasatonis. Alpha diversity analysis showed a significant increase in Shannon diversity in the treatment group, while NMDS ordination and PERMANOVA indicated no significant separation in beta diversity. Overall, GroPro® improved selected immune and microbial diversity indicators without causing major disruption of the ileal microbial community. These findings support its potential as a nutritional strategy for gut and immune development in laying hens.
The use of antibiotic feed additives to increase the growth and feed efficiency of poultry began in the 1940s . Globally, Van Boeckel et al. (2015) estimated that 105,596 metric tons of antimicrobials will be used in the production of food animals by 2030. Yeast has emerged as anatural alternative to antibiotic growth promoters in laying hens, improving performance . Gropro®, a feed additive product derived from yeast, is produced by PT Angel Yeast Co., Ltd. Gropro® contains up to (nucleic acid 10.56%), (TCA-N 33.67%), (MOS (mannan oligosaccharides) 13.95%), (small peptides 23.83%), (β-glucan 15.20%), and other materials to meet the nutritional needs of chickens. The combination of nucleic acids and proteins from yeast enhances the digestibility and health of internal organs, which in turn promotes the productivity and well-being of laying hens ; .
Numerous small peptides exhibit antimicrobial activities that might aid in gut health and decrease the number of diseases in chickens . Small peptides improve feed efficiency and growth rates, directly increasing feed conversion ratio (FCR) and general productivity. These two parameters are important for enabling the profitability of poultry farming . Yeast β-glucan (YG) is a polysaccharide extracted from Saccharomyces cerevisiae. Yeast β-glucan has multiple biological functions, including immune system enhancement, antioxidant protection, tumor destruction, bacterial killing, virus elimination, wound healing, toxin binding and growth promotion. It is a strong immunomodulator that activates innate and humoral immunity, increasing the body’s ability to combat infections and reverse immunosuppression in chickens . Short-chain fatty acids (SCFAs), primarily acetate, propionate, and butyrate, are produced in the gut through the microbial fermentation of dietary fibres such as β-glucan prebiotics. SCFAs also modulate immune responses by decreasing inflammation and promoting anti-inflammatory pathways. By strengthening the gut barrier, SCFAs reduce the translocation of harmful pathogens and toxins into the bloodstream, thereby decreasing systemic inflammation and supporting liver health . Mannan oligosaccharides (MOSs) function as prebiotics by promoting nonpathogenic bacteria within the intestinal contents while inhibiting pathogenic bacteria ; . Furthermore, supplementation with MOS in the diet enhances intestinal barrier integrity and enhances immunity . Yeast-based feed additives act on the gut flora favourably in terms of promoting animal immune responses and animal gut health . Moreover, Trichloroacetic acid (TCA)–soluble nitrogen is the low–molecular weight protein fraction remaining after precipitation with trichloroacetic acid and serves as an indicator of protein hydrolysis. Its increase reflects microbial proteolysis, producing small peptides and free amino acids that enhance ileal digestibility and nutrient availability, making it a reliable marker of improved protein quality in poultry .
In addition, amino acids play a pivotal role in the performance of early-stage birds. The supplementation of tryptophan and threonine can affect the growth performance of native chicken breeds during the starter phase . Moreover, lysine did not affect weight gain during the starter phase hens . These amino acids are known to support intestinal integrity and enhance adaptive immune responses. The current research aimed to assess how the immune response and gut microbiota composition of laying hens changed after they received dietary supplements of Gropro®, including nucleic acid, TCA-N, MOS (mannan oligosaccharides), small peptides, β-glucan and other materials. Researchers anticipate that increasing Gropro® levels from 0.2%, 0.5% and 1% would have dose-dependent effects on immune system functions, including changes in immune parameter responses (CD4⁺, CD8⁺ and CD45⁺ T cells), CD4⁺ T-cell populations and the microbiome. Researchers anticipate that optimal inclusion levels, for instance, “increase beneficial bacteria while reducing pathogenic bacteria in laying hens at the starter-phase”. Further elaboration on the functional implications of microbial shifts in relation to nutrient absorption and pathogen resistance remains uncertain but very important. Understanding how these changes affect nutrient absorption and pathogen resistance would be advantageous.
MATERIALS AND METHODS
Experimental design and animal housing
A total of 480 one-day-old Hy-Line Brown laying chicks were obtained from Hy-Line Brown Chicks, Indonesia. The birds were reared under standard management and environmental conditions according to conventional laying hen husbandry practices. The experiment was conducted for 7 weeks, corresponding to the starter phase. Birds were assigned to a completely randomized design consisting of four dietary treatments, with six replicates per treatment and 20 birds per replicate. Thus, 24 experimental units were used. Each replicate was housed in a pen measuring 1 m × 1 m × 0.7 m and equipped with two chick feeders and one drinker.
The basal diet consisted of commercial complete feed produced by Charoen Pokphand Indonesia, Tbk. Two feed types were used during the study period: pre-starter layer feed 520 from 0 to 5 weeks and starter layer feed 521 from 6 to 7 weeks. Feed and drinking water were provided according to the standard feeding program. Dietary supplementation was administered from week 1 to week 7 by mixing GroPro® directly into the basal diet before feeding. GroPro® contains mannan oligosaccharides, small peptides, β-glucan, nucleic acids, TCA-soluble nitrogen, and other components according to the manufacturer’s specification .
The dietary treatments were as follows: T0, basal mash feed without GroPro® supplementation; T1, basal mash feed supplemented with 0.2% GroPro®; T2, basal mash feed supplemented with 0.5% GroPro®; and T3, basal mash feed supplemented with 1% GroPro®. The inclusion levels were selected to evaluate a graded supplementation response. The 1% level was used as the highest inclusion level based on manufacturer recommendation and preliminary safety observations, whereas 0.2% and 0.5% were included to assess lower and intermediate biological responses. At 49 days of age, samples were collected for immune activity and gut microbiota analyses.
Spleen sample collection for immune activity analysis
At the end of the 7-week experimental period, one bird was selected from each replicate for spleen collection. The replicate pen was considered the experimental unit. Therefore, six spleen samples were obtained from each treatment group. Birds were selected from each replicate to avoid pseudoreplication. The spleen was aseptically excised and processed for splenic cell suspension preparation using phosphate-buffered saline.
Flow cytometric analysis of immune cell phenotypes
Immune activity was evaluated by flow cytometry based on the relative frequency of splenic leukocyte markers, including CD4⁺ T cells, CD8⁺ T cells, and CD45⁺ leukocytes. Fixation buffer, intracellular staining perm wash buffer, anti-chicken CD4, anti-chicken CD8, anti-chicken CD45 primary antibodies, and FITC-conjugated secondary antibody were obtained from BioLegend, USA. The antibodies were validated by the manufacturer for flow cytometric analysis of chicken lymphocytes. Staining specificity was confirmed using unstained and isotype controls.
Briefly, 50 µL of each splenic cell suspension was transferred into a 1.5 mL microtube containing 400 µL PBS and centrifuged at 2500 rpm for 5 min at 4°C. The resulting splenocyte pellet was incubated with fixation buffer for 30 min. The cells were then washed with intracellular staining perm wash buffer and centrifuged again under the same conditions. The pellet was incubated with the corresponding primary antibody for 30 min, followed by washing with perm wash buffer. After centrifugation, the cells were incubated with FITC-conjugated secondary antibody for 20 min. The stained cells were resuspended in PBS and analyzed using a BD FACS Calibur flow cytometer, USA. Data acquisition and analysis were performed using BD CellQuest Pro software .
Ileal digesta collection for gut microbiota analysis
At 49 days of age, ileal digesta samples were collected from the control group and the best-performing GroPro®-supplemented group, as determined by the performance and immune response parameters. Three birds were randomly selected from each group, resulting in three ileal digesta samples per group. The mid-ileal segment, approximately 3 cm proximal to the cecal junction, was carefully excised. Digesta contents were collected into sterile tubes, immediately frozen in liquid nitrogen to preserve microbial integrity, and stored at −80°C until DNA extraction.
DNA extraction and 16S rRNA gene amplification
Microbial DNA was extracted from ileal digesta samples using the ZymoBIOMICS DNA Miniprep Kit according to the manufacturer’s instructions. DNA concentration was measured using a Qubit fluorometer. The near full-length bacterial 16S rRNA gene, covering the V1 to V9 regions and approximately 1,500 bp in length, was amplified by polymerase chain reaction using Promega GoTaq Green Master Mix M712B. The primer pair used for amplification consisted of 27F, 5′-AGAGTTTGATCMTGGCTCAG-3′, and 1492R, 5′-GGTTACCTTGTTACGACTT-3′. The obtained amplicons were purified using VAHTS DNA Clean Beads, Vazyme, China, at a sample-to-bead ratio of 1:0.5. Purified DNA was eluted in 20 µL elution buffer and used for library preparation.
Nanopore library preparation, sequencing, and read processing
Purified amplicon DNA was subjected to quality control using a Qubit fluorometer before library preparation. Sequencing libraries were prepared using the Native Barcoding Kit SQK-NBD114-24, Oxford Nanopore Technologies, according to the manufacturer’s protocol. Sequencing was performed on a PromethION platform, Oxford Nanopore Technologies, UK, and run monitoring was conducted using MinKNOW software. Basecalling was performed using Dorado version 0.9.1.
Raw reads were filtered using a minimum Phred quality score threshold of Q ≥ 10. Length filtering was applied to retain reads between 1300 and 1600 bp, corresponding to near full-length 16S rRNA gene sequences. Reads that did not meet the quality and length criteria were excluded from downstream analysis . Sequencing quality was evaluated using NanoPlot to assess read length distribution and quality score profiles.
Taxonomic classification and diversity analysis
Taxonomic assignment was performed using the EPI2ME wf-16S v1.4.0 workflow with the Kraken2 algorithm . The NCBI_16S_18S_28S_ITS database was used as the reference database for taxonomic classification. Following taxonomic assignment, taxa and abundance data were exported for downstream diversity analysis.
Microbial diversity analysis was performed in RStudio using the vegan package. Alpha diversity was evaluated using Simpson’s index, Shannon index, Berger-Parker dominance index, Fisher’s alpha, Pielou’s evenness, and taxa richness. Alpha diversity indices were visualized using boxplots. Beta diversity was assessed using Bray-Curtis, Jaccard, and Canberra distance matrices and visualized using nonmetric multidimensional scaling (NMDS) ordination plot.
Statistical analysis
Statistical analyses were performed using Microsoft Excel 2019 and R-Studio. Immune phenotyping data were analyzed using one-way analysis of variance. When significant differences were detected, Duncan’s multiple range test was applied as a post hoc test at a 95% confidence level. Immune data are presented as mean ± standard deviation, and significant differences are indicated using different superscript letters.
For gut microbiota analysis, relative abundance data were converted into percentages and visualized as stacked bar plots at the phylum, genus, and species levels. Alpha diversity indices between the control and GroPro®-supplemented groups (treatment) were compared using an independent t-test. Differences were considered statistically significant at (p < 0.05). Beta diversity differences between groups were assessed using PERMANOVA based on Bray-Curtis, Jaccard, and Canberra distance matrices. NMDS plots were generated in R to visualize microbial community structure between the control and treatment groups.
RESULTS AND DISCUSSION
Results for immune activity
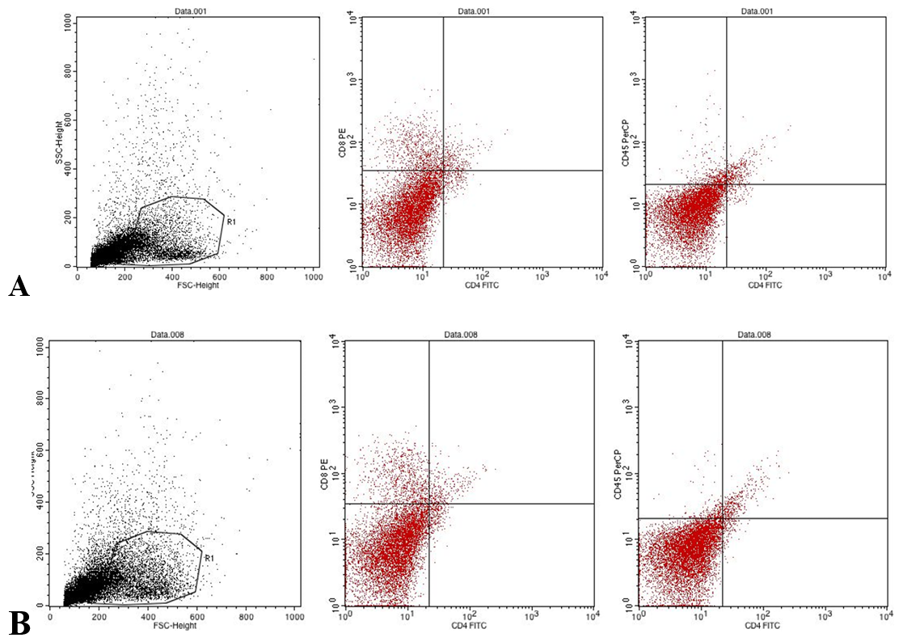
In this research, the influence of Gropro®, a yeast-derived supplementary feed additive, on immune cell markers (CD4, CD8, and CD45) in laying hens was determined and is summarized in Table 1. Flow cytometric analysis of splenocytes revealed that the experimental groups had different CD4⁺ T-cell frequencies. The results between the treatment and control groups revealed that the T1 group had 3.03ᵃ ± 0.39 CD4⁺ T cells in the spleen, whereas T0 had 1.99b ± 0.49 CD4⁺ T cells, which was a statistically significant difference (P < 0.05) during the starter phase. T1 was the best treatment among the other treatments. The CD4⁺ of T cells was identified using a validated flow cytometric gating strategy for avian splenocytes (Table 1 and Figure 1).
Table 1: CD4 in laying hens at starter phase under control and Gropro® treatments.
Treatment
CD4
CD8
CD45
T0
1.99b ±0.49
10.36±1.86
3.46±1.05
T1
3.03±0.39a
6.91±1.85
2.70±0.82
T2
2.81ab±0.82
8.74±3.07
3.58±1.26
T3
2.76ab±0.39
10.00±2.44
4.23±1.56
*a-b Superscripts columns suggest that the treatment had a very substantial significant effect (P<0.05) for CD4 cells.
In this study, FSC/SSC-based gating was used to identify the lymphocyte populations in splenic lymphocytes, which were then analysed by quadrant measurements of CD4-FITC expression. Flow cytometry analysis was performed by utilizing a gating system that operates in multiple stages. Forward scatter (FSC) and side scatter (SSC) parameters were used to detect cell populations while filtering out debris and noncellular events. Gates were established for leukocytes, which the scientists used to identify all CD45⁺ cells as total leukocyte populations. Scientists have used CD4 and CD8 expression to classify T-cell subsets within this population. The researchers used quadrant gating to identify four separate populations, which included CD4⁺ and CD8⁺ cells and double-positive and double-negative cells. The researchers established gating boundaries through the use of two controls, which included unstained and isotype control samples.
Then, uniform gating thresholds were applied to all the samples in their study, the control and treatment groups, using GroPro® because consistent analytical results were expected to be maintained throughout their research. The average percentage of CD4⁺ T cells in the spleen (mean ± SD) is shown below. The control group (T0) had a percentage of 1.99 and a standard deviation of 0.49. The recommended level of GroPro® (T1) was 3.03%, with a standard deviation of 0.39%. The intermediate level of GroPro® (T2) was 2.81%, with a standard deviation of 0.82. The maximum level of GroPro® (T3) was 2.76, with a standard deviation of 0.39. One-way ANOVA revealed significant differences among the treatment groups (P = 0.0219). Compared with the T0 treatment group, the T1 treatment group presented the highest CD4⁺ frequency, with a 1.04% increase, which was equal to a 52.3% relative increase. Compared with the control group, the T2 and T3 groups displayed moderate increases of 41.2% and 38.7%, respectively. Compared with the other groups, the T2 group showed greater individual differences in the test results, with a standard deviation of 0.82. Dot plot visualization revealed that compared with T0, T1 had higher CD4-FITC fluorescence intensity, confirming the researchers’ quantitative results. Leukocyte populations were identified on the basis of FSC/SSC characteristics; however, no additional lineage-specific marker (e.g., CD45) was used, which may limit the precision of cell population identification. Figure 1 for both the immunophenotyping of the CD4 control and treatment groups is shown below.
This study examined CD4⁺ T cells because they serve as primary coordinators of adaptive immune responses, but only their relative presence was evaluated. CD4⁺ cell percentages increased at the 0.2% supplementation level, indicating an effect on the immune system functions of helper T cells. The observed change does not demonstrate associated with immune system functions because the study lacks functional tests, which include cytokine production and antibody responses and pathogen challenge tests. A modest increase in CD4⁺ cell frequency may indicate a shift in immune cell composition, yet the actual impact of this change on bird health and productivity remains unknown. The percentages of CD4⁺ T cells differed among the groups (one-way ANOVA, P = 0.0219). The ANOVA results showed a major treatment effect because the (p < 0.05). The Tukey HSD test did not confirm consistent differences between pairs of groups. The specific group differences which were found in the study should be treated with caution.
The increased variability observed in the T2 group may reflect heterogeneous biological responses to the intermediate treatment level. Such variability is common in immunological parameters, where individual differences in immune activation and regulation can lead to broader dispersion without necessarily altering group-level statistical significance. CD8⁺ expression showed the opposite pattern. No statistically significant difference was detected in CD8+ or CD45+ cells (P>0.05); CD8⁺ expression was greatest in the control group (T0: 10.3683 ± 1.8620), followed by that in the T3 group (10.0 ± 2.4466). The number of CD8⁺ cells decreased significantly in the T1 treatment group (6.9133 ± 1.8516) because of the suppressive/regulatory effects on cytotoxic T lymphocyte activity. The expression of CD45⁺, a marker of all leukocytes, was moderately increased in the T3 group (4.2316 ± 1.5675) compared with that in the other groups, whereas the lowest expression of CD45⁺ was detected in the T1 group (2.7066 ± 0.8236). These results suggest that changes in leukocyte activation or proliferation that are treatment-specific effect size–based interpretations may provide additional insight beyond p values.
Effect of GroPro® on splenic CD4⁺ T cells
The significant ANOVA results (P < 0.05) indicate that GroPro® supplementation modulated the splenic CD4⁺ T-cell frequency in starter-stage laying hens. The elevation observed in T1 (~52% relative increase over T0) suggests enhanced helper T lymphocyte expansion or activation. The 0.2% inclusion level (T1) resulted in an increased average CD4⁺ T-cell percentage but showed no dose-dependent response, while higher inclusion levels resulted in greater variability, which indicated that the effects did not follow a linear pattern. This pattern shows that the relationship between increasing supplementation and the results reaches a threshold point that does not continue to improve after that threshold. The findings from T2 and T3 present large standard deviations that reflect either biological variability or sample size constraints.
This immunomodulatory effect is attributed to the bioactive components of GroPro®. β-glucan, a well-characterized pathogen-associated molecular pattern, binds to pattern recognition receptors on antigen-presenting cells and promotes the differentiation of T lymphocytes into CD4⁺ T cells ; . Mannan oligosaccharides have been shown to increase CD4⁺ and CD8⁺ T lymphocyte populations in poultry, enhancing both mucosal and systemic immune surveillance . The nucleic acids and small peptides in GroPro® serve as conditionally essential nutrients during rapid immune cell proliferation, providing building blocks for DNA synthesis and immunoglobulin production during the critical starter-phase ; . CD4⁺ T cells orchestrate adaptive immune responses by regulating B-cell activation, antibody production, and cytotoxic T-cell priming through cytokines such as IL-2 and IFN-γ . Therefore, the increase observed in T1 likely reflects enhanced systemic immune competence during this developmental period when the foundation for lifelong immunological capacity is established.
Although T2 and T3 also displayed higher means than T0 did, the greater variability in T2 (SD= 0.82) suggests heterogeneous biological responsiveness at the intermediate supplementation level. Gropro® treatment (T2) was selected because of its superior performance in terms of growth metrics (body weight gain, FCR) and immune indices (CD4⁺/CD8⁺ ratio). The CD4⁺ frequency of the T3 group, which received the highest GroPro® concentration, did not exceed that of the T1 group, suggesting potential immunoregulatory feedback at higher doses. This pattern aligns with the concept of hormesis in immunonutrition, where moderate supplementation optimizes immune enhancement. Furthermore, CD8⁺ and CD45⁺ yeast-based additives in poultry did not result in consistent changes in immune markers. The starter-phase represents a critical period for immune system development, and increased CD4⁺ expression during this phase may increase the capacity of helper T cells to respond to subsequent immune challenges, including associated with changes vaccine responses and pathogen resistance. More investigations into the different developmental stages or other immune markers will be necessary to clarify the potential of Gropro® to alter immune responses in poultry.
Effect of GroPro® on gut microbiota composition
Yeast β-glucans reach the large intestine, where the microbiota breaks them down through anaerobic digestion and fermentation. In animals, Lactobacillus and Bifidobacterium bacteria act as prebiotic substrates for lactic acid-producing bacteria and other beneficial taxa. These fermentation processes can yield short-chain fatty acids that are associated with gut health and immune system support . More specifically, compared with the controls, layers fed yeast β-glucan had higher levels of Lactobacillus spp., suggesting that there is a better microbiota balance and healthier intestines . Microbiota analysis was performed on ileal digesta samples collected from all treatment groups (control and treatment), with one sample per replicate included in the sequencing dataset. All the samples produced clear amplicons of the expected size, confirming their suitability for sequencing. A secondary PCR optimization step using varying DNA concentrations was performed to standardize amplification efficiency across samples with differing DNA yields, which is a common practice in 16S rRNA workflows and does not reflect sample degradation or inhibition.
PCR amplification
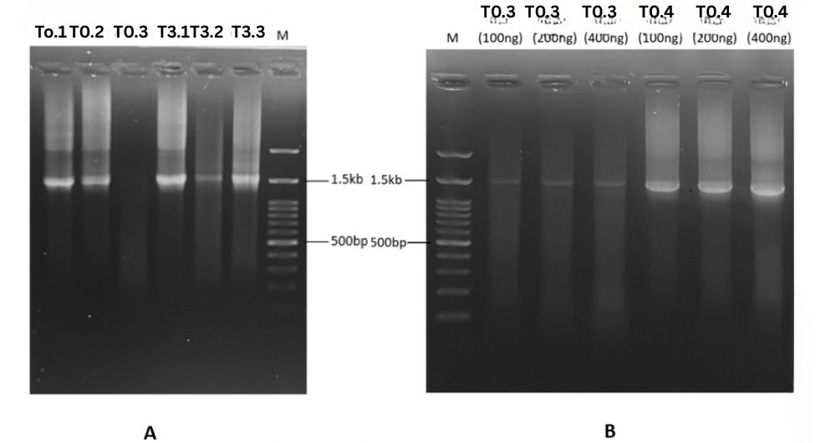
PCR amplification of the bacterial 16S rRNA gene (V1–V9 region; ~1,500 bp) was performed using Promega GoTaq Green Master Mix (M712B) and evaluated by agarose gel electrophoresis in two independent trials (Figure 2).
In the first trial (Figure 2A), samples T0.1, T0.2, T3.1, T3.2, and T3.3 (200 ng DNA input) produced a distinct band corresponding to the expected amplicon size of approximately 1.5 kb, as determined relative to the molecular weight marker (M). The bands were clearly visible and localized near the 1.5 kb reference band, indicating successful amplification of the full-length 16S V1–V9 region. No prominent nonspecific bands were observed within the lower molecular weight range (e.g., ~500 bp), although minor background smearing was visible in some lanes. In the second trial (Figure 2B), amplification was optimized for sample T0.4 using varying DNA input concentrations (100 ng, 200 ng, and 400 ng). A clear and specific ~1.5 kb band was observed for T0.4, particularly at 100 ng of input DNA, with minimal background smearing compared with higher template concentrations. The band intensity increased with increasing template concentration; however, increased background signal and slight smearing were also noted at 200 ng and 400 ng. Overall, successful amplification of the target 16S V1–V9 region was achieved for samples T0.1, T0.2, T3.1, T3.2, and T3.3 in the first trial and for T0.4 in the second trial. The confirmed amplicons were subsequently subjected to sequencing analysis. For T0 and T4, 100 ng of template-derived product was selected for sequencing because of its optimal band clarity and specificity.
PCR optimization for starter-phase hen samples
This study successfully validated a PCR protocol for amplifying the near-full-length bacterial 16S rRNA gene (V1–V9; ~1,500 bp) from the gut microbiota of laying hens during the starter phase. The consistent generation of strong, discrete bands at the target size confirms that the methodology is robust for use with poultry samples, a critical first step toward understanding early-life microbial colonization in laying hens. Amplification specificity in poultry samples. The observation of a single, discrete band at approximately 1.5 kb in size in samples from starter-phase hens (T0.1, T0.2, T3.1, T3.2, and T3.3) confirms high primer specificity for the bacterial 16S rRNA gene. The absence of nonspecific amplification is particularly relevant for poultry gut contents, which often contain a complex mixture of feed particles, host cells, and diverse microbial taxa . The successful amplification across these samples indicates that the PCR conditions effectively targeted the bacterial community despite this complexity, ensuring that downstream sequencing accurately captured the composition of the developing microbiota in young hens. The period between weeks zero and six is a critical stage because it marks the rapid development of microorganisms, which will affect future health outcomes, immune system development, and system production efficiency .
The second trial, which utilized sample T0.4 from the starter-phase, provided essential insights into template normalization. The finding that a lower DNA concentration (100 ng) resulted in a clearer amplicon profile than a higher concentration (200–400 ng) has practical implications for processing poultry gut samples. Cecal and ileal contents from young birds can vary significantly in microbial density and may contain relatively high concentrations of PCR inhibitors, such as bile salts, complex polysaccharides from feed, or uric acid ; . The improved clarity at 100 ng suggests that reducing the template volume minimizes the carryover of co-extracted inhibitors, which can otherwise lead to background smearing or primer-dimer formation. For starter-phase hens, where sample biomass may be limited, these findings indicate that prioritizing purity over quantity is key to generating high-quality amplicons suitable for sequencing.
Although PCR-based approaches can introduce amplification bias, maintaining uniform reaction conditions across samples minimizes this effect. The limited variation in template DNA input in this study was necessary to ensure successful amplification and is unlikely to have significantly influenced the observed microbial community structure but no negative control (no-template control (Figure 2). Relevance to early life microbiome studies in layers. The ability to consistently amplify the full-length 16S gene from starter-phase hens is methodologically significant for poultry science. While short-read sequencing of hypervariable regions (e.g., V3–V4) is common, it often provides insufficient resolution to discriminate between closely related species that may have different functional roles in the developing gut . Full-length 16S sequencing offers the taxonomic depth required to track the colonization of specific genera (e.g., Lactobacillus, Bifidobacterium, and Faecalibacterium) or potential pathogens during this critical early life window .
Phylum-level microbial changes
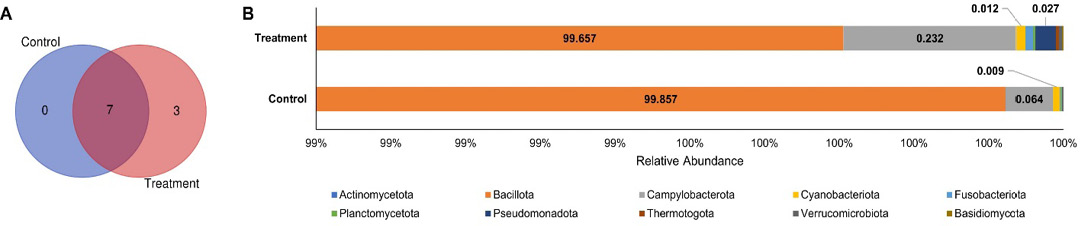
At the phylum level, the Venn diagram showed that seven phyla were shared between the control and GroPro®-supplemented treatment groups, whereas three phyla were exclusively detected in the treatment group and no phylum was uniquely detected in the control group (Figure 3A). This pattern indicates that GroPro® supplementation did not replace the core phylum-level microbial structure, but may have expanded the detectable phylum-level diversity by introducing or supporting low-abundance bacterial groups. The relative abundance profile further demonstrated that both groups were overwhelmingly dominated by Bacillota, accounting for 99.857% of the total microbial community in the control group and 99.657% in the treatment group (Figure 3B). This high dominance of Bacillota suggests that the ileal microbiota of starter-phase laying hens remained largely stable at the broad taxonomic level, regardless of dietary supplementation.
Although the overall phylum-level composition was similar between groups, several low-abundance phyla showed treatment-associated changes. Campylobacterota increased from 0.064% in the control group to 0.232% in the treatment group, while Pseudomonadota increased from 0.009% to 0.027%. Fusobacteriota was also more detectable in the treatment group, reaching 0.012%. Despite these numerical shifts, the abundance of these phyla remained very low relative to Bacillota, indicating that GroPro® supplementation did not induce major phylum-level dysbiosis. Biologically, this result suggests that the beneficial effects of GroPro® may not be reflected by large-scale changes at the phylum level, but rather by more specific modulation at lower taxonomic ranks, particularly within Bacillota. Moreover, the treatment group showed an increase in both the number and distribution of observed taxa, suggesting that GroPro® may modulate the gut microbiota by enhancing taxonomic richness and promoting a broader distribution of microbial taxa to achieve a balance gut microbial community structure (Chen-Liaw et al., 2024; .
Genus-level microbial changes
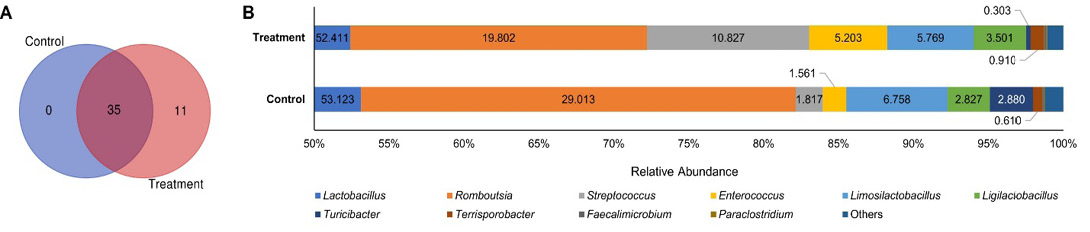
Similar pattern also observed at the genus level, with the Venn diagram showed that 35 genera were shared between the control and GroPro®-supplemented treatment groups, whereas 11 genera were uniquely detected in the treatment group and no genus was exclusively detected in the control group (Figure 4A). This pattern suggests that GroPro® supplementation did not eliminate the core genus-level microbial community present in the control group, but rather expanded the detectable genus diversity by supporting additional low-abundance genera. The relative abundance profile demonstrated that both groups were dominated by lactic acid bacteria and other Bacillota-associated genera. Lactobacillus was the most abundant genus in both groups, with comparable relative abundance between the control and treatment groups, accounting for 53.123% and 52.411%, respectively (Figure 4B). However, several genus-level shifts were observed after GroPro® supplementation. Romboutsia decreased from 29.013% in the control group to 19.802% in the treatment group, whereas Streptococcus increased markedly from 1.817% to 10.827%. Enterococcus also increased in the treatment group, reaching 5.203%, while Limosilactobacillus showed a slight reduction from 6.758% in the control group to 5.769% in the treatment group. In contrast, Ligilactobacillus increased from 2.827% to 3.501% following GroPro® supplementation.
These findings indicate that GroPro® supplementation induced a selective genus-level modulation rather than a complete restructuring of the gut microbiota. The persistence of Lactobacillus as the dominant genus in both groups indicates that the ileal microbiota remained primarily characterized by lactic acid bacteria, which are commonly associated with intestinal homeostasis, competitive exclusion of pathogens, organic acid production, and immune regulation . The increase in Ligilactobacillus, together with the sustained abundance of Lactobacillus and Limosilactobacillus, suggests that GroPro® may support beneficial lactic acid bacteria groups within the gut ecosystem. This is biologically relevant because yeast-derived components, including β-glucan, mannan oligosaccharides, nucleotides, and small peptides, may act as prebiotic and immunonutritional substrates that selectively promote beneficial taxa and improve host–microbe interactions ; ; . Although Streptococcus and Enterococcus increased in the treatment group, these genera include both commensal and opportunistic species ; . Therefore, their biological interpretation should be supported by species-level analysis and pathogenicity classification. Overall, the genus-level data suggest that the effect of GroPro® is more likely reflected by taxa-specific shifts within the dominant Bacillota and lactic acid bacteria community rather than by broad phylum-level changes, supporting the need to integrate genus- and species-level profiling when evaluating the microbiota-modulating potential of yeast-derived feed additives.
Species-level microbial changes
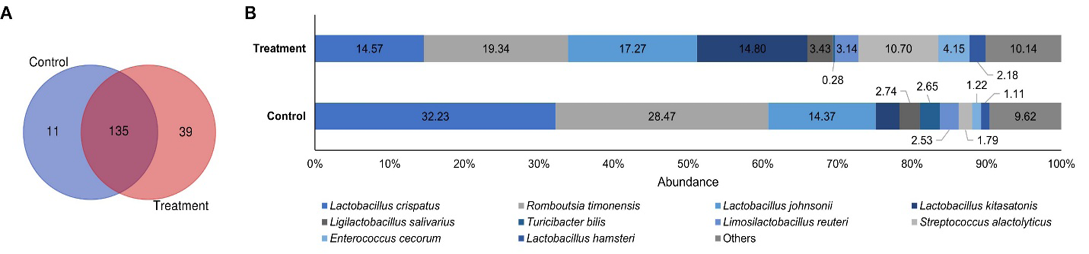
At the species level, the Venn diagram showed that 135 bacterial species were shared between the control and GroPro®-supplemented treatment groups, whereas 11 species were uniquely detected in the control group and 39 species were uniquely detected in the treatment group (Figure 5A). This pattern suggests that GroPro® supplementation did not disrupt the core species-level microbiota, but it increased the number of detectable treatment-associated species. The relative abundance profile further showed that the control group was mainly dominated by Lactobacillus crispatus and Romboutsia timonensis, which accounted for 32.23% and 28.47% of the total community, respectively (Figure 5B). In contrast, the treatment group showed a more distributed species-level composition, with Romboutsia timonensis as the most abundant species at 19.34%, followed by Lactobacillus johnsonii at 17.27%, Lactobacillus kitasatonis at 14.80%, and Lactobacillus crispatus at 14.57%. This shift indicates that GroPro® supplementation reduced the dominance of a few major species and promoted a broader distribution of lactic acid bacteria-associated taxa.
Several beneficial bacterial species increased or became more prominent in the GroPro®-supplemented group. In particular, Lactobacillus johnsonii increased from 14.37% in the control group to 17.27% in the treatment group, while Lactobacillus kitasatonis was markedly enriched in the treatment group, reaching 14.80%. Streptococcus alactolyticus also increased from 2.74% to 10.70%, while Enterococcus cecorum increased from 1.79% to 4.15%. In addition, Lactobacillus hamsteri was more abundant in the treatment
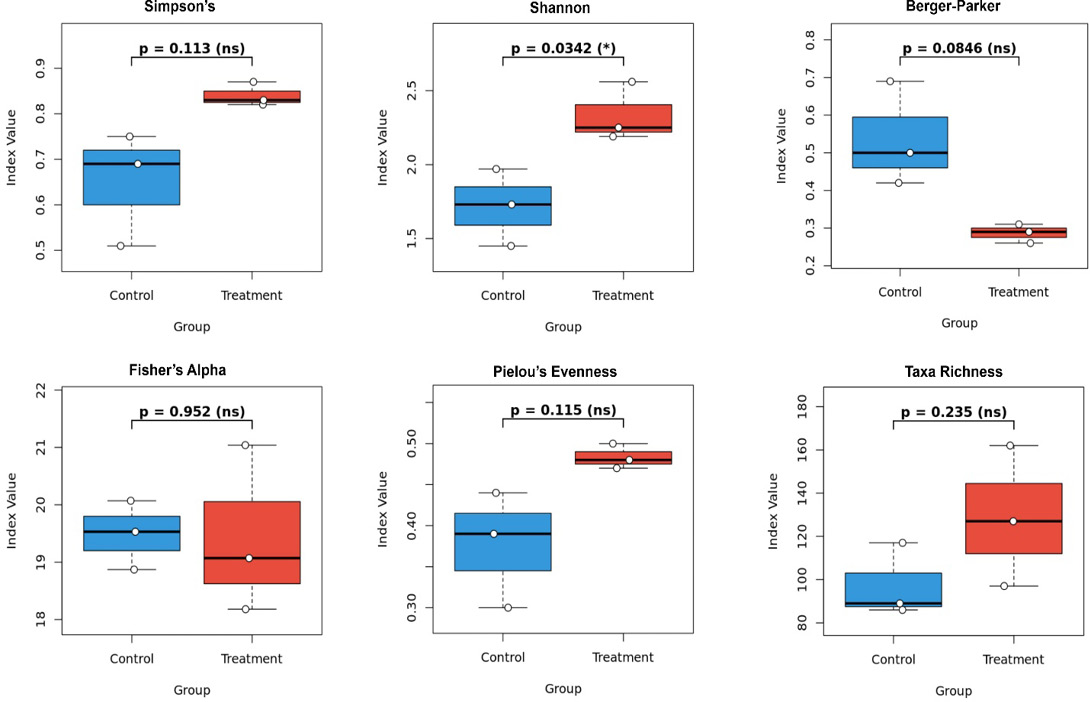
Boxplots show six alpha diversity indices, including Simpson’s index, Shannon index, Berger–Parker dominance index, Fisher’s alpha, Pielou’s evenness, and taxa richness. The control group is shown in blue, while the GroPro®-supplemented treatment group is shown in red. Each point represents an individual sample, with three samples per group. Statistical comparisons between groups were performed using an independent t-test.
group than in the control group, although it remained at a relatively low proportion. The lower proportion of Lactobacillus crispatus in the treatment group does not necessarily indicate an unfavorable microbial shift, because other lactic acid bacteria, particularly L. johnsonii and L. kitasatonis, were enriched and may contribute similar or complementary roles in maintaining gut homeostasis. These results support the interpretation that GroPro® may exert its microbiota-modulating effect through species-specific rearrangement within the lactic acid bacteria community rather than through broad changes in overall microbial diversity.
Biologically, the enrichment of several Lactobacillus species in the treatment group is important because lactic acid bacteria are widely associated with intestinal barrier support, organic acid production, competitive exclusion of pathogens, and modulation of mucosal immunity . Yeast-derived components in GroPro®, such as β-glucan, mannan oligosaccharides, nucleotides, and small peptides, may provide selective substrates or immunonutritional support that favor beneficial bacterial species and improve host–microbe interactions. Moreover, because this analysis was based on 16S rRNA sequencing, species-level assignments should be considered indicative and require cautious interpretation. Overall, the species-level profile suggests that GroPro® supplementation promoted a more diverse and taxa-specific microbial arrangement, especially involving lactic acid bacteria, which may explain potential beneficial effects even when broad beta diversity patterns do not show significant separation.
Pathogenic and nonpathogenic species
There were 123 non-pathogenic species and 61 pathogenic species in the gut microbiome. A total of 185 species were co-observed between the control and treatment groups (Supplementary Table 1). 16S rRNA sequencing data for the control and treatment groups (1% Gropro®). Species known as opportunistic pathogens can cause disease under conditions of dysbiosis or immune stress. The relative abundance of potential pathogenic bacteria varied between the control and treatment groups. Pathogenic species, with the majority being Streptococcus, Enterobacterus, Clostridium,
and Corynebacterium, varied significantly depending on the type of treatment. Treatment T0 contained a moderate number of pathogenic species associated with Enterococcus and Streptococcus. Previous studies have shown that bacteria are present in the ceca of clinically healthy birds, indicating that Streptococcus infections are rare in commercial layer hens but can be severe, such as septicemia, increasing death rates, and lowering egg production . Moreover, dietary supplementation with yeast-derived β-glucans (200 mg/kg) significantly improved body weight gain, feed efficiency, intestinal morphology, and anti–Clostridium perfringens antibody responses while reducing intestinal C. perfringens colonization in infected broilers .
Alpha diversity
Alpha diversity analysis was performed to evaluate within-sample microbial diversity between the control and GroPro®-supplemented groups using six ecological indices, including Simpson’s index, Shannon index, Berger–Parker dominance index, Fisher’s alpha, Pielou’s evenness, and taxa richness (Figure 6). Among these indices, only the Shannon index showed a significant difference between groups, with the treatment group exhibiting a significantly higher Shannon diversity than the control group (p = 0.0342). This result indicates that GroPro® supplementation increased overall microbial diversity by improving both richness and proportional distribution of bacterial taxa. Although Simpson’s index was numerically higher in the treatment group than in the control group, the difference was not statistically significant (p = 0.113). Similarly, Pielou’s evenness tended to be higher in the treatment group (p = 0.115), suggesting a more balanced microbial community, although this pattern did not reach statistical significance. Taxa richness was also numerically increased in the treatment group compared with the control group, but the difference was not significant (p = 0.235).
The Berger–Parker dominance index was lower in the GroPro®-supplemented group than in the control group, although the difference was not statistically significant (p = 0.0846). Since the Berger–Parker index reflects the proportional dominance of the most abundant taxon, this decreasing trend suggests that GroPro® supplementation may reduce the dominance of a single bacterial group and promote a more evenly distributed gut microbial ecosystem. In contrast, Fisher’s alpha showed nearly identical values between the control and treatment groups (p = 0.952), indicating that the abundance of rare taxa was not markedly affected by the dietary intervention. Collectively, these findings suggest that GroPro® supplementation did not broadly alter all components of alpha diversity but selectively improved microbial diversity as reflected by the Shannon index, with supportive nonsignificant trends toward higher Simpson diversity, greater evenness, increased taxa richness, and reduced dominance.
From a biological perspective, the significant increase in Shannon diversity, together with the tendency toward reduced dominance and improved evenness, may indicate a more stable and resilient gut microbial community in the GroPro®-supplemented group. Yeast-derived components in GroPro®, including β-glucan, mannan oligosaccharides, nucleotides, and small peptides, may function as prebiotic and immunonutritional substrates that support microbial balance and intestinal homeostasis ; ; ; . This is consistent with the concept discussed in the earlier review that yeast-based additives may not always induce large-scale alterations in microbiota structure, but can still improve gut health through selective modulation of beneficial taxa and microbial ecological balance, particularly lactic acid bacteria groups such as Lactobacillus, Ligilactobacillus, and Limosilactobacillus . Therefore, even though several alpha diversity indices did not reach statistical significance, the significant enhancement of Shannon diversity suggests that GroPro® supplementation may contribute to a more diverse and functionally favorable gut microbial environment during the starter phase.
Beta diversity
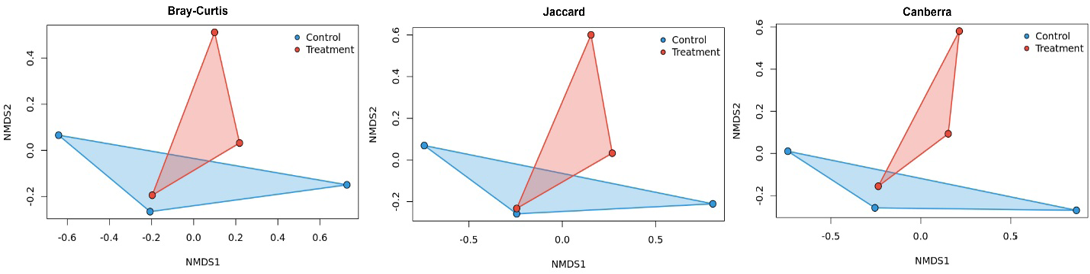
The NMDS ordination plots demonstrated a high degree of similarity in gut microbial community composition between the control and inactive yeast-supplemented groups. Across the three distance matrices evaluated, namely Bray-Curtis, Canberra, and Jaccard, the control group and the 10 kg/MT GroPro® supplementation group showed overlapping polygon distributions, indicating the absence of a clear separation in overall microbial community structure (Figure 7). This observation was further supported by PERMANOVA analysis, in which all distance matrices produced p-values greater than 0.05 (Supplementary Table 2). These findings suggest that dietary inclusion of GroPro® at 10 kg/MT did not significantly alter the global gut microbiota structure compared with the control group.
Although beta diversity analysis indicated no significant shift in the overall microbial community structure, this result does not necessarily exclude the possibility of biologically meaningful microbial modulation. Beta diversity primarily reflects broad-scale differences in community composition and may not capture subtle but functionally relevant changes in specific bacterial taxa . In this context, the beneficial effects of inactive yeast supplementation may arise from taxa-specific responses rather than whole-community restructuring. Particular attention should be given to beneficial bacterial groups, especially lactic acid bacteria, such as Lactobacillus, Ligilactobacillus, and Limosilactobacillus, which are commonly associated with improved intestinal health, competitive exclusion of pathogens, modulation of immune responses, and enhancement of nutrient utilization ; ; . Therefore, even in the absence of significant beta diversity differences, an increase or functional enrichment of selected beneficial taxa may still contribute to improved gut homeostasis and host performance. These findings highlight the importance of complementing beta diversity analysis with taxonomic abundance profiling and targeted evaluation of beneficial microbial groups to better understand the biological effects of GroPro® supplementation.
Limitation of study
Although compared with short-read sequencing, full-length 16S rRNA sequencing using Oxford Nanopore technology enables improved taxonomic resolution, it is associated with higher per-read error rates. As such, species-level assignments should be interpreted cautiously, and future studies incorporating error-correction pipelines or complementary sequencing platforms (e.g., Illumina-based approaches) are recommended to validate these findings. Future studies incorporating polishing tools or complementary sequencing approaches are recommended to improve taxonomic resolution.
The use of a general-purpose reference database (NCBI_16S_18S_28S_ITS) may limit the accuracy of species-level taxonomic assignments, particularly for host-specific microbiota such as those of poultry. As such, species-level identifications should be interpreted cautiously. Future studies should consider the use of curated databases (e.g., SILVA or GTDB) and/or complementary validation approaches to improve taxonomic resolution and reliability.
CONCLUSION
GroPro® supplementation modulated immune and gut microbial indicators in starter-phase laying hens. The most evident immunological response was the increase in splenic CD4+ T-cell frequency, whereas CD8+ and CD45+ populations remained unchanged. Ileal microbiota analysis indicated that GroPro® preserved the core ileal microbial structure dominated by Bacillota and Lactobacillus, while promoting a broader distribution of beneficial lactic acid bacteria at genus and species levels. The significant increase in Shannon diversity suggests improved microbial balance, despite the absence of significant beta diversity separation. These results support GroPro® as a potential yeast-derived additive for enhancing early gut and immune development in young layers.
ACKNOWLEDGEMENTS
We would like to express sincere thanks to Angel Yeast Co., Ltd., China, for research funding and for their support during this work and UB for providing a scholarship during this Ph.D. study.
Novelty Statement
This study provides novel evidence that GroPro®️, a yeast-derived feed additive, modulates splenic immune markers and ileal gut microbiota in starter-phase laying hens without disrupting the core microbial community. The novelty lies in the integrated evaluation of immune (CD4⁺ T-cell frequency) and microbial responses, revealing that supplementation increases CD4⁺ expression and enhances Shannon diversity. Importantly, GroPro®️ promotes beneficial Lactobacillus species (L. johnsonii and L. kitasatonis) and expands genus-level diversity, indicating taxa-specific modulation rather than broad community restructuring. These findings support yeast-derived additives as targeted modulators of early gut and immune development in young layers.
AUTHOR’S CONTRIBUTION
Muhammad Sarmad contributed to the data collection and writing of the original manuscript. Osfar Sjofjan, Muhammad Halim Natsir, and Eko Widodo contributed to funding acquisition, investigation and supervision. Yuli Frita Nuningtyas and Feri Eko Hermanto contributed to the investigation, project administration, and resources. Feri Eko Hermanto contributed to the data analysis, methodology for the algorithm and software, writing of original manuscripts, and writing, review and editing. The authors read and approved the final manuscript.
Funding
This research was funded by Angel Yeast Co., Ltd., 168 Chengdong Avenue, Yichang, Hubei, 443003, P. R. China.
Ethical approval
This study was approved by the Animal Care and Use Committee, Faculty of Veterinary Medicine, Universitas Brawijaya, under ethical clearance number 51-KEP-FKHUB-2025, dated October 20, 2025.
Generative AI and AI assisted technology statement
The authors declare that no generative AI and AI assisted technology was used in the creation of this manuscript.
Conflict of interest
The authors declare that they have no conflicts of interest.
Figures
Figure 1:.
(A) Control and (B) Treatment Group using Gropro as feed additive showing CD4 cells in laying hen’s at starter phase.
Phylum-level microbial composition of gut microbiota in control and GroPro®-supplemented treatment groups. (A) Venn diagram showing the number of phyla detected in the analyzed groups, and (B) Stacked bar plot showing the relative abundance of phyla in the control and treatment groups based on the summed abundance of three
Figure 4:.
Genus-level microbial composition of gut microbiota in control and GroPro®-supplemented treatment groups. (A) Venn diagram showing the number of genera detected in the analyzed groups, and (B) Stacked bar plot showing the relative abundance of bacterial genera in the control and treatment groups based on the summed abundance of three replicates per group.
Figure 5:.
Species-level microbial composition of gut microbiota in control and GroPro®-supplemented treatment groups. (A) Venn diagram showing the number of bacterial species detected in the analyzed group, and (B) Stacked bar plot showing the relative abundance of dominant bacterial species in the control and treatment groups based on the summed abundance of three replicates per group.
Figure 6:.
Alpha diversity indices of gut microbiota in control and GroPro®-supplemented groups.
Boxplots show six alpha diversity indices, including Simpson’s index, Shannon index, Berger–Parker dominance index, Fisher’s alpha, Pielou’s evenness, and taxa richness. The control group is shown in blue, while the GroPro®-supplemented treatment group is shown in red. Each point represents an individual sample, with three samples per group. Statistical comparisons between groups were performed using an independent t-test.
Figure 7:.
Beta diversity analysis of gut microbiota in control and GroPro®-supplemented treatment groups. Non-metric multidimensional scaling (NMDS) ordination plots were generated using three distance matrices: Bray–Curtis, Jaccard, and Canberra. Each point represents an individual sample, with blue points indicating the control group and red points indicating the GroPro®-supplemented treatment group. Polygons represent the distribution area of samples within each group. Across all three distance matrices, the control and treatment groups showed partial overlap, indicating that GroPro® supplementation did not produce a clear separation in overall microbial community structure. This suggests that the treatment did not markedly alter global beta diversity, although taxa-specific microbial changes may still occur at the genus or species level.
References
Abd El-Ghany WA (2025). Yeasts and their derivatives as functional feed additives in poultry nutrition. Agriculture (Switzerland), 15(9): 1003. https://doi.org/10.3390/agriculture15091003[CrossRef]
Alagawany M, Bilal R, Elnesr S, Elwan H, Farag M, Dhama K, Naiel M (2023). Yeast in layer diets: its effect on production, health, egg composition and economics. World’s Poult. Sci. J., 79: 135–153. https://doi.org/10.1080/00439339.2023.2164235[CrossRef]
Ballou AL, Ali RA, Mendoza MA, Ellis JC, Hassan HM, Croom WJ, Koci MD (2016). Development of the chick microbiome: how early exposure influences future microbial diversity. Front. Vet. Sci., 3: 2. https://doi.org/10.3389/fvets.2016.00002[CrossRef]
Bilal RM, Hassan F, Saeed M, Ayasan T, Rashed N, Akhtar MU, Seidavi A (2020). Prospects of yeast based feed additives in poultry nutrition: Potential effects and applications. Indian J. Anim. Sci., 90(4): 495–505. https://doi.org/10.56093/ijans.v90i4.104177[CrossRef]
Bjerrum L, Engberg RM, Leser TD, Jensen BB, Finster K, Pedersen K (2006). Microbial community composition of the ileum and cecum of broiler chickens as revealed by molecular and culture-based techniques. Poult. Sci., 85(7): 1151–1164. https://doi.org/10.1093/ps/85.7.1151[CrossRef]
Cao L, Li J, Zhang J, Huang H, Gui F, Xu W, Zhang L, Bi S (2023). Beta-glucan enhanced immune response to Newcastle disease vaccine and changed mRNA expression of spleen in chickens. Poult. Sci., 102(2): 102414. https://doi.org/10.1016/j.psj.2022.102414[CrossRef]
Cerdán-Alduán M, Pastor Y, Conde-Álvarez R (2026). Yeast-derived postbiotics for prevention of enteric diseases in farm animals: Current insights and future perspectives. Vet. Sci., 13(3): 287. https://doi.org/10.3390/vetsci13030287[CrossRef]
Chen-Liaw A, Aggarwala V, Mogno I, Haifer C, Li Z, Eggers J, Helmus D, Hart A, Wehkamp J, Lamousé-Smith ES, Kerby RL (2025). Gut microbiota strain richness is species specific and affects engraftment. Nature, 637(8045): 422-429. https://doi.org/10.1038/s41586-024-08242-x[CrossRef]
De Coster W, Rademakers R (2023). NanoPack2: population-scale evaluation of long-read sequencing data. Bioinformatics, 39(5): btad311. https://doi.org/10.1093/bioinformatics/btad311[CrossRef]
Deryabin D, Lazebnik C, Vlasenko L, Karimov I, Kosyan D, Zatevalov A, Duskaev G (2024). Broiler chicken cecal microbiome and poultry farming productivity: A meta-analysis. Microorganisms, 12(4): 747. https://doi.org/10.3390/microorganisms12040747[CrossRef]
Dev K, Akbar Mir N, Biswas A, Kannoujia J, Begum J, Kant R (2020). Dietary mannan-oligosaccharides potentiate the beneficial effects of Bifidobacterium bifidum in broiler chicken. Lett. Appl. Microbiol., 71(5): 520–530. https://doi.org/10.1111/lam.13360[CrossRef]
Dibakoane S, Mnisi C, Mhlongo G, Wokadala O, Mlambo V (2025). Nucleotides as conditionally essential nutrients for optimal health, performance, and product quality in laying hens: A concise review. Discover Agric., 3: 315. https://doi.org/10.1007/s44279-025-00315-3[CrossRef]
Elahi U, Xu CC, Wang J, Lin J, Wu SG, Zhang HJ, Qi GH (2022). Insect meal as a feed ingredient for poultry. Anim. Biosci., 35(2): 332–346. https://doi.org/10.5713/ab.21.0435[CrossRef]
Garmyn A, Van de Velde N, Braeckmans D, Ronsmans S, Boyen F, Verlinden M (2020). An outbreak associated with Streptococcus equi subsp. zooepidemicus in layers: Evidence of fecal transmission. Avian Dis., 64(3): 343–346. https://doi.org/10.1637/aviandiseases-D-19-00191[CrossRef]
Ghasemian M, Jahanian R (2016). Dietary mannan-oligosaccharides supplementation could affect performance, immunocompetence, serum lipid metabolites, intestinal bacterial populations, and ileal nutrient digestibility in aged laying hens. Anim. Feed Sci. Technol., 213: 81–89. https://doi.org/10.1016/j.anifeedsci.2015.12.012[CrossRef]
Hermanto F, Nuningtyas Y, Nayan N, Nurdiansyah R, Marwi F, Natsir H (2026). Can nanoliquid formulation of Andrographis paniculata and Moringa oleifera extract serve as an alternative to antibiotics for improving broiler performance and gut microbiota modulation? J. Appl. Anim. Res., 54. https://doi.org/10.1080/09712119.2026.2641113[CrossRef]
Hermanto F, Soewondo A, Ibrahim M, Tsuboi H, Rifa’i M (2020). The hepatoprotective effect of Cheral as antioxidant and anti- inflammation on mice (Mus musculus) with breast cancer. J. Herbmed. Pharmacol., 9(2): 153-160. https://doi.org/10.34172/jhp.2020.20[CrossRef]
Hou Y, Wu Z, Dai Z, Wang G, Wu G (2017). Protein hydrolysates in animal nutrition: industrial production, bioactive peptides, and functional significance. J. Anim. Sci. Biotechnol., 8: 24. https://doi.org/10.1186/s40104-017-0153-9[CrossRef]
Jahanian R, Ashnagar M (2015). Effect of dietary supplementation of mannan-oligosaccharides on performance, blood metabolites, ileal nutrient digestibility, and gut microflora in Escherichia coli-challenged laying hens. Poult. Sci., 94(9): 2165–2172. https://doi.org/10.3382/ps/pev180[CrossRef]
Jansseune SC, Hendriks WH, Blanc F, Estellé J, Bruneau N, Coville JL, Pinard-van der Laan MH (2025). A lactobacilli-based probiotic but not its postbiotic reduces intestinal inflammatory pathways expression in broilers fed a non-starch polysaccharide rich challenge diet. Poult. Sci., 106159. https://doi.org/10.1016/j.psj.2025.106159[CrossRef]
Jin M, Xu F, Liu Y, Jiang Z (2026). Limosilactobacillus fermentum LF61: A multidimensional study on safety and functionality from genomics to clinical application. Food Chem. Toxicol., 116002. https://doi.org/10.1016/j.fct.2026.116002[CrossRef]
Jin Y, Arain MA, Buzdar JA, Liu G (2026). Lactic acid bacteria in poultry industry: Health beneficial prospects and potential applications-a review. World’s Poult. Sci. J., 82(1): 129-158. https://doi.org/10.1080/00439339.2025.2600419[CrossRef]
Johnson TJ, Youmans BP, Noll S, Cardona C, Evans NP, Karnezos TP, Ngunjiri JM, Abundo MC, Lee CW (2018). A consistent and predictable commercial broiler chicken bacterial microbiota in antibiotic-free production displays strong correlations with performance. Appl. Environ. Microbiol., 84(12). https://doi.org/10.1128/AEM.00362-18[CrossRef]
Jones FT, Ricke SC (2003). Observations on the history of the development of antimicrobials and their use in poultry feeds. Poult. Sci., 82(4): 613–617. https://doi.org/10.1093/ps/82.4.613[CrossRef]
Kiran F, Demirhan HK, Sevin S (2026). Probiotic potential of lactic acid bacteria isolated from canine and feline microbiota: functional profiling and host-adapted benefits. Vet. Res. Commun., 50(4): 300. https://doi.org/10.1007/s11259-026-11242-z[CrossRef]
Krawczyk B, Wityk, P, Gałęcka M, Michalik M 2021. The many faces of Enterococcus spp. commensal, probiotic and opportunistic pathogen. Microorganisms, 9(9): 91900. https://doi.org/10.3390/microorganisms9091900[CrossRef]
Krzyściak W, Pluskwa KK, Jurczak A, Kościelniak D (2013). The pathogenicity of the Streptococcus genus. Eur. J. Clin. Microbiol. Infect. Dis., 32(11): 1361-1376, 1914-9 https://doi.org/10.1007/s10096-013-1914-9[CrossRef]
Leite P, Leandro N, Mello H, Café M, Oliveira E, Pereira M (2019). Digestible lysine levels for grower phase brown egg layers. Sci. Anim. Hlth., 6: 156. https://doi.org/10.15210/sah.v6i2.12457[CrossRef]
Li S, Li C, Chen S, Wang X, Liu J, Deng X, Cai H, Liu G (2023). Effects of solid-state fermentation on the standardized ileal digestibility of amino acids and apparent metabolizable energy in peanut meal fed to broiler chickens. Fermentation, 9(4): 346. https://doi.org/10.3390/fermentation9040346[CrossRef]
Lisnahan CV, Nahak OR (2020). Growth performance and small intestinal morphology of native chickens after feed supplementation with tryptophan and threonine during the starter phase. Vet. World, 13(12): 2765–2771. https://doi.org/10.14202/vetworld.2020.2765-2771[CrossRef]
Liu L, Li Q, Yang Y, Guo A (2021). Biological function of short-chain fatty acids and its regulation on intestinal health of poultry. Front. Vet. Sci., 8: 736739. https://doi.org/10.3389/fvets.2021.736739[CrossRef]
Lourenço, M. C., L N Kuritza, Hayashi RM, Miglino LB, Durau JF, Pickler L, Santin E (2015). Effect of a mannanoligosaccharide-supplemented diet on intestinal mucosa T. lymphocyte populations in chickens challenged with Salmonella enteritidis. J. Appl. Poult. Res., 24(1): 15–22. https://doi.org/10.3382/japr/pfu002.[CrossRef]
Luo X, Chen Y, Xiao Y, Hu Y, Feng Y (2025). Overall assessment of antimicrobial peptides in broiler chickens: A meta-analysis. Poult. Sci., 105623. https://doi.org/10.1016/j.psj.2025.105623[CrossRef]
Mio K, Otake N, Nakashima S, Matsuoka T, Aoe S (2021). Ingestion of high β-glucan barley flour enhances the intestinal immune system of diet-induced obese mice by prebiotic effects. Nutrients, 13(3): 907. https://doi.org/10.3390/nu13030907[CrossRef]
Oakley BB, Kogut MH (2016). Spatial and temporal changes in the broiler chicken cecal and fecal microbiomes and correlations of bacterial taxa with cytokine gene expression. Front. Vet. Sci., 3: 11. https://doi.org/10.3389/fvets.2016.00011[CrossRef]
Pandit RJ, Hinsu AT, Patel NV, Koringa PG, Jakhesara SJ, Thakkar JR, Shah TM, Limon G, Psifidi A, Guitian J, Hume DA, Tomley FM, Rank DN, Raman M, Tirumurugaan KG, Blake DP, Joshi CG (2018). Microbial diversity and community composition of caecal microbiota in commercial and indigenous Indian chickens determined using 16 s rDNA amplicon sequencing. Microbiome, 6(1): 115. https://doi.org/10.1186/s40168-018-0501-9[CrossRef]
Perricone V, Sandrini S, Irshad N, Savoini G, Comi M, Agazzi A (2022). Yeast-derived products: the role of hydrolysed yeast and yeast culture in poultry nutrition-a review. Animals, 12(11). https://doi.org/10.3390/ani12111426[CrossRef]
Pu Y, Zhou X, Cai H, Lou T, Liu C, Kong M, Sun Z, Wang Y, Zhang R, Zhu Y, Ye L, Zheng Y, Zhu B, Quan Z, Zhao G, Zheng Y (2025). Impact of DNA extraction methods on gut microbiome profiles: A comparative metagenomic study. Phenomics (Cham, Switzerland), 5(1): 76–90. https://doi.org/10.1007/s43657-025-00232-x[CrossRef]
Ricke SC, Dittoe DK, Olson EG (2022). Microbiome applications for laying hen performance and egg production. Poult. Sci., 101(5): 101784. https://doi.org/10.1016/j.psj.2022.101784[CrossRef]
Saint-Martin V, Quéré P, Trapp S, Guabiraba R (2022). Uncovering the core principles of the gut-lung axis to enhance innate immunity in the chicken. Front. Immunol., 13: 956670. https://doi.org/10.3389/fimmu.2022.956670[CrossRef]
Sartono HGM, Hermanto FE, Sjofjan O, Nuningtyas YF, Jatmiko YD, Alimon AR, Natsir MH (2025). Prebiotic effects of Amorphophallus muelleri on growth performance and gut microbiota in broilers. Cogent Food Agric., 11(1): 2566900. https://doi.org/10.1080/23311932.2025.2566900[CrossRef]
Schwartz B, Vetvicka V (2021). Review: β-glucans as effective antibiotic alternatives in poultry. Molecules, 26(12). https://doi.org/10.3390/molecules26123560[CrossRef]
Selvaraj RK (2013). Avian CD4(+) CD25(+) regulatory T cells: properties and therapeutic applications. Dev. Comp. Immunol., 41(3): 397–402. https://doi.org/10.1016/j.dci.2013.04.018[CrossRef]
Sharma N (2025). Exploring the potential of mannan oligosaccharides in enhancing animal growth, immunity, and overall health: A review. Carbohydr. Polym. Technol. Appl., 9: 100603. https://doi.org/10.1016/j.carpta.2024.100603[CrossRef]
Simeneh G (2019). Review on the effect of feed and feeding on chicken performance. 3. https://doi.org/10.15761/AHDVS.1000171[CrossRef]
Taylor N (2026). Angel Yeast Co., Ltd. Beyond digestive health: modulating the gut microbiota with yeast beta-glucan to drive body-wide effects. https://en.angelyeast.com/blog/human-health/beyond-digestive-health-modulating-the-gut-microbiota-with-yeast-beta-glucan-to-drive-body-wide-effects.html.
Tian X, Shao Y, Wang Z, Guo Y (2016). Effects of dietary yeast β-glucans supplementation on growth performance, gut morphology, intestinal Clostridium perfringens population and immune response of broiler chickens challenged with necrotic enteritis. Anim. Feed Sci. Technol., 215: 144–155. https://doi.org/10.1016/j.anifeedsci.2016.03.009[CrossRef]
Van Boeckel TP, Brower C, Gilbert M, Grenfell BT, Levin SA, Robinson TP, Teillant A, Laxminarayan R (2015). Global trends in antimicrobial use in food animals. Proc. Natl. Acad. Sci. U.S.A., 112(18): 5649–5654. https://doi.org/10.1073/pnas.1503141112[CrossRef]
Walters KE, Martiny JB (2020). Alpha-, beta-, and gamma-diversity of bacteria varies across habitats. PLoS One, 15(9): e0233872. https://doi.org/10.1371/journal.pone.0233872[CrossRef]
Wood DE, Lu J, Langmead B (2019). Improved metagenomic analysis with Kraken 2. Genome Biol., 20(1): 257. https://doi.org/10.1186/s13059-019-1891-0[CrossRef]
Xie Y, Xu S, Xi Y, Li Z, Zuo E, Xing K, Bai L, Li K (2024). Global meta‐analysis reveals the drivers of gut microbiome variation across vertebrates. Imetaomics, 1(2): e35. https://doi.org/10.1002/imo2.35[CrossRef]
Yang T, Li T, Xing Y, Cao M, Zhang M, Leng Q, Qiu J, Song X, Chen J, Hu G, Qian Y (2024). Dietary nucleic acids promote oral tolerance through innate sensing pathways in mice. Nat. Commun., 15(1): 9461. https://doi.org/10.1038/s41467-024-53814-0[CrossRef]
Yeast A (2025). GroPro: enhancing the health and vitality of layer chicks. https://www.allaboutfeed.net/animal-feed/feed-per-species/gropro-enhancing-the-health-and-vitality-of-layer-chicks/. Accessed on July 7, 2026.
Zhao XY, Zhang Y, He W, Wei Y, Han SS, Xia L, Tan B, Yu J, Kang H, Mengen, Zhu Q, Yin H, Cui C (2022). Effects of small peptide supplementation on growth performance, intestinal barrier of laying hens during the brooding and growing periods. Front. Immunol., 13. https://doi.org/10.3389/fimmu.2022.925256[CrossRef]
Zhen W, Liu Y, Shao Y, Ma Y, Wu Y, Guo F, Abbas W, Guo Y, Wang Z (2021). Yeast β-glucan altered intestinal microbiome and metabolome in older hens. Front. Microbiol., 12. https://doi.org/10.3389/fmicb.2021.766878[CrossRef]
Zhen W, Shao Y, Wu Y, Li L, Pham VH, Abbas W, Wan Z, Guo Y, Wang Z (2020). Dietary yeast β-glucan supplementation improves eggshell color and fertile eggs hatchability as well as enhances immune functions in breeder laying hens. Int. J. Biol. Macromol., 159: 607–621. https://doi.org/10.1016/j.ijbiomac.2020.05.134[CrossRef]
Zhou J, Fu Y, Qi G, Dai J, Zhang H, Wang J, Wu S (2023). Yeast cell-wall polysaccharides improve immunity and attenuate inflammatory response by modulating gut microbiota in LPS-challenged laying hens. Int. J. Biol. Macromol., 224: 407–421. https://doi.org/10.1016/j.ijbiomac.2022.10.133[CrossRef]
Brevibacterium pigmentatum
Brevibacterium siliguriense
Corynebacterium glutamicum
Corynebacterium humireducens
Corynebacterium sphenisci
Ornithinibacillus heyuanensis
Salibacterium halotolerans
Lactobacillus acetotolerans
Lactobacillus acidophilus
Lactobacillus amylolyticus
Lactobacillus delbrueckii
Lactobacillus equicursoris
Lactobacillus intestinalis
Lactobacillus kefiranofaciens
Lactobacillus kitasatonis
Lactobacillus kullabergensis
Lactobacillus melliventris
Table continues on next page................
Lactobacillus paragasseri
Lactobacillus selangorensis
Lactobacillus taiwanensis
Lactobacillus xujianguonis
Ligilactobacillus aviarius
Ligilactobacillus saerimneri
Ligilactobacillus salivarius
Limosilactobacillus antri
Limosilactobacillus coleohominis
Limosilactobacillus equigenerosi
Limosilactobacillus fastidiosus
Limosilactobacillus fermentum
Limosilactobacillus frumenti
Limosilactobacillus ingluviei
Limosilactobacillus mucosae
Limosilactobacillus panis
Limosilactobacillus pontis
Limosilactobacillus reuteri
Limosilactobacillus rudii
Limosilactobacillus secaliphilus
Limosilactobacillus vaginalis
Periweissella cryptocerci
Secundilactobacillus angelensis
Streptococcus caledonicus
Streptococcus chenjunshii
Streptococcus dentiloxodontae
Streptococcus hyovaginalis
Streptococcus pantholopis
Clostridium cellulovorans
Clostridium chromiireducens
Table continues on next column................
Clostridium jeddahitimonense
Clostridium manihotivorum
Clostridium prolinivorans
Cellulosilyticum lentocellum
Asaccharospora irregularis
Intestinibacter bartlettii
Metaclostridioides mangenotii
Peptacetobacter hiranonis
Candidatus Peptostreptococcus massiliensis
Romboutsia lituseburensis
Tepidibacter formicigenes
Alkalithermobacter paradoxus
Alkalithermobacter thermoalcaliphilus
Sporacetigenium mesophilum
Fervidobacterium riparium
Limisphaera ngatamarikiensis
Corynebacterium stationis
Table continues on next page................
Enterococcus hermanniensis
Enterococcus saccharolyticus
Streptococcus acidominimus
Streptococcus alactolyticus
Streptococcus constellatus
Streptococcus gallolyticus
Streptococcus infantarius
Streptococcus vestibularis
Clostridium fermenticellae
Clostridium paraputrificum
Table continues on next page................
Niameybacter massiliensis
Peptoanaerobacter stomatis
Faecalimicrobium dakarense
Paraclostridium sordellii
Peptostreptococcus anaerobius
Peptostreptococcus russellii
Terrisporobacter glycolicus
Terrisporobacter mayombei
Terrisporobacter petrolearius
Note: The abundance values were obtained by summing all of the abundance value of each replication for every group (n=3 per group).