
The Sahiwal breed of dairy cattle holds significant importance in Pakistan, mostly attributed to its ability to withstand high temperatures, resilience to diseases, and satisfactory performance when fed low-quality roughages. Domestication and breeding of mammals have exerted a consistent selection pressure on a wide range of characteristics in many domesticated species, resulting in discernible genetic modifications at the individual genome level. The study aimed to discover and analyze potential indicators of recent selection in Sahiwal cattle, specifically identifying the genes and quantitative trait loci associated with these selection indicators. The study utilized a sample size of 98 Sahiwal bulls. The genotyping of all animals was conducted using the BovineHD140k BeadChip. After undergoing quality control measures, 87 samples as well as 74,070 SNPs located throughout 29 autosomes were selected as well as included in the study. The selection signatures were examined using the iHS and the Tajima D approach. The result reveals the current positive selections on BTA 1, 2, 6, 11, 12, 15, 17, 21, and 27 with the iHS test, while for the Tajima D test, the current positive selections were detected on BTA 1, 2, 3, 4, 5, 6, 7, 9, 10, 14, 18, 20, 23, and 24. A total of 47 genes were detected within selection regions associated with vital economic traits. The QTL enrichment analysis has shown eight substantial QTLs in BTA19 and BTA20 linked with milk, production, as well as reproduction traits. Therefore, understanding the selection signatures and candidate genes that influence important economic traits can provide foundational knowledge that can be used effectively to gain insight into the underlying mechanisms controlling these traits in Sahiwal cattle.
Research Article · Volume 56, Issue 4, 22 May 2024 · Open Access
Genome-Wide Assessment of Signatures of Selection in the Pakistan Sahiwal Cattle
· · ·
Affiliations & Notes ⌄
- 1Institute of Animal and Dairy Sciences, Faculty of Animal Husbandry, University of Agriculture, Faisalabad, Pakistan 2Department of Animal Science, School of Agriculture, Njala University, Freetown, Sierra Leone 3Centre of Agricultural Biochemistry and Biotechnology, University of Agriculture, Faisalabad, Pakistan * Corresponding author: dr.saifurrehman@uaf.edu.pk
Article Info ⌄
- Journal:
- Pakistan Journal of Zoology
- Published:
- 22 May 2024

From the article
- The study findings revealed many genomic regions and several novel genes that exhibited positive selection in the Sahiwal cattle for both the test (iHS and Tajima’s D) used in the study.
- The study also observed that the Sahiwal cattle population has low milk-type QTLs of 25.08%, indicating that the population is not under intense selection for milk production traits.
- Therefore, understanding the selection signatures and candidate genes that influence important economic traits can provide foundational knowledge that can be used effectively to gain insight into the underlying mechanisms controlling these traits in Sahiwal cattle.
- Additionally, the results might serve as a basis for further investigation of economically vital traits linked to milk production in Sahiwal cattle.
Selected from the article's own text.
Abstract
INTRODUCTION
The Sahiwal cattle breed originated in the central Punjab district of Pakistan. The breed is named after the Sahiwal district, part of its home track ; ; . They are members of a category of giant Zebu breeds known as dual purpose. Due to its higher milk production and growth capacity than other Zebu cattle breeds, it is primarily used for milk and meat production ; . The Sahiwal breed of dairy cattle holds significant importance in Pakistan, mostly attributed to its ability to withstand high temperatures, resilience to diseases, and satisfactory performance when fed low-quality roughages ; . Sahiwal cattle have been widely included in crossbreeding initiatives on a global scale due to their superior milk production attributes and remarkable resilience under adverse ecological conditions ; ; . The use of selective breeding and genetic isolation contributes to the development of many breeds of cattle and aids in the preservation of genomic resources and the retention of adaptive traits adapted to specific local conditions ; ; . Artificial selection has been shown to improve the prevalence of advantageous alleles associated with economic traits, facilitating the enhancement of production parameters ; . Domestication and breeding of mammals have exerted consistent selection pressure on a wide range of characteristics in many domesticated species, resulting in discernible genetic modifications at the individual genome level ; . The genomic regions under selection pressure shows a functional variation associated with the traits ; .
In Pakistan, researchers have been employing the progeny testing program as part of a selection effort to increase the milk production capacity of Sahiwal cattle for decades under the coordination of the Research Centre for Conservation of Indigenous Breeds (RCCIB), Jhang . The program involves registering and documenting institutional and private herds of Sahiwal cattle, recording for genetic evaluation, and identifying superior germplasm for genetic evaluation . However, applying for a conventional progeny testing program under Pakistani conditions appears to be difficult due to the small size of the herd, low awareness among the farmer community about pedigree and performance recording, resource limitations, and a lack of fundamental infrastructure ; . Thus, the efficiency of the Sahiwal cattle has not improved much over the years ; . The efficiency of the Sahiwal breed can be enhanced by improving nutrition and management practices, estimating genetic parameters, and identifying the genes as well as quantitative trait loci linked with vital economic traits and subsequence genomic selection for such genes ; ; . Thus, genomic areas of Sahiwal cattle will continue to experience intense selective pressures for an extended period as the quest to select the best animals with high milk production capability continues in the country ; . The existing body of literature on the outcome of selection on the Pakistan Sahiwal cattle remains limited at present. Hence, it is imperative to investigate and explore the genomic signatures of selection in Sahiwal cattle to comprehend the molecular mechanisms that influence quantitative as well as other significant traits ; Zhang et al., 2022b; . Additionally, annotating the genes and quantitative trait loci (QTL) linked with economically vital traits is crucial ; Zhang et al., 2022b).
Selection signatures refer to distinct genetic variations that occur at the DNA level as a result of deviations in the genomes of the chosen as well as neutral loci within a species that has experienced selection over time . Selection signatures are found in species subjected to selection during their evolution ; . Variants subjected to selection pressure can cause characteristic genomic patterns to emerge, including a change in the distribution of allele frequencies, an increase in the proportion of homozygous genotypes, the prevalence of long haplotypes, and a significant degree of population substructure ; . Modern cattle have undergone extensive selection over the centuries, resulting in dramatic phenotypic changes in the last 40 years ; ; . The development of affordable genotyping techniques has allowed more individuals to genotype using different densities of single nucleotide polymorphism (SNP) arrays ; ; . New polymorphism data and the subsequent release of the bovine genome sequence have provided useful new resources for the search for evidence of recent selection in the bovine genome ; . This has improved precision and accuracy in identifying specific genomic areas in cattle ; . These advances have also contributed to identifying and analyzing genetic variations subject to natural selection in Homo sapiens as well as other animal species ; . When an allele experiences positive selection, it experiences a selective sweep when it becomes more common in the population ; . Genetic hitch-hiking is the process through which closely related alleles increase frequency along with the positively chosen allele . An area of the genome where the positively selected haplotype is more prevalent due to a strong selection sweep would have less haplotype diversity . Measuring LD or checking whether a haplotype is over-represented in a population are good ways to look for evidence of a selective sweep (Hayes, 2007; Zhang et al., 2022a).
Several different statistical models have been created to identify signs of selection. Several studies have been performed to detect the signatures of selection using several statistical techniques, such as the integrated haplotype score (iHS) , Tajima’s D , fixation index (FST) , and the extended haplotype homozygosity (EHH) . These studies use methods complementarity to improve statistical power ; . The iHS and Tajima’s D estimators are especially helpful among the numerous statistics used to recognize signs of positive selection from polymorphism data and would be the techniques of choice in this investigation ; . The discovery of genomic areas under selection pressure has the potential to improve our comprehension of the underlying biology of certain phenotypes. This knowledge may be used to build techniques to improve selection efficiency . Therefore, the study aimed to discover and analyze potential indicators of recent selection in Sahiwal cattle, specifically identifying the genes and quantitative trait loci (QTL) linked with these selection indicators.
MATERIALS AND METHODS
Animal resources and SNP genotyping
The study’s sample size consisted of 98 Sahiwal cattle bulls, which were sourced from public as well as private livestock farms in the Punjab area of Pakistan. Blood samples were collected from all the 98 Sahiwal cattle bulls. The researchers employed a salting-out method to extract genomic DNA from blood samples, as described by Miller et al. (1988). The NanoDrop ND-1000 spectrophotometer, manufactured by NanoDrop Technologies in Wilmington, DE, was utilized to quantify the concentration of the isolated DNA. Good quality DNA samples were sent for genotyping utilizing the BovineHD140k Bead Chip (Illumina Inc. in San Diego, California, USA) following the standard operating procedure described by the manufacturer. Raw data was processed to generate ped files that provide genotypes and map files having a genomic location of markers.
Quality control
The PLINK program conducted quality control assessments on genotyping data. The research study opted for a call rate exceeding 95% for the collection of study data as well as subsequent analysis. The study employed SNPs with minor allele frequencies (MAFs) below 0.05. The analysis of the study included the examination of markers and animals, which did not exhibit a substantial divergence from Hardy-Weinberg proportions (P > 0.001, Bonferroni corrected). The analysis exclusively incorporated SNPs that were identified within autosomal chromosomes. Furthermore, samples that exhibited a missing genotyping rate exceeding 10% were excluded from the analysis. SNPs were subjected to a filtering process in order to exclude loci that were allocated to unmapped contigs and chromosomes associated with sexual determination. After undergoing quality control procedures, a total of 87 samples and 74,070 SNPs were deemed suitable for further analysis. These SNPs were distributed over the 29 autosomes.
Calculation of the integrated haplotype score
The rehh package in R Software was utilized to analyze the integrated haplotype score (iHS) test. The iHS score is derived from the assessment of extended haplotype homozygosity (EHH) linked to each allele. The computation of single-site iHS values was performed for each animal throughout the whole genome. These values were then averaged in non-overlapping windows of 500 kb throughout the genome. The window size was adapted on the bases of the extent of LD as defined by Qanbari et al. (2011). The unstandardized iHS can be obtained by using the following calculation:

Where iHHA as well as iHHD signify the integrated EHH score for ancestral as well as derived core alleles, separately. This value has been normalized such that the mean is 0 and the standard deviation is 1, and this is done regardless of the allele frequency at the core SNP .
The standardized iHS was computed as follows:
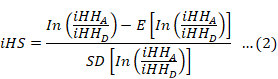
In this context, iHHA and iHHD denote the integrated EHH score for ancestral (A) and derived (D) core alleles, while E and SD reflect the expectation and standard deviation of unstandardized iHS, respectively. To determine the P value at the genome level, the iHS scores for each single nucleotide polymorphism (SNP) were subjected to a subsequent transformation. This transformation involved calculating the p iHS = − log [1 − 2|Φ(iHS) − 0.5|]. The function Φ(x) denotes the Gaussian cumulative distribution function in the context of neutrality, whereas p iHS refers to the two-sided P-value linked to the neutral hypothesis .
Tajima’s D statistics
Tajima’s D statistics were also computed for each chromosome utilizing the vcftools software . The Tajima D index was calculated using nonoverlapping sliding windows of 100 MB as a parameter (Tajima D 100). Within each bin, the p-values were calculated and given to each SNP. Zero was substituted for any missing values.
Identification of functional genes and QTL
SNPs exhibiting statistically significant iHS and Tajima D values were analyzed utilizing the ARS-UCD1.2 assembly as well as Ensembl Genome Browser databases. This analysis aimed to discover QTL genes or neighboring genes associated with these SNPs. The genes and QTLs were acquired from the ARS-UCD1.2 assembly as well as the Animal QTL database , respectively, in the gtf and gff formats. The study utilized Panther databases to document the molecular functions and biological processes associated with the discovered genes. The QTL animal database (available at https://www.animalgenome.org/cgi-bin/QTLdb/BT/index) was utilized to ascertain the QTL reported in the literature for each specific candidate region. The gene as well as QTL annotations were conducted with the R package GALLO . The enrichment analysis of QTLs was performed on all QTLs annotated using the chromosome-based technique, utilizing the GALLO program. Implementing a bootstrap approach involved conducting a correlation analysis between the observed as well as expected number of QTLs per characteristic, using data obtained from the cattle QTL database. The p-values derived from the enrichment analysis were adjusted utilizing the false discovery rate (FDR) approach. A significance threshold of less than 5% was used to accommodate for the numerous tests conducted. Gene ontology and pathway analyses were performed using the TOPGO and KEGGREST packages in R software.
RESULTS
Genome-wide distribution of iHS
The iHS distribution exhibited a close approximation to normality, as indicated by iHS ~ N (0, 1). Consequently, it was possible to make comparisons between the markers and the chromosomes (Fig. 1). The unstandardized IHS within frequency bins (IHS-b) was used to identify the selection signatures in dairy cattle (Fig. 2). The IHS-b was calculated for each SNP within each frequency bin. The frequency bins were created by dividing the range of possible frequencies into equal intervals. The IHS-b was then calculated for each frequency bin. The SNPs with the highest IHS-b values were identified as signature SNPs.
Integrated haplotype score (iHS) test
Figure 3 shows the distribution of iHS by chromosome, while Figure 4 shows the alteration of analogous markers into piHS. The iHS statistic was plotted against the genomic location of the breed to visually represent the distribution of outlier signals across chromosomes. Since the iHS test found many important signals, we used the maximum iHS and piHS values to assess genes in the target genomic regions. Considering the iHS values, the genomic regions under the recent signatures of selection were found on BTA 1, 2, 6, 11, 12, 15, 17, 21, and 27 (Table I). The most convincing evidence of selection in the Sahiwal cattle is on BTA6 with an iHS score of -5.23 as well as on BTA27 with an iHS score of -5.58.
Table I. Genomic autosomal regions and potential genes identified by the integrated haplotype score (iHS) test under the indication of the signature of selection in Sahiwal cattle.
| Chromosome | Position | Candidate gene | iHS | PiHS |
| 1 | 132552990 | PPP2R3A | -4.019491072 | 4.234152759 |
| 2 | 26259557 | UBR3 | -4.035439883 | 4.263602754 |
| 2 | 59837978 | THSD7B | -4.533780388 | 5.237041985 |
| 2 | 92923678 | PARD3B | -4.268678484 | 4.706340383 |
| 6 | 13502824 | AP1AR | -5.238324881 | 6.790376077 |
| 6 | 21884446 | CENPE | -4.852971281 | 5.914976041 |
| 6 | 22334879 | MANBA | -4.526024536 | 5.221099479 |
| 6 | 22363715 | MANBA | -4.26626077 | 4.70163512 |
| 6 | 22695313 | SLC39A8 | -4.210045351 | 4.59291613 |
| 11 | 45961342 | CHCHD5 | -4.824651776 | 5.853103064 |
| 11 | 45985907 | CHCHD5 | -4.829806865 | 5.864340963 |
| 11 | 47097519 | EIF2AK3 | -4.145736881 | 4.470155805 |
| 12 | 82530142 | NALF1 | -4.489584574 | 5.146531708 |
| 15 | 7365780 | ATG13 | -4.713396119 | 5.613283588 |
| 17 | 40308609 | FAT4 | -4.301386566 | 4.770234589 |
| 21 | 57523947 | CHGA | -4.19035223 | 4.555140878 |
| 27 | 3658384 | CSMD1 | -4.272224754 | 4.713246396 |
| 27 | 13371357 | TENM3 | -4.738578572 | 5.667112173 |
| 27 | 13376444 | TENM3 | -5.581677719 | 7.623040968 |
Tajima’s D statistics
Most autosomes exhibited at least one significant signal of selection (Fig. 5), and high Tajima D values were found to be under positive selection in various contexts. The study only considered negative values representing current positive selection signals. Tajima’s D test found significant selection signals in 51 genomic regions. Current signals of positive selection were detected on BTA 1, 2, 3, 4, 5, 6, 7, 9, 18, 20, 23, and 24. Tajima’s D signals comprised 31 candidate genes (Table II). Furthermore, the 31 genes identified within the selection regions are linked with milk composition traits like milk protein yield, milk alpha casein percentage, milk fat percentage, milk fat yield, milk alpha-lactalbumin percentage, milk protein percentage, as well as milk beta-casein percentage according to previous reports.
Table II. Genomic autosomal region and potential genes identified by Tajima’s D test under the indication of a positive signature of selection in Sahiwal cattle.
| Chromosomes | Start position | End position | Candidate gene | Trait |
| 1 | 29105747 | 29418948 | GBE1 | Milk protein yield |
| 1 | 1643680 | 1651038 | ATP5PO | |
| 1 | 3498977 | 3629442 | HUNK | |
| 1 | 20991748 | 21009134 | LOC112447287 | |
| 1 | 4925473 | 4926072 | LOC112446980 | |
| 1 | 57125817 | 57206343 | CD200 | |
| 1 | 98873841 | 98873935 | MIR551B | Milk alpha casein percentage |
| 1 | 1.35E+08 | 1.35E+08 | ANAPC13 | |
| 1 | 1.32E+08 | 1.32E+08 | LOC112448286 | |
| 1 | 1.26E+08 | 1.26E+08 | PAQR9 | |
| 1 | 1.56E+08 | 1.57E+08 | KCNH8 | Milk fat content |
| 2 | 1.27E+08 | 1.27E+08 | STMN1 | Milk fat yield |
| 2 | 47961935 | 48181188 | LOC107132255 | |
| 2 | 44432998 | 44652244 | NEB | |
| 2 | 1.32E+08 | 1.32E+08 | UBXN10 | |
| 2 | 1.04E+08 | 1.04E+08 | SMARCAL1 | |
| 2 | 23404603 | 23571295 | MAP3K20 | |
| 3 | 51855689 | 51880658 | CDC7 | Milk protein yield |
| 3 | 30206039 | 30268283 | LRIG2 | Milk protein percentage |
| 5 | 98993095 | 99048504 | LOC101902742 | Milk alpha lactalbumin percentage |
| 6 | 55443414 | 55635282 | ARAP2 | Milk protein percentage |
| 7 | 328408 | 329337 | LOC107131408 | Milk fat yield |
| 7 | 23975396 | 24263996 | CHSY3 | Milk beta casein percentage |
| 9 | 32590633 | 33013293 | SLC35F1 | Milk fat yield |
| 14 | 22640320 | 22957122 | XKR4 | Milk fat percentage |
| 18 | 43093119 | 43130616 | ANKRD27 | Milk fat yield |
| 20 | 21798316 | 21799446 | ACTBL2 | |
| 20 | 4596537 | 4709460 | ERGIC1 | |
| 20 | 27974735 | 27974841 | LOC112443073 | |
| 23 | 39178908 | 39266796 | RNF144B | |
| 24 | 27152147 | 27152251 | LOC112444247 | Milk fat content |
Analysis of QTL identification
The study identified significant genomic regions consisting of 25.08% of milk-type QTLs in Sahiwal cattle as well as other QTLs associated with traits like meat as well as carcass, production, health, reproduction, as well as exterior, which were annotated and represented 21.54, 18.72, 13.85, 11.05, and 9.76%, respectively (Fig. 6). Milk-type QTLs included loci associated with milk protein yield, milk yield, milking speed, milk beta-casein content, milk energy yield, stearic acid content, milk oleic acid content, milk kappa-casein percentage, curd firming rate, milk caproic acid content, milk alpha-casein content, milk alpha-S2-casein percentage, milk casein content, milk color, milk kappa-casein content, milk protein content, milk odd-chain fatty acid percentage, milk palmitoleic acid content, milk saturated to unsaturated fatty acid ration, and milk whey protein content (Fig. 7).
QTL enrichment analysis
The QTL enrichment analysis was done to obtain unprejudiced data on the significant QTLs in the population instead of doing the QTL annotation. The QTL enrichment analysis has shown 8 substantial QTLs on BTA19 and BTA20, which are linked with milk, production, as well as reproduction traits (Table III). The utmost substantial QTLs were mapped on BTA19 andBTA20, linked with fat percentage, fertilization rate, milk fat yield, early embryonic survival, body depth, body weight, and average daily gain (Fig. 8). Intriguingly, the highest significant QTL identified on BTA19 was linked with milk fat yield as well as fat percentage.
Table III. The enriched QTLs were annotated in the assumed genomic areas.
| Trait | Chromosome | Number of QTLs | Number of annotated QTLs | p-value |
| Milk | 19 | 16 | 321 | 0.040234 |
| 19 | 12 | 321 | 0.046226 | |
| Production | 19 | 22 | 321 | 0.000171 |
| 20 | 19 | 210 | 0.008069 | |
| 19 | 11 | 321 | 0.013937 | |
| 19 | 8 | 321 | 0.045253 | |
| Reproduction | 19 | 12 | 321 | 0.009393 |
| 19 | 10 | 321 | 0.020660 |
Gene enrichment analysis for iHS
The gene ontology (GO) enrichment analysis of the significant genes of the iHS scores was categorized into biological processes (Fig. 9A), molecular function (Fig. 9B), and cellular components (Fig. 9C). The GO enrichment analysis revealed 30 biological processes, 6 molecular functions, and 22 cellular components for the iHS test.
Gene enrichment analysis for Tajima D
The gene ontology (GO) enrichment analysis of the significant genes of the Tajima’s D test was categorized into biological processes (Fig. 10A), molecular function (Fig. 10B), and cellular components (Fig. 10C). The GO enrichment analysis revealed 19 biological processes, 13 molecular functions, and 8 cellular components for Tajima’s D test.
DISCUSSION
The study investigated the signature of selection in the genomes of Sahiwal cattle utilizing two methods (iHS and Tajima D). Considering iHS values, the regions on BTA 1, 2, 6, 11, 12, 15, 17, 21, and 27 are under the recent signatures of selection (Table I). The study observed recent signatures of selection on BTA 1, 2, 3, 4, 5, 6, 7, 9, 14, 18, 20, 23, and 24 with Tajima’s D test (Table II). This study also noticed results that were similar to those observed by other researchers. In Thai dairy cattle, Buaban et al. (2022) found that regions associated with milk production traits were located on BTA 1, 2, 3, 4, 5, 6, 7, 9, 11, 12, 13, 14, 15, 16, 20, 21, 26, 27, and 29. Kolbehdari et al. (2009) performed a whole genome scan on Canadian Holstein bulls to identify QTL for milk production characteristics and somatic cell score. Their research identified map QTL significantly associated with protein yield in six SNP at the genome level, and nine at the chromosome level on BTA 1, 4, 7, 8, 9, 11, 14, 18, 21, 23, 26 and 28; 13 SNP significantly related to fat yield at the genome level, and7 at the chromosome level on BTA 1, 4, 5, 7, 10, 11, 14, 21, 23, 24 and 28; 6 and 12 SNP that were significantly associated with the fat percentage in the genome were found on BTA 3, 6, 9, 10, 14, 17, 21, 23, and 26; and one SNP at genomic and 9 SNPs at the chromosome level were found on BTA 3, 4, 5, 10, 13, 17, 22, and 23 for the percentage of protein. In a whole genome evaluation of recent selection signatures in Sarabi cattle from Iran, Moradian et al. (2020) identified statistically significant SNPs on BTA5, BTA7, BTA10, BTA14, andBTA17. Kadri et al. (2015) found potential genes on BTA20 that are related to milk production, percentage of proteins, and resistance to mastitis.
The common genomic region identified by both tests (iHS and Tajima’s D) was on BTA 1, 2, and 6. Pitt et al. (2019) identified positive selection in Creole cattle breeds on BTA1 that harbored genes associated with Polled, milk production, and reproduction. Alshawi et al. (2019) found the most compelling evidence of selection in Jenoubi cattle in BTA1 with an iHS score of -5.40 as well as in BTA26 with an iHS score of -5.0. Iraqi Rustaqi cattle notice a clear selection indication at BTA1 with an iHS score of -5.60 as well as BTA18 with an iHS score of -5.03. Hayes et al. (2008) used an LD-based iHS technique and found many QTLs associated with milk production traits. They found selection signatures present on BTA6 in Norwegian red cattle. In a study on selection signatures employing ROH patterns in four different cattle breeds, Szmatoła et al. (2016) discovered that a homozygous area under selection on BTA2 was related to QTL for the muscling trait in the Limousin breed. At least three QTLs that influence milk traits are located on BTA6 ; , and it has been hypothesized that dairy breeders are selecting these areas to improve milk production . Using iHS, FST, as well as XP-EHH methods, Maiorano et al. (2018) demonstrated the existence of QTLs that impact milk as well as meat quality traits in dual-purpose Gir cattle populations on BTA6. Lee et al. (2016) also found a gene on BTA6 that was under selection and related to milk production parameters like milk yield, fat composition, as well as protein yield in Holstein dairy cattle.
These genomic regions identified by both tests in the study harbor candidate genes linked with milk, production and reproduction. PARD3B identified on BTA2 in the study has been found to be linked with bovine development and neural development in red Angus beef cattle . The gene has also been found to be linked with fat percentage in Danish Holstein cattle . PARD3B in red Angus beef cattle has been found to be associated with bovine tuberculosis traits . The PARD3B gene has also been identified in pigs as a candidate gene for body weight . The CENPE identified on BTA6 in the study has been found to be a candidate gene linked with milk composition traits in Holstein cattle . The CENPE gene has also been identified in cattle to be linked with residual feed intake . CSMD1 and TENM3 have also been detected on BTA27 in the study. Gonzalez et al. (2020) found CSMD1 to be associated with the rear udder height trait in Holstein cows. In the context of Hanwoo cattle, it was observed that CSMD1 exhibited higher expression levels in muscle samples derived from animals with elevated carcass weight, particularly in relation to intramuscular fat content and eye muscle area . Hoff et al. (2019) identified a region in the CSMD1 gene that regulates the complement system that controls inflammatory responses in Holstein cattle. CSMD1 has also been identified in goats as associated with goat fertility . TENM3 has been found to be a candidate gene within the most significant QTL, which is associated with wither height or stature in beef cattle . TENM3 has also been identified in sheep as associated with milk production traits . TENM3, among others, affects the metabolic pathways of cell differentiation and proliferation and is linked with the regulation of the immune system in goats .
The identification of QTLs in the study discovered that significant genomic areas consist of 25.08% of milk-type QTLs in Sahiwal cattle as well as other types like meat as well as carcass, production, health, reproduction, as well as exterior, which were annotated and represented 21.54, 18.72, 13.85, 11.05, and 9.76%, respectively (Fig. 6). The study revealed a low percentage of milk-type QTLs in Pakistani Sahiwal cattle compared to Indian Sahiwal cattle, where Illa et al. (2021) observed 54.6% milk-type QTLs. This may suggest that Pakistani Sahiwal cattle have not been subjected to intense selection for milk production traits. The QTL enrichment analysis has shown 8 substantial QTLs on chromosomes BTA 19 and BTA20, associated with milk, production, as well as reproduction traits. The utmost significant QTLs were assigned to BTA19 and BTA20, associated with milk fat yield, fat percentage, fertilization rate, early embryonic survival, body weight, body depth, and average daily gain (Fig. 8). Illa et al. (2021) conducted signature selection in Indian Sahiwal cattle, and the QTL enrichment analysis painted 14 substantial locations in BTA 1, 3, 6, 11, 20, as well as 21. They found that the top most three enriched QTLs were in BTA 6, 20, as well as 23, linked to the exterior, milk production, health, as well as reproduction traits. They obtained a more significant region, which may be due to Indian Sahiwal cattle being under intense selection for milk yield; they have a milk-type QTL of 54.6% as compared to the Pakistani Sahiwal cattle, which have just 25.08% milk-type QTLs.
CONCLUSION
The study findings revealed many genomic regions and several novel genes that exhibited positive selection in the Sahiwal cattle for both the test (iHS and Tajima’s D) used in the study. Considering iHS values, the regions on BTA 1, 2, 6, 11, 12, 15, 17, 21, and 27 are under the recent signatures of selection. While genomic regions on BTA 1, 2, 3, 4, 5, 6, 7, 9, 14, 18, 20, 23, and 24 are under recent signatures of selection with Tajima’s D test. The common genomic region identified by both tests under positive selection signatures was BTA 1, 2, and 6. These genomic regions harbor candidate genes linked with milk composition traits. The study also observed that the Sahiwal cattle population has low milk-type QTLs of 25.08%, indicating that the population is not under intense selection for milk production traits. Therefore, understanding the selection signatures and candidate genes that influence important economic traits can provide foundational knowledge that can be used effectively to gain insight into the underlying mechanisms controlling these traits in Sahiwal cattle. Additionally, the results might serve as a basis for further investigation of economically vital traits linked to milk production in Sahiwal cattle.
Funding
This study was funded by the Higher Education, Pakistan through a NRPU project No. Prediction of genetic values of economic traits of Sahiwal cattle.
Ethical approval
Ethical approval was given by the Ethics Committee of University Agriculture Faisalabad, Pakistan.
Statement of conflict of interest
The authors have declared no conflict of interest.
Figures
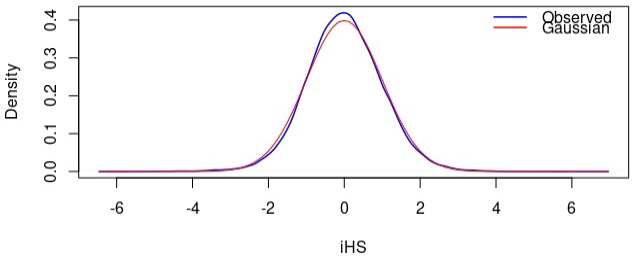
Comparison between the distribution of standardized integrated haplotype scores (iHS) and the standard Gaussian distribution.
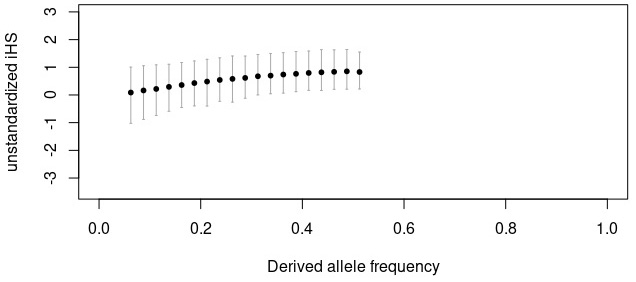
Unstandardized integrated haplotype scores (iHS) within frequency bins.
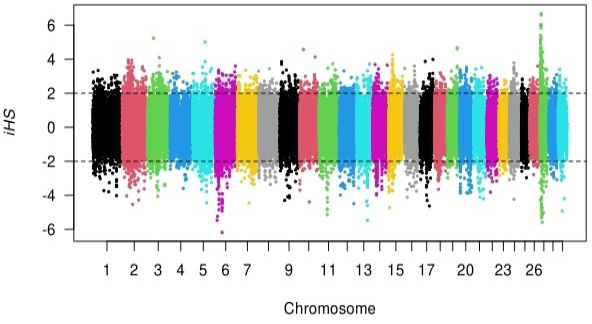
Distribution of the integrated haplotype score (iHS) across the genome.
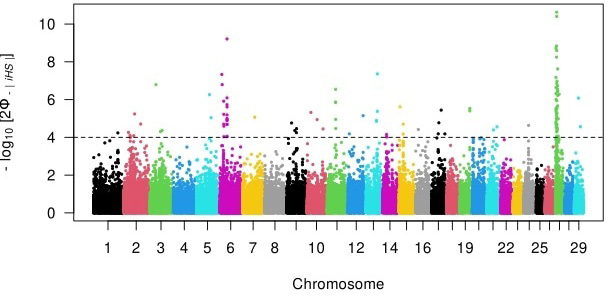
Genome-wide distribution of the logarithmic transformed Integrated haplotype scores (piHS) of each SNP per chromosome.
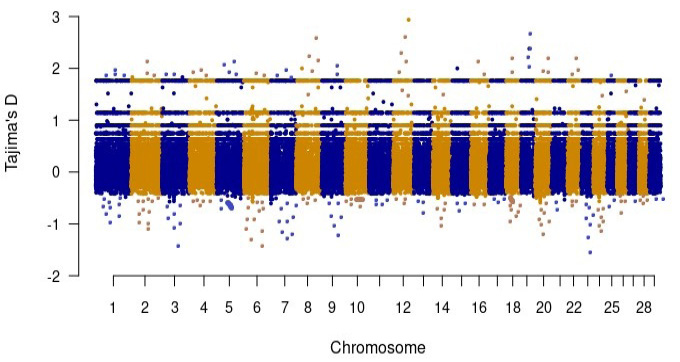
Manhattan plot of Tajima’s D values.
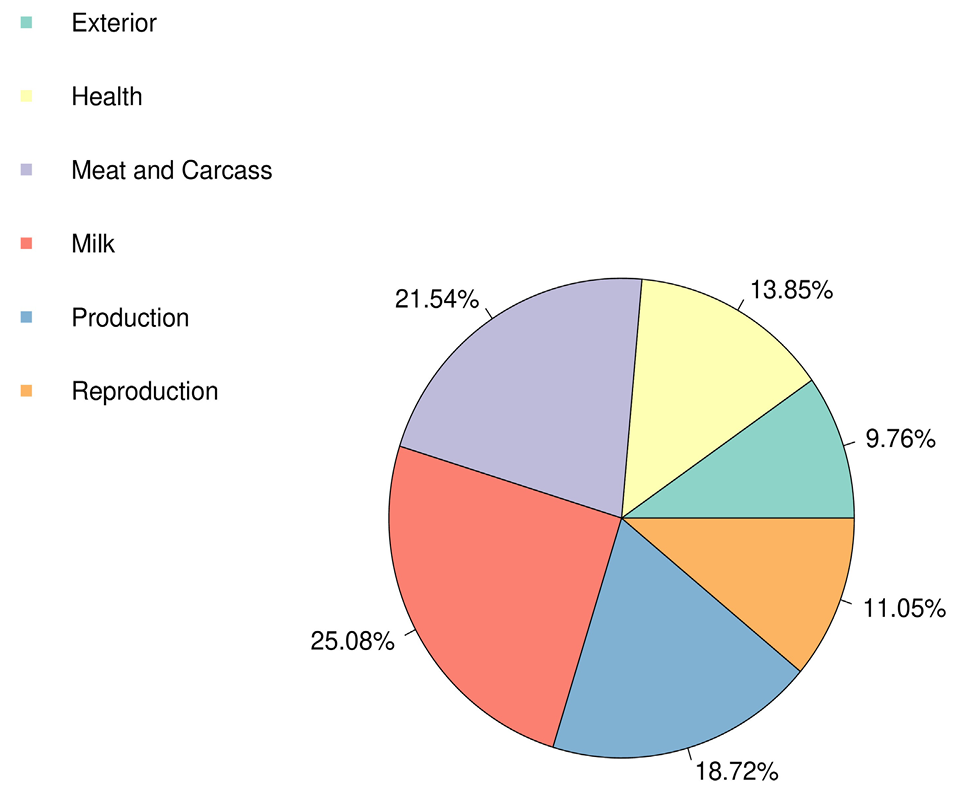
Pie plot shows the part of six quantitative trait loci (QTL) classes annotated in the substantial genomic areas.
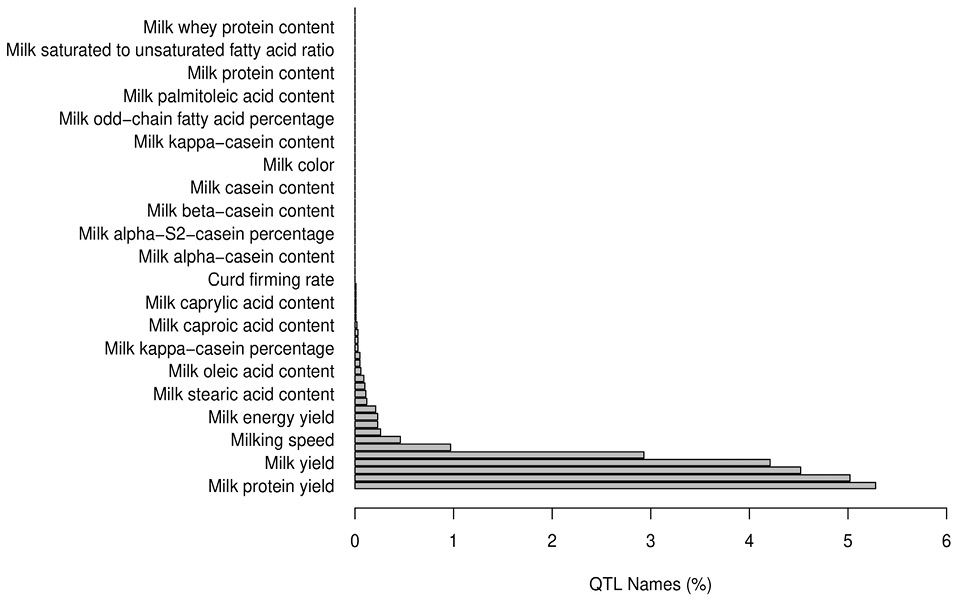
Milk-type quantitative trait loci (QTL) component.
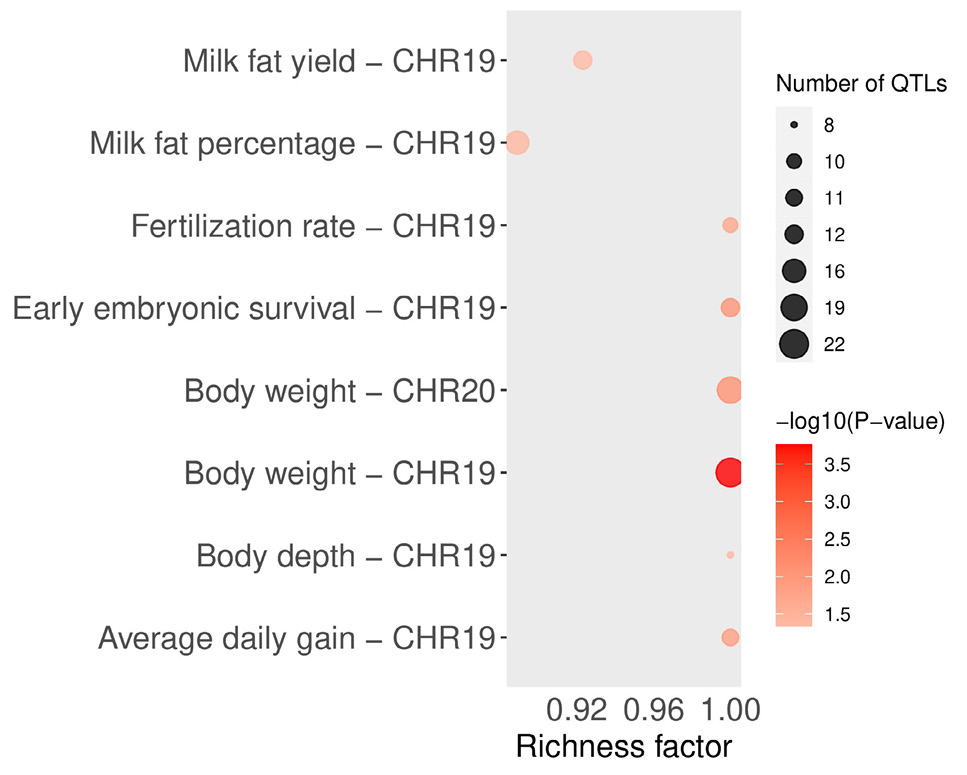
Quantitative trait loci (QTL) enrichment analysis resolute the vital traits enriched in the substantial genomic areas.
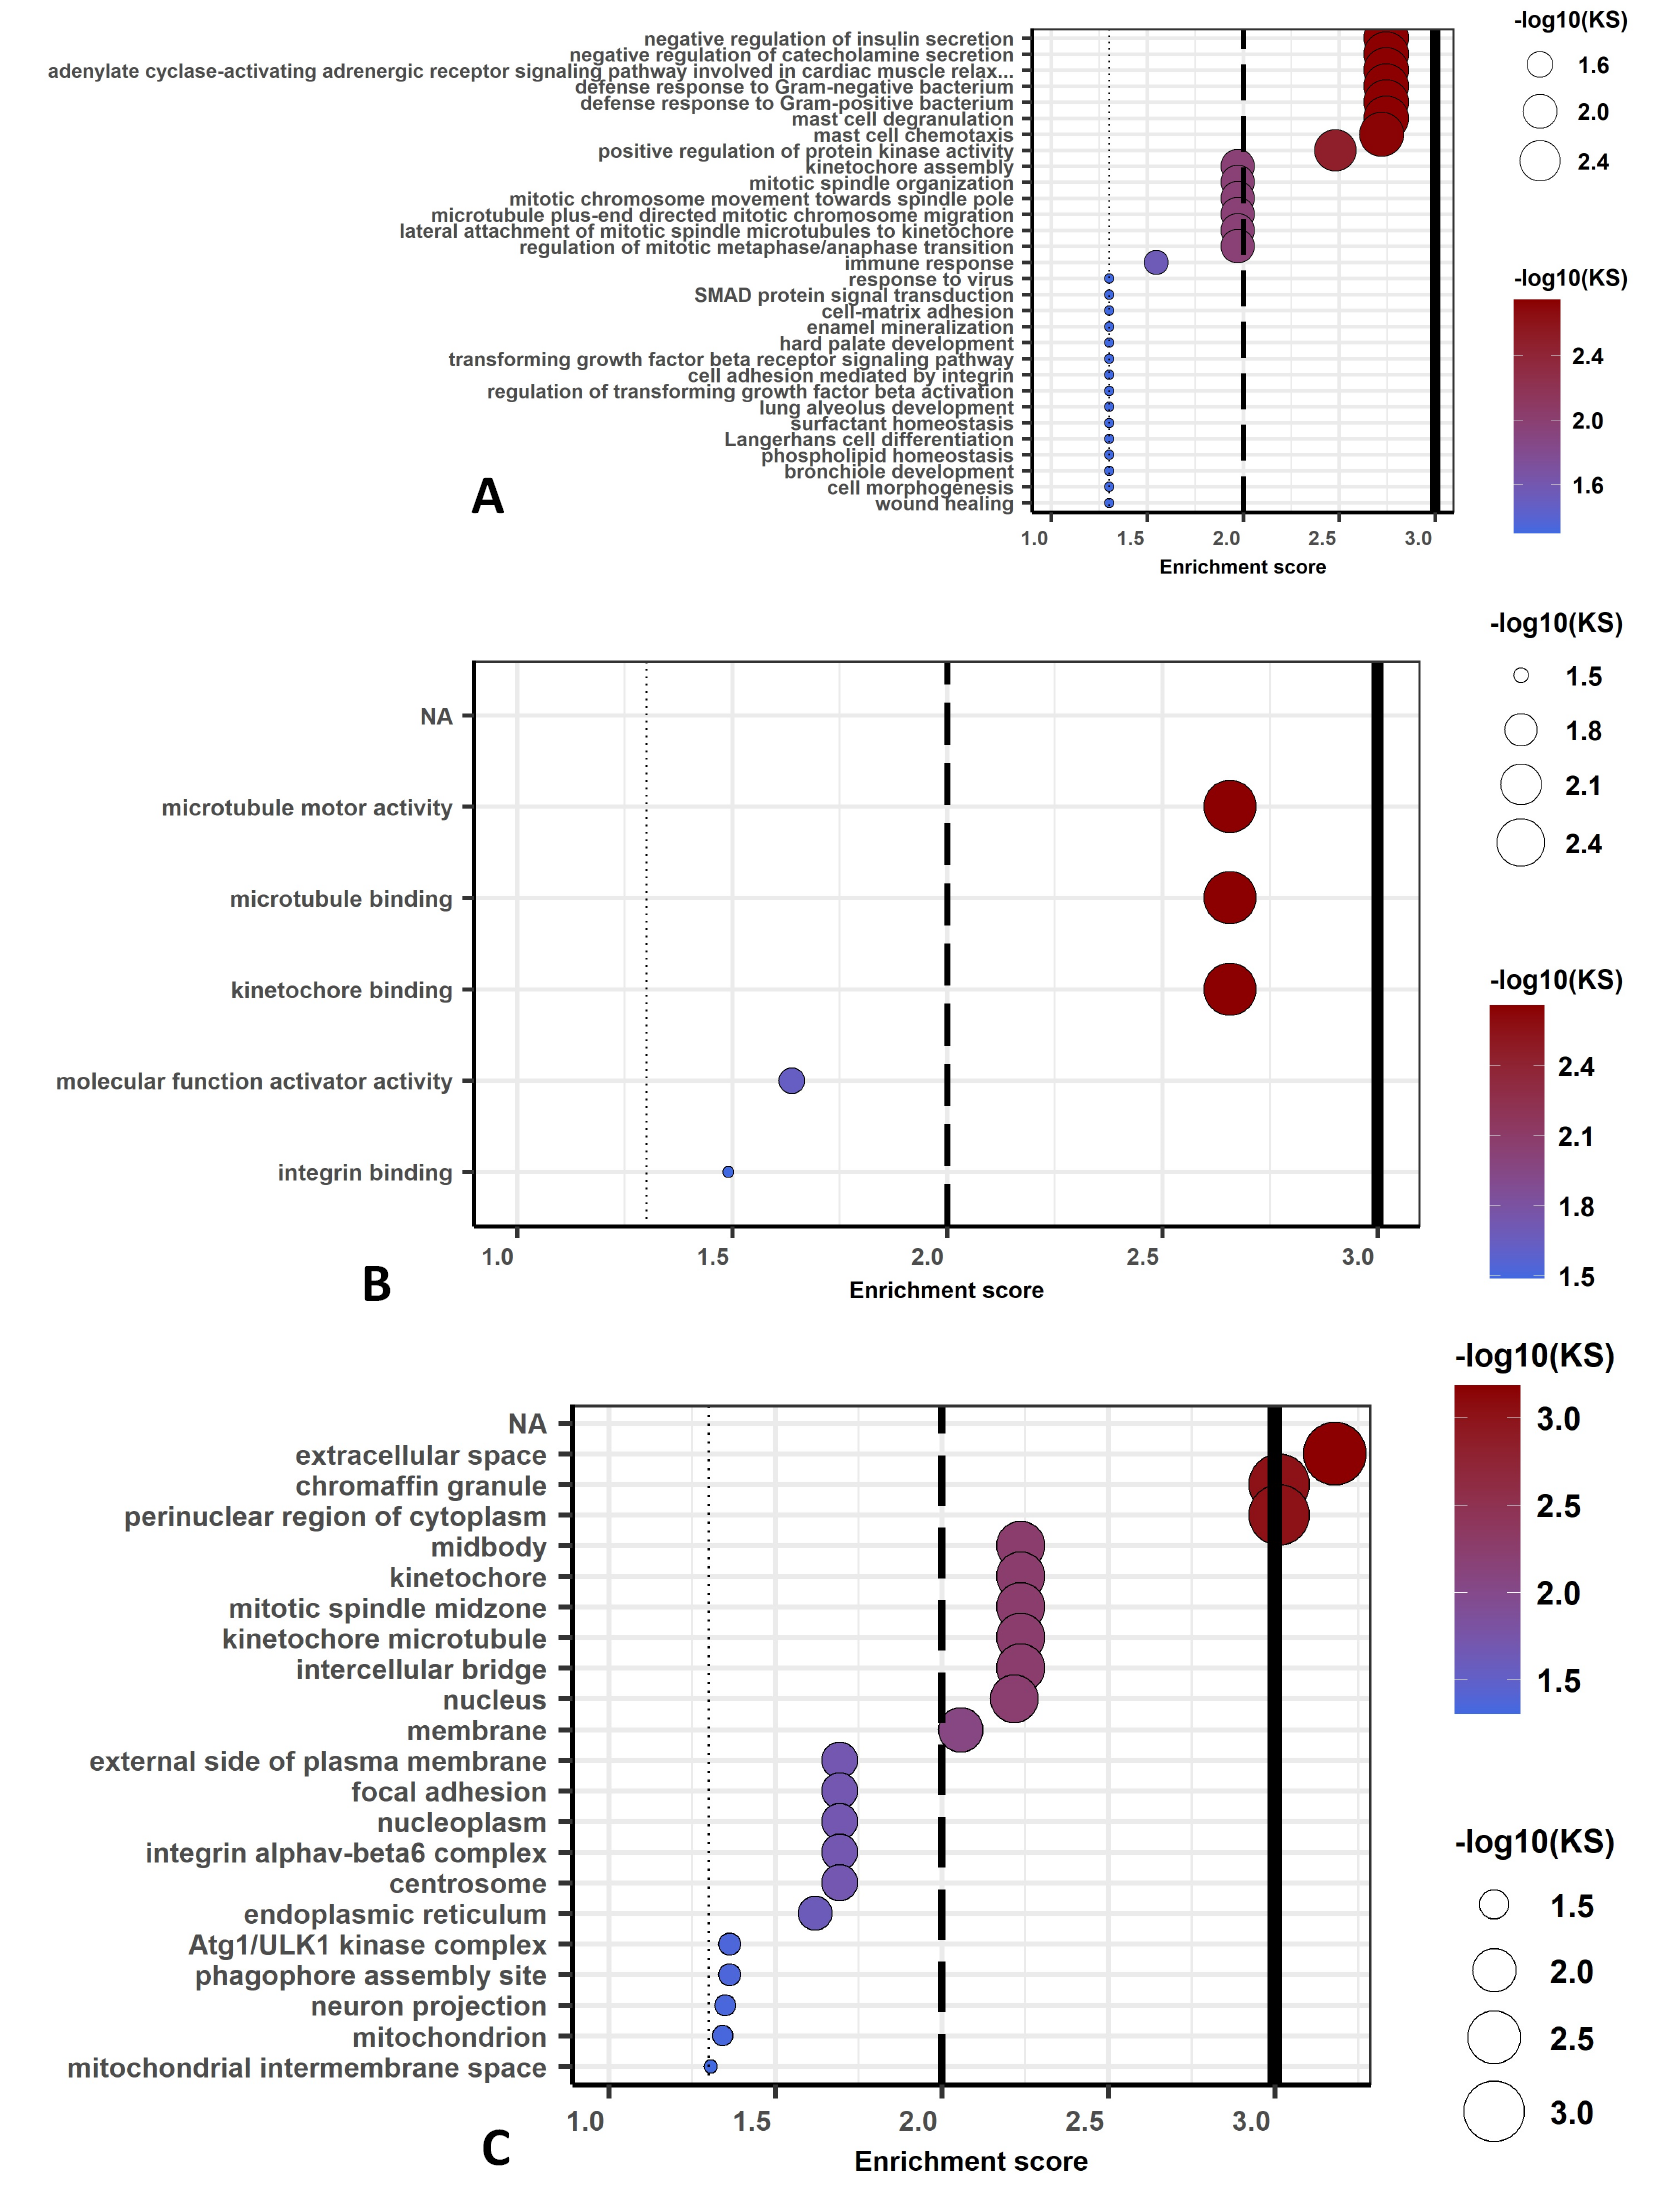
Biological process (A), molecular function (B) and cellular component (C) of gene network computed for the iHS significant potential genes. The cut off lines drawn at equivalents of p=0.05, p=0.01, and p=0.001. KS means the p-value of Kolmogorov-Smirnov test implemented in the R package ‘topGO.
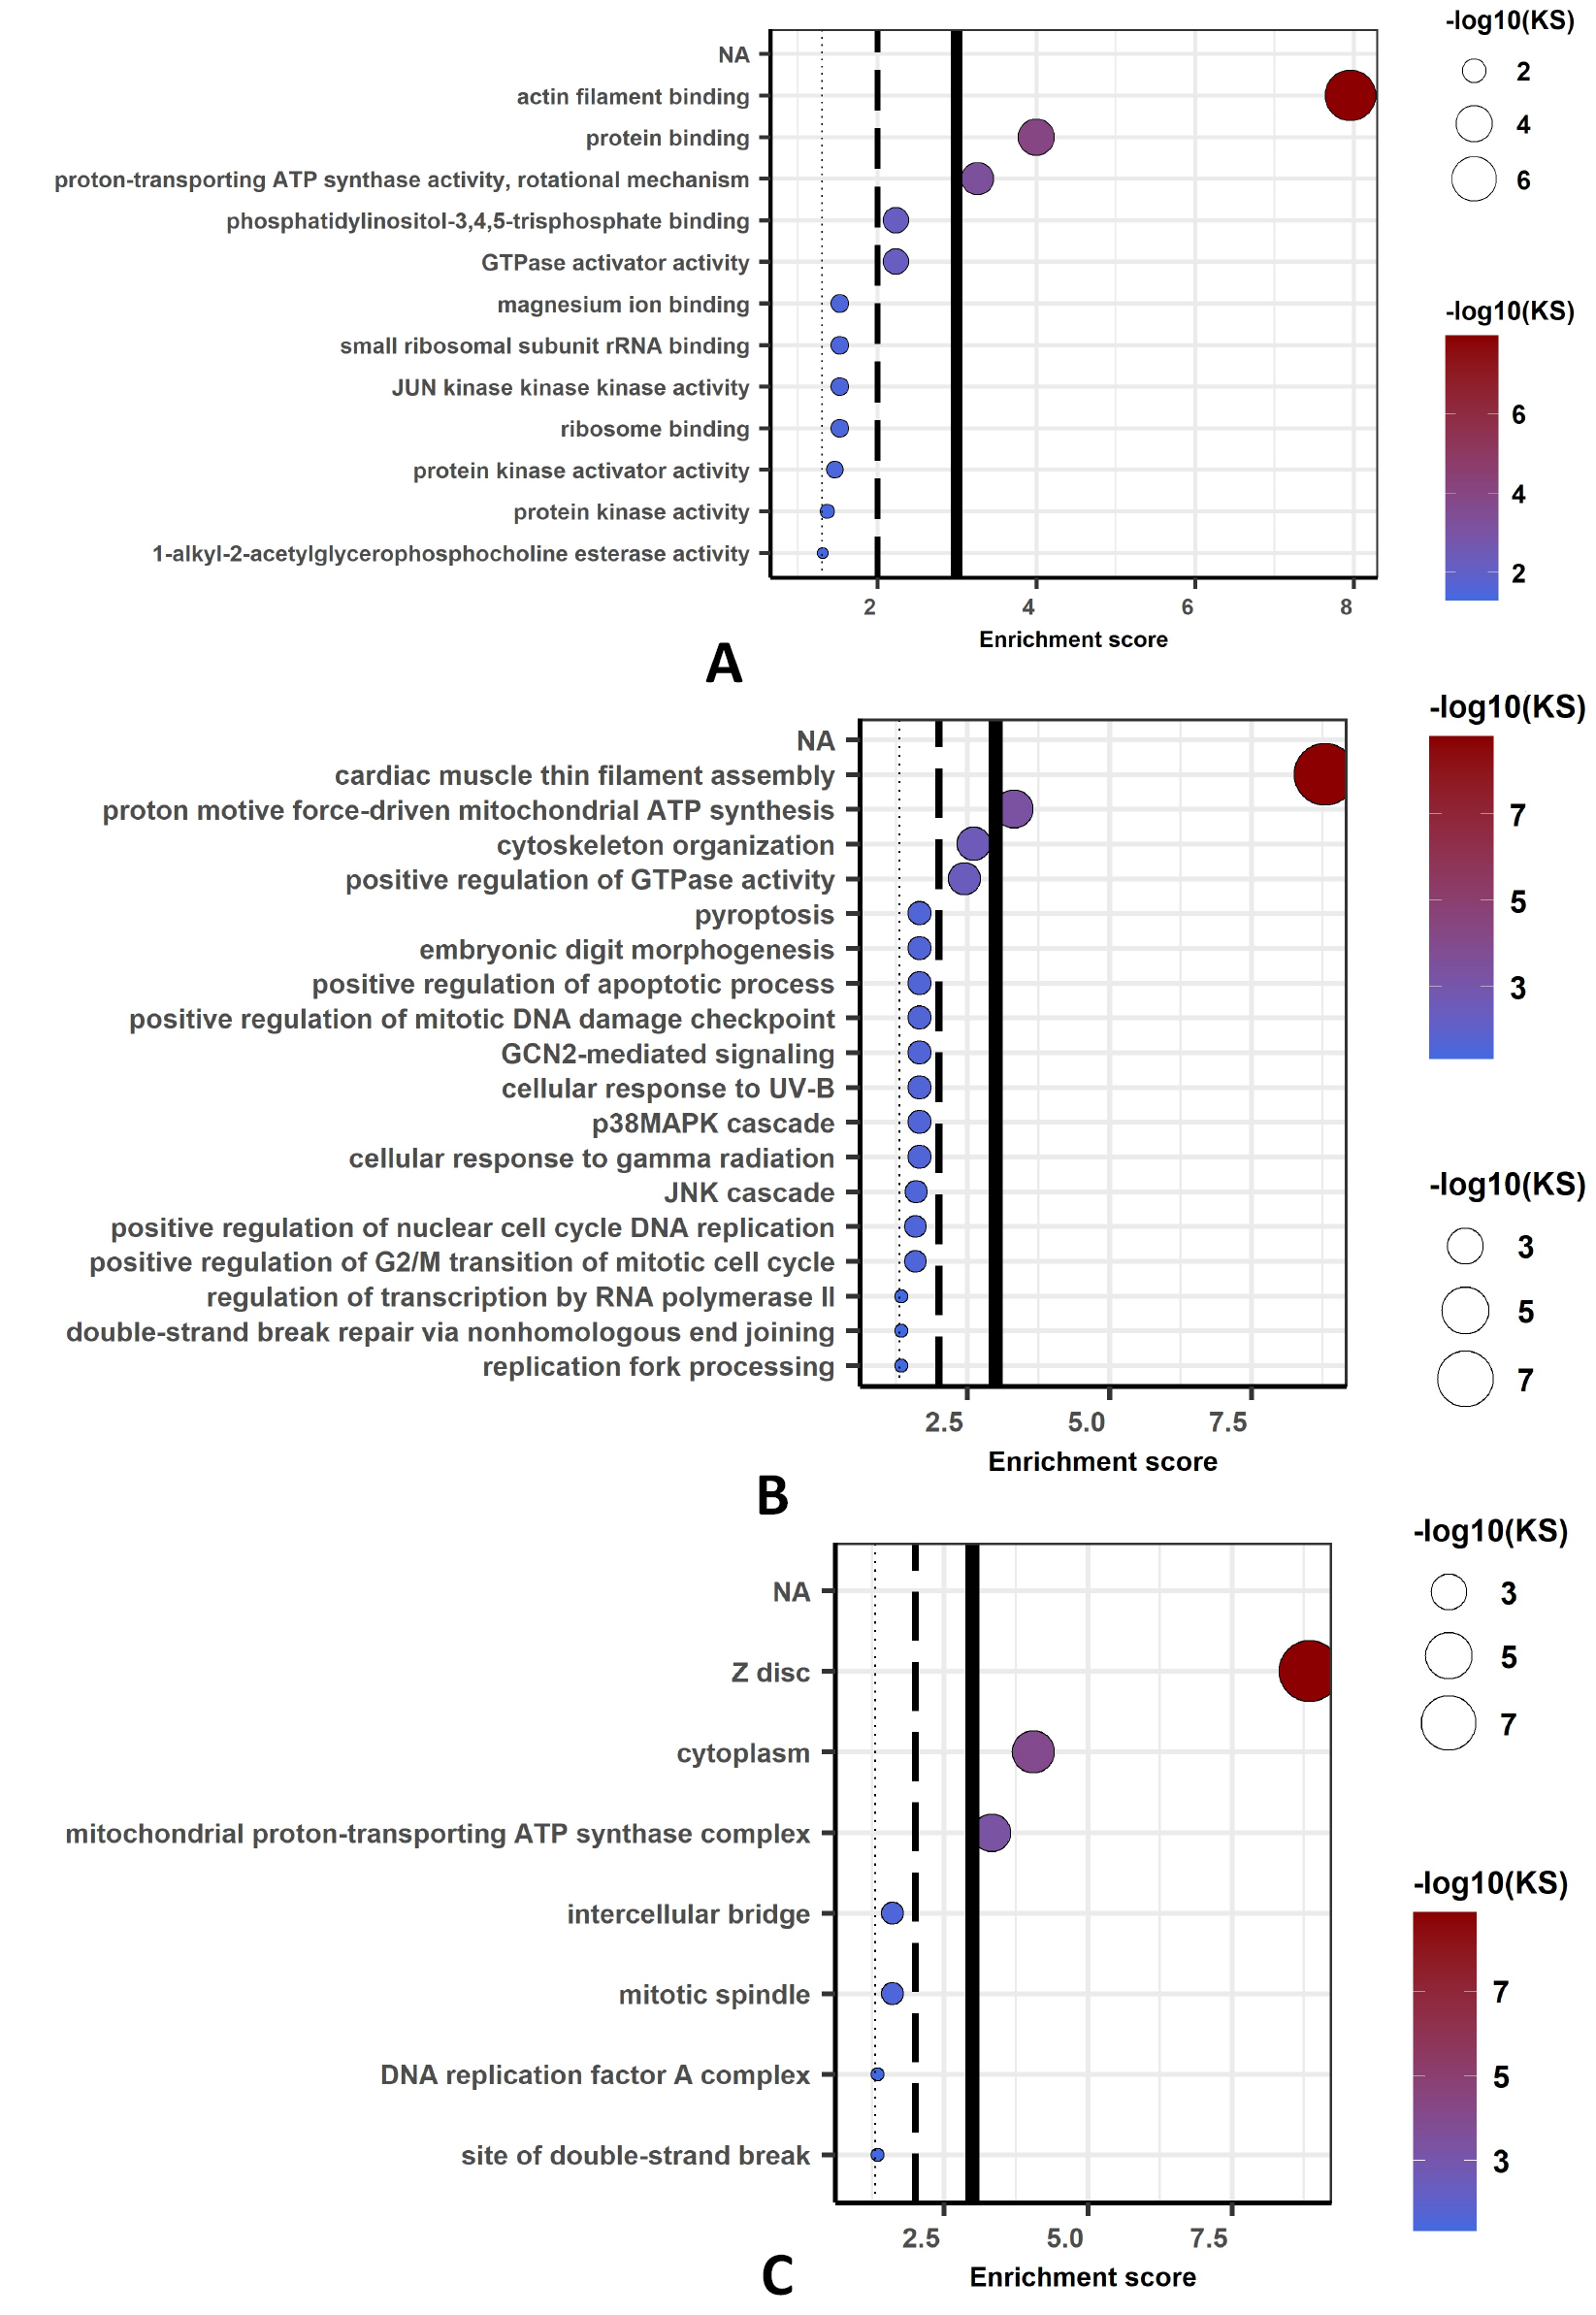
Biological process (A), molecular function (B) and cellular component (C) of gene network computed for the Tajima’s D significant potential genes. The cut off lines drawn at equivalents of p=0.05, p=0.01, and p=0.001. KS means the p-value of Kolmogorov-Smirnov test implemented in the R package ‘topGO.
References
- Akey, J.M., Zhang, G., Zhang, K., Jin, L. and Shriver, M.D., 2002. Interrogating a high-density SNP map for signitures of natural selection. Genome Res., 12: 1805–1814. https://doi.org/10.1101/gr.631202[CrossRef]
- Akram, M. and Khan, M.A., 2011. Sero-prevalence of foot and mouth disease in large ruminants in central Punjab, Pakistan. Indian J. Comp. Microbiol. Immunol. Infect. Dis., 32: 6–11.
- Alderson, G.L.H., 2018. Conservation of breeds and maintenance of biodiversity: Justification and methodology for the conservation of animal genetic resources. Arch. Zootec., 67: Corpus ID: 59476937.
- Alshawi, A., Essa, A., Al-Bayatti, S. and Hanotte, O., 2019. Genome analysis reveals genetic admixture and signature of selection for productivity and environmental traits in Iraqi cattle. Front. Genet., 11: 1–16. https://doi.org/10.3389/fgene.2019.00609[CrossRef]
- Bamshad, M. and Wooding, S.P., 2003. Signatures of natural selection in the human genome. Nat. Rev. Genet., 4: 99–110. https://doi.org/10.1038/nrg999[CrossRef]
- Bhatti, S.A., Sarwar, M., Khan, M.S. and Hussain, S.M.I., 2007. Manipulations in dairy buffaloes and cows: A review. Pak. Vet. J., 27: 42–47.
- Boichard, D., Chung, H., Dassonneville, R., David, X., Eggen, A., Fritz, S., Gietzen, J.K., Hayes, B.J., Lawley, C.T., Sonstegard, T.S., van Tassell, C.P., VanRaden, P.M., Viaud-Martinez, K.A. and Wiggans, G.R., 2012. Design of a bovine low-density snp array optimized for imputation. PLoS One, 7: 1–10. https://doi.org/10.1371/journal.pone.0034130[CrossRef]
- Booker, T.R., Jackson, B.C. and Keightley, P.D., 2017. Detecting positive selection in the genome. BMC Biol. 15: 1–10. https://doi.org/10.1186/s12915-017-0434-y[CrossRef]
- Brito, L.F., Bedere, N., Douhard, F., Oliveira, H.R., Arnal, M., Peñagaricano, F., Schinckel, A.P., Baes, C.F. and Miglior, F., 2021. Review: Genetic selection of high-yielding dairy cattle toward sustainable farming systems in a rapidly changing world. Animal, 15: 100292. https://doi.org/10.1016/j.animal.2021.100292[CrossRef]
- Buaban, S., Lengnudum, K., Boonkum, W. and Phakdeedindan, P., 2022. Genome-wide association study on milk production and somatic cell score for Thai dairy cattle using weighted single-step approach with random regression test-day model. J. Dairy Sci., 105: 468–494. https://doi.org/10.3168/jds.2020-19826[CrossRef]
- Buitenhuis, B., Janss, L.L.G., Poulsen, N.A., Larsen, L.B., Larsen, M.K. and Sørensen, P., 2014. Genome-wide association and biological pathway analysis for milk-fat composition in Danish Holstein and Danish Jersey cattle. BMC Genom., 15: 1–11. https://doi.org/10.1186/1471-2164-15-1112[CrossRef]
- Chen, H., Patterson, N. and Reich, D., 2010. Population differentiation as a test for selective sweeps. Genome Res., 20: 393–402. https://doi.org/10.1101/gr.100545.109[CrossRef]
- Cortes, O., Cañon, J. and Gama, L.T., 2022. Applications of microsatellites and single nucleotide polymorphisms for the genetic characterization of cattle and small ruminants: An overview. Ruminants, 2: 456–470. https://doi.org/10.3390/ruminants2040032[CrossRef]
- Danecek, P., Auton, A., Abecasis, G., Albers, C.A., Banks, E., DePristo, M.A., Handsaker, R.E., Lunter, G., Marth, G.T., Sherry, S.T., McVean, G. and Durbin, R., 2011. The variant call format and VCF tools. Bioinformatics, 27: 2156–2158. https://doi.org/10.1093/bioinformatics/btr330[CrossRef]
- Doyle, J.L., Berry, D.P., Veerkamp, R.F., Carthy, T.R., Walsh, S.W., Evans, R.D. and Purfield, D.C., 2020. Genomic regions associated with skeletal type traits in beef and dairy cattle are common to regions associated with carcass traits, feed intake and calving difficulty. Front. Genet., 11. https://doi.org/10.3389/fgene.2020.00020[CrossRef]
- Driscoll, C.A., Macdonald, D.W. and O’Brien, S.J., 2009. From wild animals to domestic pets, an evolutionary view of domestication. Proc. natl. Acad. Sci. U.S.A., 106 (Suppl): 9971–9978. https://doi.org/10.1073/pnas.0901586106[CrossRef]
- Fonseca, P.A.S., Suárez-Vega, A., Marras, G. and Cánovas, A., 2020. GALLO: An R package for genomic annotation and integration of multiple data sources in livestock for positional candidate loci. Gigascience, 9: 1–9. https://doi.org/10.1093/gigascience/giaa149[CrossRef]
- Frantz, L.A.F., Bradley, D.G., Larson, G. and Orlando, L., 2020. Animal domestication in the era of ancient genomics. Nat. Rev. Genet., 21: 449–460. https://doi.org/10.1038/s41576-020-0225-0[CrossRef]
- Gautier, M. and Naves, M., 2011. Footprints of selection in the ancestral admixture of a New World Creole cattle breed. Mol. Ecol., 20: 3128–3143. https://doi.org/10.1111/j.1365-294X.2011.05163.x[CrossRef]
- Gautier, M. and Vitalis, R., 2012. Rehh An R package to detect footprints of selection in genome-wide SNP data from haplotype structure. Bioinformatics, 28: 1176–1177. https://doi.org/10.1093/bioinformatics/bts115[CrossRef]
- Gonzalez, M., Villa, R., Villa, C., Gonzalez, V., Montano, M., Medina, G. and Mahadevan, P., 2020. Inspection of real and imputed genotypes reveled 76 SNPs associated to rear udder height in holstein cattle. J. Adv. Vet. Anim. Res., 7: 234–241. https://doi.org/10.5455/javar.2020.g415[CrossRef]
- Gorjanc, G., Cleveland, M.A., Houston, R.D. and Hickey, J.M., 2015. Potential of genotyping-by-sequencing for genomic selection in livestock populations. Genet. Sel. Evol., 47. https://doi.org/10.1186/s12711-015-0145-1[CrossRef]
- Haskell, M.J., Simm, G. and Turner, S.P., 2014. Genetic selection for temperament traits in dairy and beef cattle. Front. Genet., 5: 1–18. https://doi.org/10.3389/fgene.2014.00368[CrossRef]
- Hayes, B.J., Bowman, P.J., Chamberlain, A.C., Verbyla, K. and Goddard, M.E., 2009. Accuracy of genomic breeding values in multi-breed dairy cattle populations. Genet. Sel. Evol., 41: 1–9. https://doi.org/10.1186/1297-9686-41-51[CrossRef]
- Hayes, B.J., Lien, S., Nilsen, H., Olsen, H.G., Berg, P., Maceachern, S., Potter, S. and Meuwissen, T.H.E., 2008. The origin of selection signatures on bovine chromosome 6. Anim. Genet., 39: 105–111. https://doi.org/10.1111/j.1365-2052.2007.01683.x[CrossRef]
- Hoff, J.L., Decker, J.E., Schnabel, R.D., Seabury, C.M., Neibergs, H.L. and Taylor, J.F., 2019. QTL-mapping and genomic prediction for bovine respiratory disease in U.S. Holsteins using sequence imputation and feature selection. BMC Genom., 20: 1–15. https://doi.org/10.1186/s12864-019-5941-5[CrossRef]
- Hu, Z.L., Park, C.A. and Reecy, J.M., 2016. Developmental progress and current status of the Animal QTLdb. Nucl. Acids Res., 44: D827–D833. https://doi.org/10.1093/nar/gkv1233[CrossRef]
- Ilatsia, E.D., Migose, S.A., Muhuyi, W.B. and Kahi, A.K., 2011. Sahiwal cattle in semi-arid Kenya: Genetic aspects of growth and survival traits and their relationship to milk production and fertility. Trop. Anim. Hlth. Prod., 43: 1575–1582. https://doi.org/10.1007/s11250-011-9845-x[CrossRef]
- Illa, S.K., Mukherjee, S., Nath, S. and Mukherjee, A., 2021. Genome-wide scanning for signatures of selection revealed the putative genomic regions and candidate genes controlling milk composition and coat color traits in Sahiwal cattle. Front. Genet., 12: 1–14. https://doi.org/10.3389/fgene.2021.699422[CrossRef]
- Iqbal, M.A., Iqbal, A., Akbar, N., Zaman Khan, H. and Abbas, R.N., 2015. A study on feed stuffs role in enhancing the productivity of milch animals in Pakistan-existing scenario and future prospect. Glob. Vet., 14: 23–33.
- Jensen, P., 2015. Adding epi- to behaviour genetics: Implications for animal domestication. J. exp. Biol., 218: 32–40. https://doi.org/10.1242/jeb.106799[CrossRef]
- Jensen, P. and Wright, D., 2022. Behavioral genetics and animal domestication. Genet. Behav. Domest. Anim. Elsevier, pp. 49–93. https://doi.org/10.1016/B978-0-323-85752-9.00002-0[CrossRef]
- Jiang, J., Gao, Y., Hou, Y., Li, W., Zhang, S., Zhang, Q. and Sun, D., 2016. Whole-genome resequencing of holstein bulls for indel discovery and identification of genes associated with milk composition traits in dairy cattle. PLoS One, 11: 1–16. https://doi.org/10.1371/journal.pone.0168946[CrossRef]
- Joshi, B.K., Singh, A. and Gandhi, R.S., 2001. Performance evaluation, conservation and improvement of Sahiwal cattle in India. Cambridge University Press, pp. 43–54. https://doi.org/10.1017/S1014233900001474[CrossRef]
- Kadri, N.K., Guldbrandtsen, B., Lund, M.S. and Sahana, G., 2015. Genetic dissection of milk yield traits and mastitis resistance quantitative trait loci on chromosome 20 in dairy cattle. J. Dairy Sci., 98: 9015–9025. https://doi.org/10.3168/jds.2015-9599[CrossRef]
- Khan, M.A., Khan, M.S. and Waheed, A., 2018. Morphological measurements and their heritabilities for sahiwal cattle in Pakistan. J. Anim. Pl. Sci., 28: 431–440.
- Khatkar, M.S., Thomson, P.C., Tammen, I. and Raadsma H.W., 2004. Quantitative trait loci mapping in dairy cattle: Review and meta-analysis. Genet. Sel. Evol., 36: 163–190. https://doi.org/10.1051/gse:2003057[CrossRef]
- Kim, E.S., Sonstegard, T.S. and Rothschild, M.F., 2015. Recent artificial selection in U.S. Jersey cattle impacts autozygosity levels of specific genomic regions. BMC Genom., 16: 1–10. https://doi.org/10.1186/s12864-015-1500-x[CrossRef]
- Kolbehdari, D., Wang, Z., Grant, J.R., Murdoch, B., Prasad, A., Xiu, Z., Marques, E., Stothard, P. and Moore, S.S., 2009. A whole genome scan to map QTL for milk production traits and somatic cell score in Canadian Holstein bulls. J. Anim. Breed. Genet., 126: 216–227. https://doi.org/10.1111/j.1439-0388.2008.00793.x[CrossRef]
- Kreitman, M., 2000. Methods to detect selection in populations with a pplications to the human. Annu. Rev. Genom. Hum. Genet., 1: 539–559. https://doi.org/10.1146/annurev.genom.1.1.539[CrossRef]
- Krivoruchko, A., Surov, A., Skokova, A., Kanibolotskaya, A., Saprikina, T., Kukharuk, M. and Yatsyk, O., 2022. A genome-wide search for candidate genes of meat production in jalgin merino considering known productivity genes. Genes (Basel), 13: 1–14. https://doi.org/10.3390/genes13081337[CrossRef]
- Laland, K.N., Odling-Smee, J. and Myles, S., 2010. How culture shaped the human genome: Bringing genetics and the human sciences together. Nat. Rev. Genet., 11: 137–148. https://doi.org/10.1038/nrg2734[CrossRef]
- Lee, S.H., Van Der Werf, J.H.J, Kim, N.K., Lee, S.H., Gondro, C., Park, E.W., Oh, S.J., Gibson, J.P. and Thompson, J.M., 2011. QTL and gene expression analyses identify genes affecting carcass weight and marbling on BTA14 in Hanwoo (Korean Cattle). Mamm. Genome, 22: 589–601. https://doi.org/10.1007/s00335-011-9331-9[CrossRef]
- Lee, Y.S., Shin, D., Lee, W., Taye, M., Cho, K., Do Park, K. and Kim, H., 2016. The prediction of the expected current selection coefficient of single nucleotide polymorphism associated with Holstein milk yield, fat and protein contents. Asian-Australas. J. Anim. Sci., 29: 36–42. https://doi.org/10.5713/ajas.15.0476[CrossRef]
- Li, G., Tang, J., Huang, J., Jiang, Y., Fan, Y., Wang, X. and Ren, J., 2022. Genome-wide estimates of runs of homozygosity, heterozygosity, and genetic load in two chinese indigenous goat breeds. Front. Genet., 13: 1–16. https://doi.org/10.3389/fgene.2022.774196[CrossRef]
- Luikart, G., Kardos, M., Hand, B.K., Rajora, O.P., Aitken, S.N. and Hohenlohe, P.A., 2019. Population genomics: Advancing understanding of nature. Popul. Genom. Concepts, Approaches Appl., pp. 3–79. https://doi.org/10.1007/13836_2018_60[CrossRef]
- Maiorano, A.M., Lourenco, D.L., Tsuruta, S., Toro Ospina, A.M., Stafuzza, N.B., Masuda, Y., Filho, A.E.V., Dos Santos Goncalves Cyrillo, J.N., Curi, R.A. and De Vasconcelos Silv, J.A., 2018. Assessing genetic architecture and signatures of selection of dual purpose Gir cattle populations using genomic information. PLoS One, 13: 1–24. https://doi.org/10.1371/journal.pone.0200694[CrossRef]
- McGill, D., 2015. Genetic evaluation of Sahiwal cattle in Pakistan: Progeny testing and future directions. Doctoral Thesis, Charles Sturt University, Australia.
- Mei, C., Wang, H., Liao, Q., Khan, R., Raza, S.H.A., Zhao, C., Wang, H., Cheng, G., Tian, W., Li, Y. and Zan, L., 2019. Genome-wide analysis reveals the effects of artificial selection on production and meat quality traits in Qinchuan cattle. Genomics, 111: 1201–1208. https://doi.org/10.1016/j.ygeno.2018.09.021[CrossRef]
- Meuwissen, T., Hayes, B., MacLeod, I. and Goddard, M., 2022. Identification of genomic variants causing variation in quantitative traits: A review. Agriculture, 12: 1–11. https://doi.org/10.3390/agriculture12101713[CrossRef]
- Meuwissen, T.H.E., Hayes, B.J. and Goddard, M.E., 2001. Prediction of total genetic value using genome-wide dense marker maps. Genetics, 157: 1819–1829. https://doi.org/10.1093/genetics/157.4.1819[CrossRef]
- Mi, H. and Thomas, P., 2009. Panther pathway: An ontology-based pathway database coupled with data analysis tools. Protein Netw. Pathw. Anal., pp. 123–140. https://doi.org/10.1007/978-1-60761-175-2_7[CrossRef]
- Miller, S.A., Gallie, D.R., Sleat, D.E., Watts, J.W., Turner, P.C. and Wilson, T.M.A, 1988. Nucleic acids research. Nucl. Acids Res., 16: 883–893. https://doi.org/10.1093/nar/16.3.883[CrossRef]
- Moaeen-ud-Din, M., Bilal, G. and Khan, M.S., 2014. Potential of genomic selection in Sahiwal cattle. Pak. J. agric. Sci., 51: 695–700.
- Moradi, M.H., Nejati-Javaremi, A., Moradi-Shahrbabak, M., Dodds, .G. and McEwan, J.C., 2012. Genomic scan of selective sweeps in thin and fat tail sheep breeds for identifying of candidate regions associated with fat deposition. BMC Genet., 13. https://doi.org/10.1186/1471-2156-13-10[CrossRef]
- Moradian, H., Esmailizadeh Koshkoiyeh, A., Mohammadabadi, M. and Asadi F.M., 2020. Whole genome detection of recent selection signatures in Sarabi cattle: A unique Iranian taurine breed. Genes Genom. 42: 203–215. https://doi.org/10.1007/s13258-019-00888-6[CrossRef]
- Naskar, S., Gowane, G.R., Chopra, A., Paswan, C. and Prince, L.L.L., 2012. Genetic adaptability of livestock to environmental stresses. Environ. Stress Amelior. Livest. Prod., pp. 317–378. https://doi.org/10.1007/978-3-642-29205-7_13[CrossRef]
- Ogorevc, J., Kunej, T., Razpet, A. and Dovc, P., 2009. Database of cattle candidate genes and genetic markers for milk production and mastitis. Anim. Genet., 40: 832–851. https://doi.org/10.1111/j.1365-2052.2009.01921.x[CrossRef]
- Oleksyk, T.K., Smith, M.W. and O’Brien, S.J., 2010. Genome-wide scans for footprints of natural selection. Phil. Trans. R. Soc. B Biol. Sci., 365: 185–205. https://doi.org/10.1098/rstb.2009.0219[CrossRef]
- Pedrosa, V.B., Schenkel, F.S., Chen, S.Y., Oliveira, H.R., Casey, T.M., Melka, M.G. and Brito, L.F., 2021. Genomewide association analyses of lactation persistency and milk production traits in holstein cattle based on imputed whole-genome sequence data. Genes (Basel), 12. https://doi.org/10.3390/genes12111830[CrossRef]
- Pitt, D., Bruford, M.W., Barbato, M., Orozco-terWengel, P., Martínez, R. and Sevane, N., 2019. Demography and rapid local adaptation shape Creole cattle genome diversity in the tropics. Evol. Appl., 12: 105–122. https://doi.org/10.1111/eva.12641[CrossRef]
- Pritchard, J.K., Pickrell, J.K. and Coop, G., 2010. The genetics of human adaptation: Hard sweeps, soft sweeps, and polygenic adaptation. Curr. Biol., 20: R208–R215. https://doi.org/10.1016/j.cub.2009.11.055[CrossRef]
- Purcell, S., Neale, B., Todd-Brown, K., Thomas, L., Ferreira, M.A.R., Bender, D., Maller, J., Sklar, P., De Bakker, P.I.W., Daly, M. J. and Sham, P.C., 2007. Plink: A tool set for whole-genome association and population-based linkage analyses. Am. J. Hum. Genet., 81: 559–575. https://doi.org/10.1086/519795[CrossRef]
- Qanbari, S., Gianola, D., Hayes, B., Schenkel, F., Miller, Moore, S., Thaller, G. and Simianer, H., 2011. Application of site and haplotype-frequency based approaches for detecting selection signatures in cattle. BMC Genom., 12. https://doi.org/10.1186/1471-2164-12-318[CrossRef]
- Rajawat, D., Panigrahi, M., Nayak, S.S., Ghildiyal, K., Sharma, A., Kumar, H., Parida, S., Bhushan, B., Gaur, G.K., Mishra, B.P. and Dutt, T., 2023. Uncovering genes underlying coat color variation in indigenous cattle breeds through genome-wide positive selection. Anim. Biotechnol., 0: 1–14. https://doi.org/10.1080/10495398.2023.2240387[CrossRef]
- Raphaka, K., Matika, O., Sánchez-Molano, E., Mrode, R., Coffey, M.P., Riggio, V., Glass, E.J., Woolliams, J.A., Bishop, S.C. and Banos, G., 2017. Genomic regions underlying susceptibility to bovine tuberculosis in Holstein-Friesian cattle. BMC Genet., 18: 27. https://doi.org/10.1186/s12863-017-0493-7[CrossRef]
- Rathert, A.R., Meyer, A.M., Foote, A.P., Kern, R.J., Cunningham-Hollinger, H.C., Kuehn, L. A. and Lindholm-Perry, A.K., 2020. Ruminal transcript abundance of the centromere-associated protein E gene may influence residual feed intake in beef steers. Anim. Genet., 51: 453–456. https://doi.org/10.1111/age.12926[CrossRef]
- Rehman, Z. and Khan, M.S., 2012. Genetic factors affecting performance traits of Sahiwal cattle in Pakistan. Pak. Vet. J., 32: 329–333.
- Rosen, B.D., Bickhart, D.M., Schnabel, R.D., Koren, S., Elsik, C.G., Zimin, A., Dreischer, C., Schultheiss, S., Hall, R. and Schroeder, S.G., 2018. Modernizing the bovine reference genome assembly. Mol. Genet., 3: 802.
- Sabeti, P.C., Reich, D.E., Higgins, J.M., Levine, H.Z.P., Richter, D.J., Schaffner, S.F., Gabriel, S.B., Platko, J.V., Patterson, N.J., McDonald, G.J., Ackerman, H.C., Campbell, S.J., Altshuler, D., Cooper, R., Kwiatkowski, D., Ward, R. and Lander, E.S., 2002. Detecting recent positive selection in the human genome from haplotype structure. Nature, 419: 830–832. https://doi.org/10.1038/nature01140[CrossRef]
- Saeed, U., Ali, S., Latif, T., Rizwan, M., Saif, A., Iftikhar, A., Hashmi, S.G.M.D., Khan, A.U., Khan, I., Melzer, F., El-Adawy, H. and Neubauer, H., 2020. Prevalence and spatial distribution of animal brucellosis in central punjab, pakistan. Int. J. environ. Res. Publ. Hlth., 17: 1–14. https://doi.org/10.3390/ijerph17186903[CrossRef]
- Schwarzenbacher, H., Dolezal, M., Flisikowski, K., Seefried, F., Wurmser, C., Schlötterer, C. and Fries, R., 2012. Combining evidence of selection with association analysis increases power to detect regions influencing complex traits in dairy cattle. BMC Genom., 13. https://doi.org/10.1186/1471-2164-13-48[CrossRef]
- Segelbacher, G., Bosse, M., Burger, P., Galbusera, P., Godoy, J.A., Helsen, P., Hvilsom, C., Iacolina, L., Kahric, A., Manfrin, C., Nonic, M., Thizy, D., Tsvetkov, I., Veličković, N., Vilà, C., Wisely, S.M. and Buzan, E., 2022. New developments in the field of genomic technologies and their relevance to conservation management. Conserv. Genet., 23: 217–242. https://doi.org/10.1007/s10592-021-01415-5[CrossRef]
- Shah, H., Akmal, N. and Sharif, M., 2008. Characterization of dairy value chain in Pakistan’s Punjab: A preliminary analysis. National Agricultural Research Centre, Islamabad.
- Silpa, M.V., König, S., Sejian, V., Malik, P.K., Nair, M.R.R., Fonseca, V.F.C., Maia, A.S.C. and Bhatta, R., 2021. Climate-resilient dairy cattle production: Applications of genomic tools and statistical models. Front. Vet. Sci., 8: 1–16. https://doi.org/10.3389/fvets.2021.625189[CrossRef]
- Smith, J.L., Wilson, M.L., Nilson, S.M., Rowan, T.N., Schnabel, R.D., Decker, J.E. and Seabury, C.M., 2022. Genome-wide association and genotype by environment interactions for growth traits in U.S. Red Angus cattle. BMC Genom., 23: 1–22. https://doi.org/10.1186/s12864-022-08667-6[CrossRef]
- Stamps, J. and Groothuis, T.G.G, 2010. The development of animal personality: Relevance, concepts and perspectives. Biol. Rev., 85: 301–325. https://doi.org/10.1111/j.1469-185X.2009.00103.x[CrossRef]
- Sutera, A.M., Riggio, V., Mastrangelo, S., Di Gerlando, R., Sardina, M.T., Pong-Wong, R., Tolone, M. and Portolano, B., 2019. Genome-wide association studies for milk production traits in Valle del Belice sheep using repeated measures. Anim. Genet., 50: 311–314. https://doi.org/10.1111/age.12789[CrossRef]
- Szmatoła, T., Gurgul, A., Ropka-Molik, K., Jasielczuk, I., Zabek, T. and Bugno-Poniewierska, M., 2016. Characteristics of runs of homozygosity in selected cattle breeds maintained in Poland. Livest. Sci., 188: 72–80. https://doi.org/10.1016/j.livsci.2016.04.006[CrossRef]
- Tajima, F., 1989. Statistical method for testing the neutral mutation hypothesis by DNA polymorphism. Genetics, 123: 585–595. https://doi.org/10.1093/genetics/123.3.585[CrossRef]
- Utsunomiya, Y.T., Pérez O’Brien, A.M., Sonstegard, T.S., Van Tassell, C.P., do Carmo, A.S., Mészáros, G., Sölkner, J. and Garcia, J.F., 2013. Detecting loci under recent positive selection in dairy and beef cattle by combining different genome-wide scan methods. PLoS One, 8: 1–11. https://doi.org/10.1371/journal.pone.0064280[CrossRef]
- Hayes, B., 2007. QTL mapping, MAS, and genomic selection Dr. Ben Hayes. Program, pp.118.
- Voight, B.F., Kudaravalli, S.,Wen, X. and Pritchard, J.K., 2006. A map of recent positive selection in the human genome. PLoS Biol., 4: 446–458. https://doi.org/10.1371/journal.pbio.0040154[CrossRef]
- Waineina, R.W., Okeno, T.O., Ilatsia, E.D. and Ngeno, K., 2022. Selection signature analyses revealed genes associated with adaptation, production, and reproduction in selected goat breeds in Kenya. Front. Genet., 13: 1–11. https://doi.org/10.3389/fgene.2022.858923[CrossRef]
- Wilson, R.T., 2018. Crossbreeding of cattle in Africa. J. Agric. environ. Sci., 6. https://doi.org/10.15640/jaes.v7n1a3[CrossRef]
- Xu, J., Fu, Y., Hu, Y., Yin, L., Tang, Z., Yin, D., Zhu, M., Yu, M., Li, X., Zhou, Y., Zhao, S. and Liu, X., 2020. Whole genome variants across 57 pig breeds enable comprehensive identification of genetic signatures that underlie breed features. J. Anim. Sci. Biotechnol., 11: 1–16. https://doi.org/10.1186/s40104-020-00520-8[CrossRef]
- Xu, L., Bickhart, D.M., Cole, J.B., Schroeder, S.G., Song, J., Van Tassell, C.P., Sonstegard, T.S. and Liu, G.E., 2015. Genomic signatures reveal new evidences for selection of important traits in domestic cattle. Mol. Biol. Evol., 32: 711–725. https://doi.org/10.1093/molbev/msu333[CrossRef]
- Zeng, K., Shi, S. and Wu, C.I., 2007. Compound tests for the detection of hitchhiking under positive selection. Mol. Biol. Evol., 24: 1898–1908. https://doi.org/10.1093/molbev/msm119[CrossRef]
- Zerbino, D.R., P. Achuthan, P., Akanni, W., Amode, M.R., Barrell, D., Bhai, J., Billis, K., Cummins, C., Gall, A., Girón, C.G., Gil, L., Gordon, L., Haggerty, L., Haskell, E., Hourlier, T., Izuogu, O.G., Janacek, S.H., Juettemann, T., To, J.K., Laird, M.R., Lavidas, I., Liu, Z., . Loveland, J.E., Maurel, T., McLaren, W., Moore, B., Mudge, J., Murphy, D.N., Newman, V., Nuhn, M., Ogeh, D., Ong, C.K., Parker, A., Patricio, M., Riat, H.S., Schuilenburg, H., Sheppard, D., Sparrow, H., Taylor, K., Thormann, A., Vullo, A., Walts, B., Zadissa, A., Frankish, A., Hunt, S.E., Kostadima, M., Langridge, N., Martin, F.J., Muffato, M., Perry, E., Ruffier, M., Staines, D.M., Trevanion, S.J., Aken, B.L., Cunningham, F., Yates, A. and Flicek, P., 2018. Ensembl 2018. Nucl. Acids Res., 46: D754–D761. https://doi.org/10.1093/nar/gkx1098[CrossRef]
- Zhang, M., Peng, W.F., Hu, X.J., Zhao, Y.X., Lv, F.H. and Yang, J., 2018. Global genomic diversity and conservation priorities for domestic animals are associated with the economies of their regions of origin. Sci. Rep., 8: 1–12. https://doi.org/10.1038/s41598-018-30061-0[CrossRef]
- Zhang, Q., Guldbrandtsen, B., Bosse, M., Lund, M.S. and Sahana, G., 2015. Runs of homozygosity and distribution of functional variants in the cattle genome. BMC Genom, 16: 1–16. https://doi.org/10.1186/s12864-015-1715-x[CrossRef]
- Zhang, Q., Schönherz, A.A., Lund, M.S. and Guldbrandtsen, B., 2022a. Positive selection and adaptive introgression of haplotypes from bos indicus improve the modern Bos taurus cattle. Agriculture, 12: 1–17. https://doi.org/10.3390/agriculture12060844[CrossRef]
- Zhang, S., Yao, Z., Li, X., Zhang, Z., Liu, X., Yang, P., Chen, N., Xia, X., Lyu, S., Shi, Q., Wang, E., Ru, B., Jiang, Y., Lei, C., Chen, H. and Huang, Y., 2022b. Assessing genomic diversity and signatures of selection in Pinan cattle using whole-genome sequencing data. BMC Genom., 23: 1–11. https://doi.org/10.1186/s12864-022-08645-y[CrossRef]
- Zurwan, A., Moaeen-Ud-din, M., Bilal, G., Zia-Ur-Rehman and Khan, M.S., 2017. Estimation of genetic parameters for persistency of lactation in Sahiwal dairy cattle. Pakistan J. Zool., 49: 877–882. https://doi.org/10.17582/journal.pjz/2017.49.3.877.882[CrossRef]
Services
Article usage statistics
Loading…