
The growth and productivity of plants and crops are adversely affected by soil salinity, a major abiotic stress. High salt concentrations can hinder water absorption, inhibit seed germination, and lead to ionic toxicity, resulting in reduced plant development and yield. Understanding the responses of different varieties to salt stress is essential for improving crop tolerance. This study assessed the impact of varying NaCl concentrations on germination and seedling growth in five types of durum wheat: Gta Dur, Simeto, Oued Elbared, Bousselam, and Vitron. A germination test was performed under controlled conditions at 24°C and 70% humidity, using thirty seeds per variety germinated on 90 mm Petri dishes, moistened with either distilled water or NaCl solutions at four different concentrations 3g/L, 6g/L, 9 g/L and 12 g/L. Each treatment was repeated 4 times. After a 15-day incubation period, the parameters of seed germination were assessed, including germination percentage, epicotyl and root length, as well as root and shoot dry weight. The results showed that the Bousselam variety exhibited the best germination rate at 87.36%, while the Simeto cultivar exhibited the lowest germination rate at 73.88%. The treatments T3 (9 g/L) and T4 (12 g/L) adversely affect all varieties for all parameters studied.
Research Article · Volume 39, Issue 3, 13 September 2026 · Open Access
Effects of NaCl-Induced Salinity on Germination and Early Seedling Growth of Durum Wheat (Triticum durum Desf.) Cultivars
· · · ·
Affiliations & Notes ⌄
- 1Department of Agricultural Sciences, University of M’Sila, Algeria
- 2Department of Agricultural Sciences, University of Biskra, Laboratory Diversity of Ecosystems and Dynamics of Agricultural Production Systems in Arid Zones, Algeria
- 3Université de Biskra. Algeria
- 4Technical Institute for the Development of Saharan Agriculture (ITDAS), Biskra, Algeria. *Correspondence | Madani Djamila, Department of Agricultural Sciences, University of M’Sila, Algeria
- 5Email: djamila.madani@univ-msila.dz
Article Info ⌄
- Journal:
- Pakistan Journal of Agricultural Research
- Published:
- 13 September 2026
From the article
- Beyond germination, salt stress significantly affects seedling growth traits, including root length, shoot height, and biomass accumulation.
- This study highlights the detrimental impact of salt stress on durum wheat productivity, revealing that the response varies by variety and NaCl dose.
- Root lengths were similar at low salinity but differed significantly at higher concentrations.
- Severe salt stress notably decreased shoot dry matter, with Oued Elbared producing the most.
Selected from the article's own text.
Abstract
Introduction
Environmental stresses, such as extreme temperatures, drought, and soil salinization, are currently the main factors limiting crop production . Average crop yields are currently 20% to 50% of record levels, affected mainly by drought and high soil salinity, which are projected to worsen due to global climate change . Salinity is a critical environmental limitation that restricts plant productivity, especially in dry and semi-arid areas ; ; . Salinity is a considerable risk to global food security ; ; . Approximately 10.7% of the world’s cultivable land suffers from salinity, with 10% of irrigated land being adversely affected by salt (FAO, 2024). This area is increasing by 10 million hectares per year due to natural salinization or bad irrigation methods .
Soil salinity significantly constrains wheat production in many regions, resulting in yield losses of up to 60% . In many arid and semi-arid regions where wheat is the main staple, soil salinity exacerbates food shortages .
Notwithstanding extensive endeavors, less progress has been made in the development of salinity-tolerant wheat types . Salinity tolerance is a complex quantitative feature encompassing morphological, physiological, and metabolic processes peculiar to each plant that regulate salt stress tolerance mechanisms . These mechanisms are generally classified as osmotic tolerance, toxic ion exclusion, and tissue tolerance .
Salt present in irrigation water or soil causes damage at several levels, such as morphological appearance and physiological state ; . This includes a reduction in dry biomass, leaf area, root length, and delayed tillering .
Wheat production is significantly impacted by salinity, which becomes a concern when salinity levels reach 6 dS m−1 . Increased Na+ concentrations within plant tissues lead to lower water potential in soil, causing osmotic and ionic stresses in wheat plants . Salinity stress adversely affects the agronomic, physiological, and chemical characteristics of wheat .
In light of the limitations of salt stress, which inhibits the cultivation of durum wheat, especially in marginal areas, the present study aims to examine the impact of four concentrations of NaCl and salt-free controls on the germination of five durum wheat genotypes (Triticum durum Desf.). The study seeks to identify the germination parameters most affected by salt stress and to pinpoint salt-tolerant varieties, as well as the NaCl concentrations that hinder the germination of these varieties.
Materials and Methods
Experimental setup
Laboratory research assessed the germination and initial growth of five durum wheat genotypes. The plant material used consists of five varieties of durum wheat (Triticum durum Desf.). The origin and technical characteristics of these varieties are shown in the following Table 1.
Each genotype was tested using 30 seeds placed in 90-mm Petri dishes. One group was treated with 5 mL of distilled water (control, T0), while the other groups were exposed to different concentrations of NaCl (T1: 3 g/L, T2: 6 g/L, T3: 9 g/L, and T4: 12 g/L corresponding to T1 : 51 mM, T2 : 103 mM, T3 : 154 mM, and T4 : 205 mM ). The range of NaCl concentrations (3–12 g/L) was chosen to represent a progressive salt stress, ranging from mild to severe levels, which are commonly found in saline agricultural soils. This gradient allows for the evaluation of germination responses and the determination of tolerance thresholds in different durum wheat genotypes.
The experiment was arranged in a completely randomized design (CRD). Each treatment was replicated four times. The samples were incubated in the dark at 24°C and 70% relative humidity. Daily observations of germination percentages were recorded for 15 days, with the germination rate calculated based on the emergence of the radicle reaching a length of ≥ 2 mm.
Table 1: Origin and technical characteristics of five durum wheat genotypes .
|
Genotype |
Origin |
Technical requirements |
|
|
Sowing date |
Seeding rate (kg/ha) |
||
|
Vitron |
Spain |
mid-november/ late December |
120-150 |
|
Simeto |
Italy |
mid -november/mid-décember |
130 |
|
Gta Dur |
Mexico |
late november/ early January |
130-150 |
|
Bousselam |
Syria |
November/ early décember |
130-150 |
|
Oued El bared |
Algeria |
November/ early décember |
130 |
Germination rate (%) = (number of germinated seeds/number of total seeds)*100 ; .
Epicotyl and root lengths were measured using a graduated ruler in centimeters (cm). Three seeds were taken at random from each petri dish (separately for each treatment and replicate).
Shoot and root dry matter were placed in an oven at 80°C for 24 hours. After drying the plants (both aerial and root parts), the dry weight of each sample was determined by weighing using precision balance.
Statistical analysis
ANOVA and mean comparisons were conducted using XLSTAT 2014 software to assess the relevance of the treatments on the various examined parameters, with a probability threshold of 5%.
Results
Final germination rate
At low concentrations, germination percentages among the studied varieties were similar. However, a noticeable decline in germination rates began at dose T3, with a more significant reduction at dose T4, suggesting heightened sensitivity to stress in the varieties (Figure 1).
Analysis of variance revealed significant distinctions in germination rates among plant varieties, resulting in four groups: A, AB, BC, and C. The Bousselam variety in Group A achieved the highest germination rate at 87.36%, followed by Gta Dur and Oued Elbared in Group AB with rates of 84% and 83.5%, respectively. Group BC’s Vitron variety reached 78%, while the Simeto variety in Group C recorded the lowest at 73.88% (Table 2). Notably, Bousselam exhibits high germination aptitude and salt stress tolerance, contrasting with the Simeto variety, which is particularly sensitive.
Analysis of variance reveals significant differences in germination rates at varying NaCl concentrations, forming three groups: A (T1, 90.72%; T0, 86.70%; T2, 86.67%), B (T3, 76.50%), and C (T4, 66.17%). The inhibitory effect of salt on germination initiates at T3, particularly at T4. Regarding the effect of the interaction (Variety × Treatment) on the germination rate, four homogeneous groups were identified: A,AB, B, and C (Table 3).
The highest germination rate was recorded in the Gta Dur variety under the T0 treatment (control), reaching 95% and classified in group A. In contrast, the lowest germination rate was observed in the Simeto variety under the T4 treatment, with 47.50%, classified in group C.
Epicotyl length
Epicotyl length is longest at NaCl concentration T0 and shortest at T4, with the Vitron variety exhibiting the longest lengths at all concentrations (Figure 2). Generally, increased NaCl concentrations result in decreased epicotyl lengths.
Analysis reveals four groups of plant varieties based on epicotyl length, with Group A (Vitron) exhibiting the highest average at 14.40 cm, followed by Group B (Oued Elbared) at 12.80 cm. Groups C (Bousselam and GTA Dur) show lengths of 11.40 cm and 10.52 cm, respectively, while Group D (Simeto) records the lowest at 9.31 cm (Table 4). The Vitron variety stands out with superior epicotyl length performance.
Table 2: Classification of durum wheat varieties into homogeneous groups, according to Newman and Keuls test for germination rate.
|
Variety |
Germination rate % |
Homogeneous groups |
||
|
Bousselam |
87,37 |
A |
||
|
Gta dur |
84 |
A |
B |
|
|
Oued elbared |
83,50 |
A |
B |
|
|
Vitron |
78 |
B |
C |
|
|
Simeto |
73,88 |
C |
||
Table 3: Classification of NaCl concentration into homogeneous groups, according to Newman and Keuls test for germination rate.
|
NaCl concentration |
Germination rate % |
Homogeneous groups |
||
|
T1 |
90,72 |
A |
||
|
T0 |
86,70 |
A |
||
|
T2 |
86,67 |
A |
||
|
T3 |
76,50 |
B |
||
|
T4 |
66,17 |
C |
||
The analysis revealed significant differences in epicotyl length among varieties influenced by NaCl concentration, forming four groups: Group A (T0 - 15.99 cm, T1 - 14.93 cm), Group B (T2 - 12.50 cm), Group C (T3 - 8.51 cm), and Group D (T4 - 6.50 cm), indicating that increased NaCl concentrations negatively impact epicotyl length (Table 5).
Table 4: Classification of durum wheat varieties into homogeneous groups, according to Newman and Keuls test for epicotyl length.
|
Variety |
Epicotyl length cm |
Homogeneous groups |
|||
|
Vitron |
14,40 |
A |
|
|
|
|
Oued elbared |
12,80 |
B |
|||
|
Bousselam |
11,40 |
C |
|||
|
Gta dur |
10,52 |
C |
|||
|
Simeto |
9,31 |
|
|
|
D |
The results concerning the interaction (Variety × Treatment) on epicotyl length revealed 12 homogeneous groups: A, AB, ABC, BCD, BCDE, CDE, DE, E, F, FG, G, and H. The greatest epicotyl length was recorded in the Vitron variety under the T0 treatment (control), reaching 17.90 cm and classified in group A. In contrast, the shortest epicotyl length was observed in the Gta Dur variety under the T4 treatment, with 2.81 cm, classified in group H.
Root length
Figure 3 indicate that genotypes exhibit similar root elongation patterns under low osmotic stress (T0 to T2). However, the imposition of high salinity levels (T3 and T4) imposes a selective pressure that differentiates the genotypes based on their tolerance to salinity.
Analysis of variance revealed significant differences in root length among varieties, categorizing them into three homogeneous groups: Group A (Vitron, GTA Dur, Oued Elbared) with mean lengths of 8.46 cm, 8.32 cm, and 7.97 cm; Group AB (Simeto) with a mean length of 7.033 cm; and Group B (Bousselam) with a mean length of 6.40 cm (Table 6).
Table 5: Classification of NaCl concentration into homogeneous groups, according to Newman and Keuls test for epicotyl length.
|
NaCl concentration |
Epicotyl length cm |
Homogeneous groups |
|||
|
T0 |
15,99 |
A |
|
|
|
|
T1 |
14,93 |
A |
|||
|
T2 |
12,50 |
B |
|||
|
T3 |
8,51 |
C |
|||
|
T4 |
6,50 |
|
|
|
D |
Analysis of variance revealed significant differences in root length effects due to NaCl concentration, resulting in two groups: Group A (T1, T2, T0) and Group B (T3, T4) (Table 7). Higher NaCl concentrations, especially in treatments T3 and T4, negatively impacted root length more distinctly.
The results concerning the interaction (Variety × Treatment) on root length revealed six homogeneous groups: A, AB, B, BC, CD, and D.
Table 6: Classification of durum wheat varieties into homogeneous groups, according to Newman and Keuls test for root length.
|
Variety |
Root length cm |
Homogeneous groups |
|
|
Vitron |
8,46 |
A |
|
|
Gta dur |
8,31 |
A |
|
|
Oued elbared |
7,97 |
A |
|
|
Simeto |
7,03 |
A |
B |
|
Bousselam |
6,40 |
|
B |
The greatest root length was recorded in the Gta Dur variety under the T1 treatment, reaching 14.68 cm and classified in group A. In contrast, the lowest root length was observed in the Simeto variety under the T3 treatment, with 2.86 cm, classified in group D (Figure 3).
Shoot dry matter weight
Figure 4 shows that salt stress significantly impacts shoot dry matter production in five durum wheat types, particularly for those receiving maximum doses of T3 and T4 across all varieties.
Analysis of variance shows significant differences in shoot dry matter production among varieties, categorizing them into three groups: Group A (Oued Elbared, 0.34 g), Group AB (Vitron and GTA Dur, both 0.27 g), and Group B (Bousselam at 0.25 g and Simeto at 0.23 g) (Table 8).
The analysis of variance reveals significant differences in shoot dry matter production based on NaCl concentration, dividing the samples into two groups. Group A, with higher weights of 0.36 g (T1), 0.35 g (T0), and 0.32 g (T2), contrasts with Group B, which has lower weights of 0.19 g (T3) and 0.15 g (T4) (Table 9).
Table 7: Classification of NaCl concentration into homogeneous groups, according to Newman and Keuls test for root length.
|
NaCl concentration |
Root length cm |
Homogeneous groups |
|
|
T1 |
10,7935 |
A |
|
|
T2 |
9,3970 |
A |
|
|
T0 |
9,2830 |
A |
|
|
T3 |
4,7545 |
B |
|
|
T4 |
3,9470 |
|
B |
Table 8: Classification of durum wheat varieties into homogeneous groups, according to Newman and Keuls test for shoot dry matter weight.
|
Variety |
Shoot dry matter weight g |
Homogeneous groups |
|
|
Oued elbared |
0,34 |
A |
|
|
Vitron |
0,27 |
A |
B |
|
Gta dur |
0,27 |
A |
B |
|
Bousselam |
0,25 |
B |
|
|
Simeto |
0,23 |
|
B |
The results concerning the interaction (Variety × Treatment) on shoot dry weight revealed 13 homogeneous groups: A, AB, ABC, ABCD, ABCDE, ABCDEF, ABCDEFG, BCDEFG, CDEFG, DEFG, EFG, FG, and G.
The highest shoot dry weight was recorded in the Gta Dur variety under the T1 treatment, reaching 0.44 g and classified in group A. In contrast, the lowest shoot dry weight was also observed in the same variety (Gta Dur) under the T4 treatment, with 0.06 g, classified in group G (Figure 4).
Root dry matter weight
Root length in durum wheat varieties decreased with increasing salinity, especially with severe stress (T3 and T4), significantly inhibiting root growth; however, Gta Dur exhibited relatively longer roots, under low NaCl concentrations (T0, T1, and T3) (Figure 5).
The analysis of variance shows significant differences in root dry matter production among varieties, categorizing them into two groups: Group A includes Gta Dur with the highest root dry matter weight of 0.31 g, while Group B contains Oued Elbared (0.25 g), Simeto (0.21 g), Bousselam (0.20 g), and Vitron (0.18 g) (Table 10).
Table 9: Classification of NaCl concentration into homogeneous groups, according to Newman and Keuls test for shoot dry matter weight.
|
NaCl concentration |
Shoot dry matter weight g |
Homogeneous groups |
|
|
T1 |
0,36 |
A |
|
|
T0 |
0,35 |
A |
|
|
T2 |
0,32 |
A |
|
|
T3 |
0,19 |
B |
|
|
T4 |
0,15 |
|
B |
Table 10: Classification of durum wheat varieties into homogeneous groups, according to Newman and Keuls test for root dry matter weight.
|
Variety |
Root dry matter weight g |
Homogeneous groups |
|
|
Gta dur |
0,31 |
A |
|
|
Oued elbared |
0,25 |
B |
|
|
Simeto |
0,21 |
B |
|
|
Bousselam |
0,20 |
B |
|
|
Vitron |
0,18 |
|
B |
Table 11: Classification of NaCl concentration into homogeneous groups, according to Newman and Keuls test for root dry matter weight.
|
NaCl concentration |
Root dry matter weight g |
Homogeneous groups |
|
|
T0 |
0,29 |
A |
|
|
T2 |
0,26 |
A |
|
|
T1 |
0,26 |
A |
|
|
T3 |
0,19 |
B |
|
|
T4 |
0,15 |
|
B |
Analysis of variance indicates a significant relationship between treatments and root dry matter weight relative to NaCl concentration, creating two groups: A (T0, T2, T1) with higher weights (0.29 g, 0.26 g, 0.26 g) and B (T3, T4) with lower weights (0.19 g, 0.15 g). It reveals that salinity negatively impacts root dry matter weight, particularly in treatments T3 and T4 (Table 11).
The results concerning the interaction (Variety × Treatment) on root dry weight revealed 12 homogeneous groups: A, B, BC, BCD, BCDE, BCDEF, BCDEFG, CDEFG, DEFG, EFG, FG, and G.
The highest root dry weight was recorded in the Gta Dur variety under the T0 treatment (control), reaching 0.60 g and classified in group A. In contrast, the lowest root dry weight was also observed in the same variety (Gta Dur) under the T4 treatment, with 0.10 g, classified in group G.
Discussion
Salt stress markedly impacts the germination and seedling growth of durum wheat (Triticum durum Desf.), essential for sustaining agricultural production in arid and semi-arid areas. Elevated salinity levels hinder water accessibility and osmotic equilibrium, adversely affecting seed germination and diminishing seedling vitality ; .
Durum wheat exhibits various physiological responses under saline conditions, such as reduced photosynthetic efficiency and disrupted nutrient uptake, which collectively hinder growth and development . Khoshbakht et al. (2021) found that moderate salinity significantly decreased root length and biomass, underscoring the pivotal contribution of root architecture in salinity tolerance. These findings underscore the intricate interaction between salinity stress and plant developmental processes, reinforcing the necessity of breeding for improved germination and early growth traits to enhance durum wheat’s resilience to salinity.
Salt stress presents a major constraint to durum wheat, especially in areas where irrigation practices contribute to soil salinization. Elevated salinity levels hinder germination by inducing osmotic stress, limiting water uptake, and triggering physiological changes that compromise seedling establishment .
Beyond germination, salt stress significantly affects seedling growth traits, including root length, shoot height, and biomass accumulation. Several authors have reported that salinity decreases the height of plants such as tomatoes and beans and some varieties of quinoa . Khoshbakht et al. (2021) reported that moderate salinity (50 mM NaCl) markedly reduced root length and shoot height, along with decreases in leaf area and chlorophyll content.
The physiological responses of durum wheat to salt stress involve complex mechanisms, including alterations in ion homeostasis and the accumulation of osmoprotectants. Ashraf and Harris (2013) emphasized that plants employ various strategies to mitigate salinity effects, including the manufacture of suitable solutes such as proline and glycine betaine, which assist in preserving cellular turgor and protect structural integrity. These osmotic adjustments are vital for sustaining growth under saline conditions. Equally important is the regulation of ion transport and maintenance of ion balance, critical for durum wheat’s performance in saline environments . The observed genetic variability among cultivars in their salt tolerance presents valuable opportunities for breeding programs aimed at developing resilient varieties adapted to saline soils.
Germination is particularly sensitive to saline stress due to ion toxicity and adverse osmotic effects . Several studies have reported that salinity decreases plant height in species such as tomatoes and beans and in certain quinoa varieties . Ghiyasi et al. (2008); Datta et al. (2009); Jamal et al. (2011); noted that salinity significantly influences root and shoot length in wheat, while Ouhaddach et al. (2018) and Datta et al. (2009) noted that salt stress impacts the shoot dry weights of wheat crops. Additionally, Tammam et al. (2008) reported that salt stress affects root dry weight in wheat.
Conclusion
This study highlights the detrimental impact of salt stress on durum wheat productivity, revealing that the response varies by variety and NaCl dose. Treatments T3 (9 g/L) and T4 (12 g/L) particularly harm all varieties. Bousselam recorded the highest germination rate at 87.36%, while Simeto had the lowest at 73.88%. Epicotyl lengths shrank with increased salinity, with Vitron showing the longest. Root lengths were similar at low salinity but differed significantly at higher concentrations. Severe salt stress notably decreased shoot dry matter, with Oued Elbared producing the most. Overall, salinity adversely affected root lengths and dry matter, with GTA Dur exhibiting the best tolerance related to NaCl concentrations.
Acknowledgement
The authors would like to express their sincere gratitude to the Department of Agricultural Sciences, University of M’Sila, the Department of Agricultural Sciences, University of Biskra, and the Technical Institute for the Development of Saharan Agriculture (ITDAS), Biskra, Algeria, for their academic, technical, and logistical support. The authors also gratefully acknowledge the laboratory staff and all individuals who contributed to the field and laboratory work, experimental activities, and data collection.
Novelty Statement
This study provides a comparative assessment of five durum wheat (Triticum durum Desf.) cultivars under a progressive NaCl salinity gradient (312 g/L), revealing cultivar-specific responses in germination, early seedling growth, and biomass allocation. Notably, Bousselam showed the highest germination performance under salinity, while GTA Dur maintained greater root dry biomass under severe salt stress, providing new insights for the selection of durum wheat cultivars with improved salinity tolerance.
Author’s Contribution
Madani Djamila: Conceived the idea of the study, developed the methodology, wrote the original draft.
Hiouani Fatima: Contributed to data collection and feldwork.
Aissaoui Hichem: Assistance in study conception.
Afif Rania: Field and Laboratory Work.
Boukhlouf Wahiba: Manuscript revision assistance.
All authors reviewed and approved the final version of the manuscript.
Generative AI and AI assisted technology statement
The authors declare that no generative AI and AI assisted technology was used in the creation of this manuscript.
Conflict of interest
The authors have declared no conflict of interest.
Figures
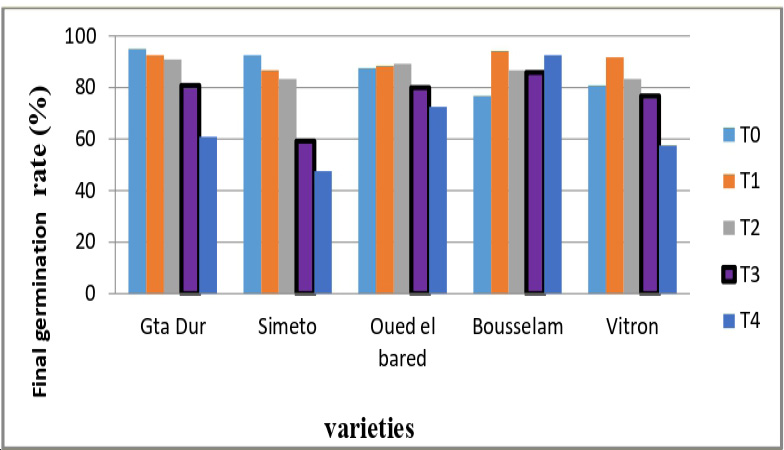
Final germination rates of five durum wheat cultivars influenced by saline concentrations.
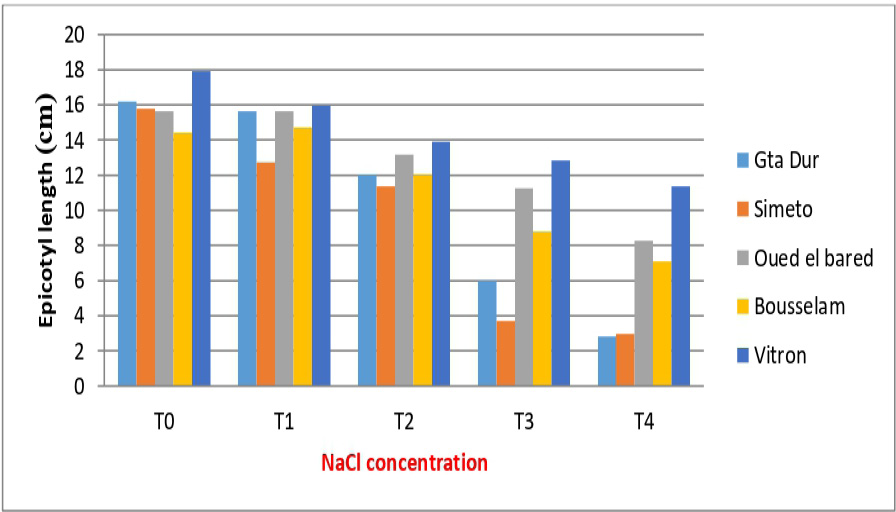
Epicotyl length of five durum wheat cultivars influenced by saline concentrations.
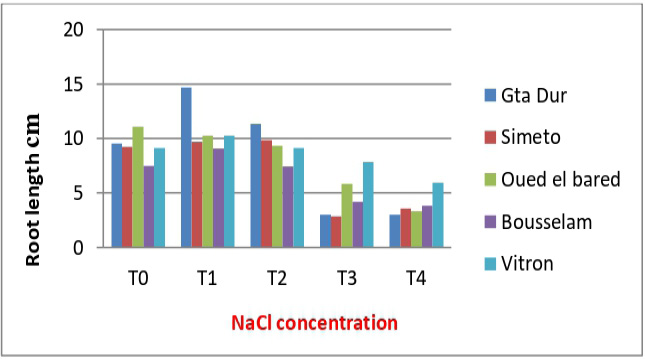
Root lengths of five durum wheat cultivars influenced by varying saline concentrations.
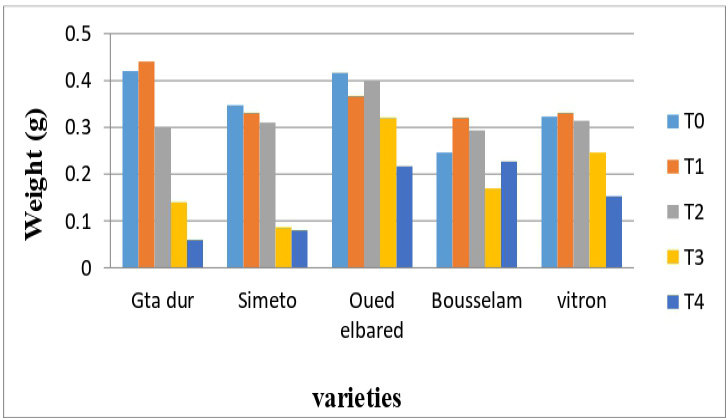
Shoot dry matter production of five durum wheat cultivars influenced by saline concentrations.
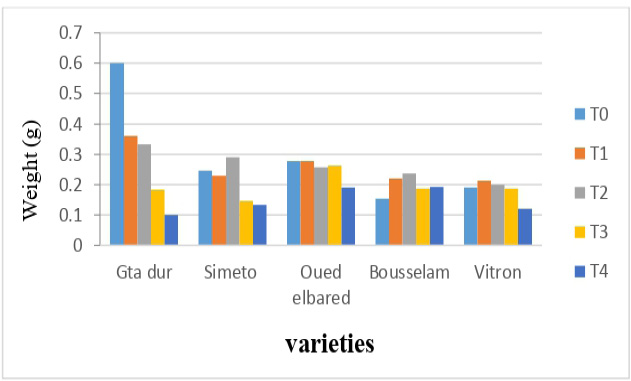
Root dry matter production of five durum wheat cultivars influenced by salt levels.
References
- Ashraf, M. and Harris, P.J.C., 2013. Photosynthesis under salt stress: A review. Photosynthetica, 51(1): 1–12. https://doi.org/10.1007/s11099-013-0021-6[CrossRef]
- Azooz, A. and Mahgoub, M., 2013. Salt stress in plants: Signalling, omics and adaptations. Springer, New York. pp. 314.
- Bewley, J.D. and Black, M., 1994. Seeds: Physiology of development and germination (3rd ed.). New York: Plenum Press, 445 p. https://doi.org/10.1007/978-1-4899-1002-8[CrossRef]
- Boufenar, Z.F. and Zaghouane, O., 2006. Guide des principales varietes de cereales a paille en Algerie. El Harrach, Algeria: Institut Technique des Grandes Cultures (ITGC).
- Brahimi, H.R., 2017. Variations phénotypiques de la tolérance à la salinité et au stress hydrique chez le blé tendre (Triticum aestivum L.). (Phenotypic variations for tolerance to salinity and water stress in bread wheat (Triticum aestivum L.) (Master’s thesis). Université Mohamed Boudiaf - M’Sila, Algeria. 76p.
- Butcher, K., Wick, A.F., DeSutter, T., Chatterjee, A. and Harmon, J., 2016. Soil salinity: A threat to global food security. Agron. J., 108(6): 2189–2200. https://doi.org/10.2134/agronj2016.06.0368[CrossRef]
- Cuevas, J., Daliakopoulos, I.N., del Moral, F., Hueso, J.J., Tsanis, I.K., 2019. A review of soil-improving cropping systems for soil salinization. Agronomy, 9: 295. https://doi.org/10.3390/agronomy9060295[CrossRef]
- Datta, J.K., Nag, S., Banerjee, A. and Mondal, N.K., 2009. Impact of salt stress on five varieties of Wheat (Triticum aestivum L.) cultivars under laboratory condition. J. Appl. Sci. Environ. Manage., 13(3): 93-97. https://doi.org/10.4314/jasem.v13i3.55372[CrossRef]
- Dilmi, K. and Marhoune, S., 2019. Effet de la salinité sur la Germination et la croissance de quelques variétés de Quinoa (Chenopodium quinoa Willd) introduites et cultivées en Algérie. (Effect of salinity on germination and growth of some quinoa (Chenopodium quinoa Willd.) varieties introduced and cultivated in Algeria (Master’s thesis). Université Mohamed Boudiaf - M’Sila, Algeria. pp. 112.
- El-Hendawy, S.E., Ruan, Y., Hu, Y. and Schmidhalter, U., 2009. A comparison of screening criteria for salt tolerance in wheat under field and environment controlled conditions. J. Agron. Crop Sci., 49: 1–9.
- Food and Agriculture Organization of the United Nations (FAO), 2024. Global assessment of salt affected soils. Main report. Rome
- Genc, Y., Glenn, K., Mcdonald, B. and Tester, M., 2007. Reassessment of tissue Na+ concentration as a criterion for salinity tolerance in bread wheat. Plant Cell Environ., pp. 1486-1498. https://doi.org/10.1111/j.1365-3040.2007.01726.x[CrossRef]
- Ghiyasi, M., Seyahjani, A.A., Tajbakhsh, M., Amirnia, R. and Salehzadeh, H., 2008. Effect of osmopriming with polyethylene glycol (8000) on germination and seedling growth of wheat (Triticum aestivum L.) seeds under salt stress. J. Biol. Sci., 3: 1249–1251.
- Gupta, B. and Huang, B., 2014. Mechanism of salinity tolerance in plants: Physiological, biochemical, and molecular characterization. Int. J. Genom., 2014, Article ID 701596, 18 pages. https://doi.org/10.1155/2014/701596[CrossRef]
- Hu, H., Liu, H. and Liu, F., 2018. Seed germination of hemp (Cannabis sativa L.) cultivars responds differently to the stress of salt type and concentration. Ind. Crops Prod., 123: 254–261. https://doi.org/10.1016/j.indcrop.2018.06.089[CrossRef]
- Hussain, K., Majeed, A., Nawaz, K., Khizar, H.B. and Nisar, M.F., 2009. Effect of different levels of salinity on growth and ion contents of black seeds (Nigella sativa L.). Curr. Res. J. Biol. Sci., 1: 135–138.
- Hussain, S., Shaukat, M., Ashraf, M., Zhu, C., Jin, Q. and Zhang, J., 2019. Salinity stress in arid and semi-arid climates: Effects and management in field crops. In Climate Change and Agriculture; IntechOpen: London, UK. https://doi.org/10.5772/intechopen.87982[CrossRef]
- Jamal, Y., Shafi, M., Bakht, J. and Arif, M., 2011. Seed priming improves salinity tolerance of wheat varieties. Pak. J. Bot., 43: 2683–2686.
- Khoshbakht, K., Moghaddam, M. and Ranjbar, B., 2021. The influence of salinity on growth and physiological traits of durum wheat. Plant Physiol. Biochem., 159: 90-98.
- Lugan, R., 2008. Phénologie métabolique des réponses aux stress abiotiques chez Arabidopsis thaliana: Analyse fonctionnelle et intégrative de métabolome (Metabolic phenology of responses to abiotic stresses in Arabidopsis thaliana: Functional and integrative analysis of the metabolome) (Doctoral thesis). University of Rennes 1, France. 220p.
- Luo, J.Y., Zhang, S., Peng, J., Zhu, X.Z., Lv, L.M., Wang, C.Y., Li, C.H., Zhou, Z.G. and Cui, J.J., 2017. Effects of soil salinity on the expression of Bt toxin (Cry1Ac) and the control efficiency of Helicoverpa armigera in field-grown transgenic Bt cotton. PLoS One, 12(1): e0170379. https://doi.org/10.1371/journal.pone.0170379[CrossRef]
- Manono, B.O., 2026. Effects of salinity on seed germination: Mechanisms, impacts, and mitigation strategies. Seeds, 5(1): 1. https://doi.org/10.3390/seeds5010001[CrossRef]
- Munns, R. and Tester, M., 2008. Mechanisms of salinity tolerance. Ann. Rev. Plant Biol., 59: 651-681. https://doi.org/10.1146/annurev.arplant.59.032607.092911[CrossRef]
- Ouhaddach, M., Elyacoubi, H., Douaik, A. and Rochdi, A., 2018. Morpho-physiological and biochemical responses to salt stress in wheat (Triticum aestivum L.) at the heading stage. J. Mater. Environ. Sci., pp. 1902-1903.
- Royo, A. and Abió, D., 2003. Salt tolerance in durum wheat cultivars. Spanish J. Agric. Res., 1: 27–35. https://doi.org/10.5424/sjar/2003013-32[CrossRef]
- Saddiq, M.S., Iqbal, S., Hafeez, M.B., Ibrahim, A.M.H., Raza, A., Fatima, E.M., Baloch, H., Jahanzaib, Woodrow, P. and Ciarmiello, L.F., 2021. Effect of salinity stress on physiological changes in winter and spring wheat. Agronomy, 11(6): 1193. https://doi.org/10.3390/agronomy11061193[CrossRef]
- Shrivastava, P. and Kumar, R., 2015. Soil salinity: A serious environmental issue and plant growth-promoting bacteria as one of the tools for its alleviation. Saudi J. Biol. Sci., 22(2): 123–131. https://doi.org/10.1016/j.sjbs.2014.12.001[CrossRef]
- Snoussi, S.A. and Halitim, A., 1998. Valorisation des eaux salines pour la nutrition minérale des plantes cultivées : cas de la tomate et du haricot. Étude et gestion des sols (Valorization of saline water for mineral nutrition of cultivated plants: Case of tomato and bean. 289 p.
- Soltabayeva, A., Ongaltay, A., Omondi, J.O. and Srivastava, S., 2021. Morphological, physiological and molecular markers for salt-stressed plants. Plants, 10: 243. https://doi.org/10.3390/plants10020243[CrossRef]
- Stira, K., 2020. Sélection des génotypes tolérants au stress salin pendant la germination, la croissance, et le développement chez le blé dur (Triticum turgidum subsp., durum Desf.). Selection of genotypes tolerant to salinity (stress during germination, growth, and development in durum wheat (Triticum turgidum subsp. durum Desf.) (Master’s thesis). Université Mohammed V de Rabat, Morocco. 105p.
- Stoleru, V., Slabu, C., Vitanescu, M., Peres, C., Cojocaru, A., Covasa, M. and Mihalache, G., 2019. Tolerance of three quinoa cultivars (Chenopodium quinoa Willd.) to salinity and alkalinity stress during germination stage. Agronomy, 9: 287. https://doi.org/10.3390/agronomy9060287[CrossRef]
- Sultan, M.T., Mahmud, U. and Khan, M.Z., 2023. Addressing soil salinity for sustainable agriculture and food security: Innovations and challenges in coastal regions of Bangladesh. Future Foods, 8: 100260. Elsevier. https://doi.org/10.1016/j.fufo.2023.100260[CrossRef]
- Tammam, A., Abou Alhamd, M.F. and Hemeda, M.M., 2008. Study of salt tolerance in wheat (Triticum aestium L.) cultivar Banysoif. Austral. J. Crop Sci., pp. 117.
- Tonde, P. and Chabot, F., 2011. A regional view of wheat markets and food security in central Asia with a focus on Afghanistan and Tajikistan. united states: Fews Net Us Aid.
Services
Article usage statistics
Loading…