
The aim of this study was to investigate the effects of intrauterine growth retardation (IUGR) on growth, meat quality and muscle fiber composition in pigs. Sixteen piglets with normal birth weight (NBW, body weight (BW) = 1.71 ± 0.04 kg) and sixteen piglets of low body weight with IUGR (BW = 0.93 ± 0.03 kg) at birth were procured. Blood samples were collected at 28, 66, and 160 days of age from both groups. Longissimus dorsi muscle samples were collected from four selected pigs at 160 days of age. Body weight, ADG and ADFI were decreased significantly by IUGR from birth to 160 days of age (P<0.05). At 28 and 160 days of age, the serum urea nitrogen levels of the IUGR pigs were significantly higher than the NBW pigs (P<0.05). The serum insulin levels of the IUGR pigs were significantly lower (P<0.05) than the NBW pigs at 28 and 66 days of age. The serum leptin level was significantly higher (P<0.05) in the IUGR pigs at 28 days of age while it decreased significantly (P<0.05) at 160 days of age as compared to the NBW pigs at the same age. Fatty acid composition of the longissimus dorsi muscle was not affected by IUGR (P>0.05). Furthermore, b*, L*, and C* values, pressure loss, and the ratio of MyHC IIb to other isoforms of the longissimus dorsi muscle were increased significantly by IUGR (P<0.05). Our results suggested that IUGR resulted in low postnatal growth rates, increased ratio of MyHC IIb to other isoforms, lower water-holding capacity and meat color of slaughtering pigs.
Research Article · Volume 50, Issue 3, 25 April 2018 · Open Access
Effects of Intrauterine Growth Retardation on Growth, Meat Quality and Muscle Fiber Composition of Pigs
· · · · · · ·
Affiliations & Notes ⌄
- 1College of Animal Science and Technology, Nanjing Agricultural University, Nanjing 210095, P.R. China , * Corresponding author: tianwangnjau@163.com
Article Info ⌄
- Journal:
- Pakistan Journal of Zoology
- Published:
- 25 April 2018

From the article
- In the present experiment, the serum leptin levels in IUGR piglets at 28 days of age were significantly higher than the NBW pigs.
- In the present study we found that the IUGR significantly increased the ratio of MyHC IIb to other isoforms in longissimus dorsi muscle of pigs.
- However, the results of our present study found that the PGC-1α mRNA gene expression in longissimus dorsi muscle was not significantly different between IUGR and NBW pigs.
Selected from the article's own text.
Abstract
Introduction
Litter size in mammals is an important maternal trait affected by many factors including heritability, ovulation rate, uterine capacity, embryonic/fetal survival, maternal nutrition and uterine environment , 2006). During the last decades, genetic selection tried to increase litter size. However, birth weight decreased with increasing litter size and proportion of pigs with low birth weight within litter significantly increased . Intrauterine growth retardation (IUGR) refers to impaired growth and development of the mammalian embryo/fetus or its organs during pregnancy . Intrauterine growth retardation can be measured as fetal or birth weight less than 2 standard deviations of the mean body weight for gestational age . The incidence of IUGR is approximately 3 to 7% in humans and approximately 15 to 20% in pig production . Intrauterine growth retardation increases the risk of developing obesity, hypertension and type II diabetes in adults . It can lead to low piglet survival rates and weaning weights which ultimately affects growth rate in subsequent developmental stages, nutrient utilization rate, body composition, meat quality, reproductive performance and health ; , and thus greatly affects pig production industry.
A reduction in the total number of muscle fibers was found in IUGR pigs which limits lean meat production and increases fat deposition in IUGR pigs after birth ; . Furthermore, the reduction of muscle fiber numbers promotes muscle fiber hypertrophy and lower the quality of meat in IUGR pigs after slaughtering ; , 2006). Although the number of muscle fibers does not change after birth and the muscle fiber types are also not fixed during muscle fiber formation and maturation . Bauer et al. (2006) found that the ratio of myosin heavy chain (MyHC) I to other isoforms of the flexor digitorum superficialis muscle and gastrocnemius medialis muscle significantly increased in neonatal IUGR piglets. It is well known that maternal nutrient restriction during early to mid- pregnancy had increased the ratio of MyHC IIb to other isoforms in the longissimus dorsi muscle in the offspring by 17.6% as compared with offspring of ad libitum fed ewes . These changes in the muscle fiber type composition directly affect meat quality of the animals , 2006; ; .
Therefore, the aims of this study were to investigate 1) the effects of IUGR on growth performance, serum biochemistry and hormonal indicators of pigs at different stages of growth after birth; and 2) the effects of IUGR on muscle fiber composition and meat quality of longissimus dorsi muscle in finishing pigs.
Materials and Methods
Animals
All procedures were approved by the Institutional Animal Care and Use Committee of Nanjing Agricultural University, China. A total of 32 newborn piglets [Duroc × (Landrace × Yorkshire)] from 16 sows with the same litter size (10 piglets/litter) were selected for this study at parturition. From each litter, one normal body weight (NBW) piglet (BW = 1.71 ± 0.04 kg) and one IUGR littermate (BW = 0.93 ± 0.03 kg) were chosen according to previously published methods , 2012; . Both the NBW and IUGR piglets were suckled naturally until weaning at 21 days of age. After weaning, there were four replicates of both NBW and IUGR piglets and each replicate had four piglets fed common diet ad libitum daily (Table I). The common diets met NRC (1998) requirements. The pigs were weighed at birth, 21 and 160 days of age. The average daily gain (ADG) and average daily feed intake (ADFI) of pigs were recorded and feed conversion ratio (FCR) was calculated.
Samples collection
Blood samples were collected at 28, 66 and 160 days of age, into 10 mL centrifuge tubes from anterior vena cava and allowed to stand for 2 h at 4ºC. Later, these blood samples were centrifuged at 3,000 rpm for 15 min at 4ºC for serum collection. Serum samples from each replicate were mixed together. All serum samples were stored at -20ºC in freezer for further analysis of biochemical and hormonal indicators. At 160 days of age, four pigs with nearly equal BW from each group were selected for longissimus dorsi muscle samples. The pigs were held under general anesthesia and sacrificed by intramuscular injections of sodium pentobarbital (50 mg/kg BW), 2 h after their last meal. A half of the muscle samples were used to measure the meat quality at 4ºC for 24 h, 1/4 of the meat samples were stored at -20ºC for the fatty acid analysis and the remaining one-fourth of the meat samples were stored in liquid nitrogen for the analysis of muscle fiber type composition and its related molecular markers.
Serum biochemical and hormonal indicators
Total protein, urea nitrogen and glucose levels in serum were measured using commercial assay kits (Nanjing Jiancheng Bioengineering Institute, Nanjing, China) by following the manufacturer’s protocols. Serum insulin, insulin-like growth factor 1 (IGF-1), growth hormone, and leptin levels were determined using commercial ELISA 152 kits (USCN Life Science Corporation, Wuhan, China) by following the manufacturer’s protocols. The protein concentrations were measured using Lowry et al. (1951) method.
Table I.- Ingredients and nutrient content of the common diets.
| Days | ||||
| 21-28 | 29-66 | 67-120 | 121-160 | |
| Ingredients (%) | ||||
| Corn | 40.10 | 62.70 | 73.74 | 77.19 |
| Soybean meal | 10.00 | 14.52 | 22.69 | 19.35 |
| Extruded soybean | 25.00 | 13.65 | 0.00 | 0.00 |
| Premix* | 4.00 | 4.00 | 1.00 | 1.00 |
| L-lysine HCl | 0.50 | 0.15 | 0.08 | 0.08 |
| Whey powder | 20.40 | 3.00 | 0.00 | 0.00 |
| Dicalcium phosphate | 0.00 | 1.28 | 1.25 | 1.10 |
| Limestone | 0.00 | 0.55 | 0.84 | 0.93 |
| Salt | 0.00 | 0.15 | 0.40 | 0.35 |
| Total | 100.00 | 100.00 | 100.00 | 100.00 |
| Chemical composition** (%) | ||||
| Gross energy (MJ/kg) | 18.35 | 17.59 | 16.95 | 16.99 |
| Digestible energy (MJ/kg) | 15.14 | 14.41 | 13.90 | 13.85 |
| Crude protein (%) | 23.00 | 19.50 | 18.09 | 15.97 |
| Total lysine (%) | 1.59 | 1.06 | 0.92 | 0.81 |
| Total calcium (%) | 0.96 | 0.85 | 0.63 | 0.64 |
| Total phosphorus (%) | 0.63 | 0.58 | 0.54 | 0.51 |
| Available phosphorus (%) | 0.41 | 0.38 | 0.30 | 0.27 |
*Provided per kg of diet for pigs from 21-66 days of age: vitamin A, 8,000 IU; vitamin D3, 500 IU; vitamin E, 40 IU; vitamin K3, 2 mg; vitamin B1, 4 mg; vitamin B 2, 5 mg; vitamin B6, 2.00 mg; vitamin B 12, 0.0098 mg; niacin, 20 mg; pantothenic acid, 15 mg; folic acid, 1 mg; biotin, 0.5 mg; choline chloride, 550 mg; copper, 150 mg; iron, 80 mg; manganese, 30 mg; zinc, 100 mg; iodine, 0.4 mg; and selenium, 0.3 mg. For pigs from 67-160 days of age: vitamin A, 5,500 IU; vitamin D3, 400 IU; vitamin E, 20 IU; vitamin K3, 1.63 mg; vitamin B1, 1.58 mg; vitamin B2, 4.73 mg; vitamin B6, 2.00 mg; vitamin B12, 0.0098 mg; niacin, 15.75 mg; pantothenic acid, 6.51 mg; folic acid, 0.65 mg; biotin, 0.47 mg; choline chloride, 350 mg; iron, 80 mg; manganese, 20 mg; zinc, 50 mg; iodine, 0.4 mg; and selenium, 0.3 mg. **All nutrient content, except for the digestible energy, were analyzed.
Table II.- Primer sequences and PCR product lengths of the target genes.
| Gene | Product length (bp) | Primer sequence (5′- 3′) | Accession No. |
| MyHC I | 115 | Forward: AAGGGCTTGAACGAGGAGTAGA | AB053226 |
| Reverse: TTATTCTGCTTCCTCCAAAGGG | |||
| MyHC IIa | 137 | Forward: GCTGAGCGAGCTGAAATCC | AB025260 |
| Reverse: ACTGAGACACCAGAGCTTCT | |||
| MyHC IIx | 166 | Forward: AGAAGATCAACTGAGTGAACT | AB025262 |
| Reverse: AGAGCTGAGAAACTAACGTG | |||
| MyHC IIb | 149 | Forward: ATGAAGAGGAACCACATTA | AB025261 |
| Reverse: TTATTGCCTCAGTAGCTTG | |||
| PGC-1α | 101 | Forward: GCAGAAGAGCCGTCTCTACTTAAGA | AB106108 |
| Reverse: TTTGCATGGTTCTGGGTACTGA | |||
| GAPDH | 149 | Forward: GAAGGTCGGAGTGAACGGAT | CV874334 |
| Reverse: CATGGGTAGAATCATACTGGAACA |
MyHC I, myosin heavy chain isoform I; MyHC IIa, myosin heavy chain isoform IIa; MyHC IIb, myosin heavy chain isoform IIb; MyHC IIx, myosin heavy chain isoform IIx; GAPDH, glyceraldehyde-3-phosphate dehydrogenase.
Meat quality
Meat color, shear force, pressure loss and chemical composition were analyzed after 24 h postmortem. Color of longissimus dorsi muscle was determined using a Minolta Chroma Meter CR-400 (Minolta Co., Ltd., Japan). Lightness (L*), redness (a*) and yellowness (b*) of longissimus dorsi muscle were recorded and these values were used to calculate the chroma (C*) and hue angle (h), where C* = (a*2 + b*2)½ and h = ATAN (b* / a*) × 180 / π . Shear force values were calculated according to the method as described by Meek et al. (2000). Muscle tissues were trimmed into approximately 1-mm-thick pieces for measurement of pressure loss values. Briefly, a circular sampler was used for cutting and collection of the samples, initial weight (W1) was recorded. The muscle tissue samples were wrapped with gauze, tightly encased in absorbent paper and then placed in a YYW-2 strain controlled unconfined compression apparatus (Nanjing Soil Instrument Co., Ltd.) under 35 kg of pressure for 5 min. The muscle samples were then removed from the absorbent paper and gauze and final weight was denoted as W2. Pressure loss was calculated by using the following formulae: pressure loss (%) = (W1 - W2) / W1 × 100. pH were measured 45 min and 24 h postmortem on the same samples, using a portable pH meter (HI9023, Hanna Instruments, Padova, Italy) equipped with an insertion glass electrode (FC 230B, Hanna Instruments). Dry matter, lipid, protein and ash contents of longissimus dorsi muscle were analyzed using the AOAC (1990) methods.
Fatty acid composition
Fat was extracted from longissimus dorsi muscle by following Folch et al. (1957). The extracted fats were subjected to saponification and methyl esterification, and the fatty acid profile was determined using a GC-2014C gas chromatograph (Shimadzu Corporation; Suzhou, China) with a flame ionization detector. A CP-sil88 chromatography column (50 m × 0.25 mm i.d. × 0.20 μm film) was used; the carrier gas was 60 kPa nitrogen (99.999% pure) and 60 kPa hydrogen (99.99% pure), the air pressure was 50 kPa, the column temperature was ramped from 140 to 220°C at 5°C/min, the monitor temperature was 280°C, the inlet temperature was 280°C, and the split ratio was 1/50. The fatty acid content was determined by comparing the retention times to a standard (Sigma; Shanghai, China). The results were expressed as the percentage of an individual fatty acid out of the total methylated fatty acids.
Real-time PCR
Myosin heavy chain I, MyHC IIa, MyHC IIb, MyHC IIx and peroxisome proliferator-activated receptor gamma (PPARγ) coactivator 1-alpha (PGC-1α) mRNA gene expressions in longissimus dorsi muscle were quantitatively determined by real-time PCR. Total RNA from longissimus dorsi muscle was collected using Trizol Reagent (Takara Bio, Inc., Dalian, China). The isolated RNA pellets were diluted and quantified by their absorbance at 260/280 nm before storing at -70°C prior to cDNA synthesis. First-strand cDNA was synthesized from 1 μg of the total RNA using oligo dT primers and RNase M-MLV according to the manufacturer’s instructions. The primer sequences for MyHC I, IIa, IIb, IIx and PGC-1α genes were shown in Table II. Based on the SYBR® Premix Ex TaqTM II kit manual (Takara Bio, Inc., Dalian, China), an ABI 7300 system (Applied Biosystems, Foster City, CA) was used to quantify the reverse transcription products. The reaction system volume was 20 μL and included 10 μL 2× SYBR® Premix Ex TaqTM II, 0.4 μL sense primer (10 μM), 0.4 μL antisense primer (10 μM), 0.4 μL ROX Reference Dye (50×), 2 μL cDNA, and 6.8 μL 0.1% (v/v) diethy pyrocarbonate. The following real-time PCR reaction conditions were used: preheat at 95°C for 30 s, denature at 95°C for 5 s for 40 cycles, and anneal at 60°C for 31 s. The results were calculated as literature ; ; .
Statistical analysis
All the data were analyzed by t-test using the SPSS 17.0 (Statistical Product and Service Solutions, Inc., USA). All of the results are presented as the mean ± the standard error. P<0.05 was considered statistically significant.
Results
Growth performance
Body weight of IUGR pigs were significantly lower (P<0.05) than the NBW pigs from birth to 160 days of age (Table III). Furthermore, ADG and ADFI of the IUGR pigs were significantly lower (P<0.05) than the NBW pigs during the whole experimental period (21-160 d), while the IUGR pigs tended to have increased FCR (P = 0.053) (Table III).
Table III.- Growth performance in NBW and IUGR pigs from
| NBW | IUGR | P values | |
| Body weight (kg) | |||
| Birth weight | 1.71 ± 0.04 | 0.93 ± 0.03 | < 0.001 |
| 21 d | 6.96 ± 0.17 | 4.65 ± 0.11 | < 0.001 |
| 160 d | 86.14 ± 0.84 | 71.85 ± 3.88 | 0.011 |
| 21 to 160 days | |||
| ADG, (g/d) | 571.80 ± 6.00 | 479.30 ± 27.00 | 0.016 |
| ADFI, (g/d) | 1543.10±21.10 | 1398.30±45.70 | 0.028 |
| FCR | 2.70 ± 0.04 | 2.93 ± 0.09 | 0.053 |
Values are means ± SE. NBW, normal birth weight; IUGR, intrauterine growth retardation; ADG, average daily gain; ADFI, average daily feed intake; FCR, feed conversion ratio.
Serum biochemical and hormonal analysis
At 28 and 160 days of age, the serum urea nitrogen levels of the IUGR pigs were significantly higher (P<0.05) than NBW pigs (Table IV). The serum insulin levels of the IUGR pigs were significantly lower (P<0.05) than NBW pigs at 28 and 66 days of age whereas it was not significantly different (P>0.05) at 160 days of age. IUGR did not significantly affect the serum IGF-1 and growth hormone levels at 28, 66 and 160 days of age in pigs. Serum leptin level was significantly higher (P<0.05) in the IUGR pigs at 28 days of age while it was significantly decreased (P<0.05) at 160 days of age compared to the NBW pigs.
Table IV.- Serum biochemical marker and hormonal analysis of NBW and IUGR pigs at d 28, 66, and 160 days of age.
| NBW | IUGR | P values | |
| 28 d | |||
| Total protein (g/L) | 34.24 ± 1.18 | 30.63 ± 0.63 | 0.036 |
| Glucose (mmol/L) | 5.23 ± 0.47 | 5.14 ± 0.26 | 0.873 |
| BUN (mmol/L) | 1.45 ± 0.11 | 2.65 ± 0.25 | 0.005 |
| Insulin (pmol/L) | 89.68 ± 0.64 | 63.12 ± 4.23 | 0.001 |
| IGF-1 (nmol/L) | 2.41 ± 0.14 | 1.95 ± 0.15 | 0.066 |
| GH (pmol/L) | 231.31±12.20 | 228.26±17.82 | 0.893 |
| Leptin (pmol/L) | 41.57 ± 2.06 | 70.93 ± 4.38 | 0.001 |
| 66 d | |||
| Total protein (g/L) | 49.21 ± 2.44 | 42.56 ± 5.15 | 0.348 |
| Glucose (mmol/L) | 5.96 ± 0.47 | 4.09 ± 0.43 | 0.036 |
| BUN (mmol/L) | 1.58 ± 0.05 | 1.50 ± 0.06 | 0.366 |
| Insulin (pmol/L) | 107.96 ± 4.53 | 64.07 ± 3.95 | 0.001 |
| IGF-1 (nmol/L) | 2.26 ± 0.20 | 1.84 ± 0.11 | 0.112 |
| GH (pmol/L) | 314.65±23.85 | 282.47±44.15 | 0.590 |
| Leptin (pmol/L) | 43.16 ± 4.61 | 55.98 ± 6.73 | 0.207 |
| 160 d | |||
| Total protein (g/L) | 50.83 ± 2.66 | 49.95 ± 2.27 | 0.811 |
| Glucose (mmol/L) | 3.77 ± 1.67 | 2.65 ± 0.25 | 0.530 |
| BUN (mmol/L) | 2.52 ± 0.25 | 3.51 ± 0.26 | 0.034 |
| Insulin (pmol/L) | 126.49 ± 3.00 | 118.55 ± 7.46 | 0.361 |
| IGF-1 (nmol/L) | 4.44 ± 0.06 | 4.01 ± 0.25 | 0.142 |
| GH (pmol/L) | 447.72 ± 17.35 | 371.91±44.83 | 0.166 |
| Leptin (pmol/L) | 117.38 ± 5.29 | 98.90 ± 2.36 | 0.019 |
Values are means ± SE. BUN, blood urea nitrogen; GH, Growth hormone; NBW, normal birth weight; IUGR, intrauterine growth retardation; IGF-1, insulin-like growth factors -1.
Chemical composition and meat quality at 160 days of age
The IUGR did not significantly (P>0.18) affect the chemical composition (dry matter, ash, lipid and protein contents) of longissimus dorsi muscle compared to the NBW pigs at 160 days of age (Table V). There were no significant differences (P>0.15) in pH of longissimus dorsi muscle at 45 min and 24 h postmortem between the IUGR and NBW pigs (Table VI). The b*, L*, and C* values of longissimus dorsi muscle were significantly increased (P<0.05) in IUGR pigs when we compared with the NBW pigs. Compared with the NBW pigs, pressure loss in longissimus dorsi muscle of IUGR pigs was significantly increased (P<0.001). Shear force was not affected by IUGR.
Table V.- Chemical composition of longissimus dorsi muscle of NBW and IUGR pigs at 160 days of age.
| NBW | IUGR | P values | |
| Dry matter (%) | 31.81 ± 0.86 | 33.69 ± 1.18 | 0.248 |
| Ash (%) | 1.20 ± 0.17 | 1.18 ± 0.12 | 0.931 |
| Lipid (%) | 8.43 ± 0.57 | 9.90 ± 1.57 | 0.413 |
| Protein (%) | 21.10 ± 2.35 | 17.19 ± 1.06 | 0.179 |
Values are means ± SE. NBW, normal birth weight; IUGR, intrauterine growth retardation.
Table VI.- Meat quality in longissimus dorsi muscle of NBW and IUGR pigs at 160 days of age.
| NBW | IUGR | P values | |
| pH45min | 6.29 ± 0.05 | 6.29 ± 0.07 | 0.945 |
| pH 24h | 5.60 ± 0.05 | 5.51 ± 0.03 | 0.150 |
| ΔpH | 0.70 ± 0.06 | 0.78 ± 0.06 | 0.344 |
| Meat color | |||
| a* | 5.15 ± 0.55 | 5.57 ± 0.61 | 0.636 |
| b* | 7.03 ± 0.77 | 9.47 ± 0.58 | 0.042 |
| L* | 39.48 ± 1.33 | 46.70 ± 2.07 | 0.027 |
| C* | 8.75 ± 0.80 | 11.04 ± 0.34 | 0.048 |
| h | 53.51 ± 3.12 | 59.46 ± 4.05 | 0.308 |
| Shear force (kg) | 3.53 ± 0.29 | 3.64 ± 0.28 | 0.797 |
| Pressure loss (%) | 17.69 ± 0.79 | 22.88 ± 0.85 | < 0.001 |
Values are means ± SE. NBW, normal birth weight; IUGR, intrauterine growth retardation; C* = (a*2 + b*2)½; h = ATAN (b* / a*) × 180 / π.
Fatty acid composition
The IUGR tended to increase the γ-linolenic acid, myristoleic acid and arachidonic acid content of longissimus dorsi muscle (P=0.051 vs. 0.085 vs. 0.092) in pigs whereas it did not significantly affect the other fatty acids contents of longissimus dorsi muscle (P>0.1) in both IUGR and NBW pigs (Table VII) at 160 days of age.
Muscle fiber type composition
Compared to the NBW pigs at 160 days of age, the IUGR pigs significantly increased the ratio of MyHC IIb to other isoforms in longissimus dorsi muscles (P<0.05; Fig. 1). Furthermore, the IUGR pigs reduced the ratio of MyHC I and IIa to other isoforms in longissimus dorsi muscles whereas the difference was not statistically significant (P>0.05).
Table VII.- Fatty acid profile in Longissimus dorsi muscle of NBW and IUGR pigs at 160 days of age.
| NBW (%) | IUGR | P values | |
| Myristic acid (C14:0) | 1.14 ± 0.09 | 1.02 ± 0.03 | 0.242 |
| Myristoleic acid (C14:1) | 1.18 ± 0.27 | 1.81 ± 0.06 | 0.085 |
| Palmitic acid (C16:0) | 24.54±0.88 | 22.83±0.03 | 0.124 |
| Palmitoleic acid (C16:1) | 2.38 ± 0.29 | 2.08 ± 0.15 | 0.404 |
| Stearic acid (C18:0) | 15.03±1.57 | 13.91±0.20 | 0.517 |
| Oleic acid (C18:1) | 37.01±1.54 | 36.79±0.20 | 0.906 |
| Linoleic acid (C18:2, n-6) | 14.72±1.30 | 16.14±0.69 | 0.387 |
| Arachidic acid (C20:0) | - | 0.17 ± 0.00 | |
| γ-linolenic acid (C18:3, n-6) | 0.70±0.01 | 0.77 ± 0.01 | 0.051 |
| Linolenic acid (C18:3, n-3) | 0.56±0.06 | 0.56 ± 0.04 | 0.927 |
| Arachidonic acid (C20:4, n-6) | 2.41±0.50 | 3.50 ± 0.06 | 0.092 |
| SFA | 40.71±2.49 | 37.9 ±0.21 | 0.329 |
| MUFA | 40.90±2.07 | 41.11±0.96 | 0.930 |
| PUFA | 18.40±1.51 | 20.97±0.76 | 0.202 |
| PUFA/SFA | 0.46 ± 0.05 | 0.55 ± 0.02 | 0.175 |
| n-6 PUFA | 17.83±1.46 | 20.40±0.72 | 0.190 |
| n-3 PUFA | 0.56 ± 0.06 | 0.56 ± 0.04 | 0.927 |
| n-6 PUFA / n-3 PUFA | 32.01±3.01 | 36.86±1.04 | 0.202 |
Values are means ± SE. SFA, Total saturated fatty acids; MUFA, Monounsaturated fatty acid; PUFA, Polyunsaturated fatty acids; NBW, normal birth weight; IUGR, intrauterine growth retardation.
PGC-1α mRNA level
IUGR did not affect the PGC-1α mRNA gene expressions in longissimus dorsi muscle (P>0.05); however, the PGC-1α mRNA gene expression level of the IUGR pigs decreased by 17.65% compared with the NBW pigs (Fig. 2).
Discussion
The BW of IUGR pigs were significantly lower than the NBW pigs at 160 days of age (at slaughter). The ADG and ADFI of IUGR pigs during the whole experiment of 160 days were also significantly lower than NBW pigs. These results confirm the known effect of IUGR on pig growth that the low birth weight in piglet’s correlates with lower postnatal growth rates ; .
Serum urea nitrogen can be used as an indicator of protein utilization efficiency . An increased serum urea nitrogen concentration indicates enhanced net catabolism of skeletal muscle protein ; and also reduced protein and feed utilization rates ; . In the present study, the serum urea nitrogen levels in IUGR piglets at 28 and 160 days of age were significantly increased, which indicated that the IUGR affected protein utilization efficiency. Insulin, a protein hormone secreted by islet β cells, simultaneously promotes glycogen, fat, and protein synthesis (White and Kahn et al., 1994). Intrauterine growth retardation can impair the pancreas development of the pig and significantly reduce its pancreatic weight ; , which reduces the β-cell proliferation and islet volume and damages the pancreatic endocrine function , thereby reducing the serum insulin levels ; Harada et al., 2003). The serum insulin levels of the IUGR piglets at 28 d and 66 d were significantly lower than the NBW pigs, which is consistent with these published results ; ; ; ; . Leptin is primarily produced by adipose tissue and can act on receptors in the hypothalamus to reduce neuropeptide Y secretion, suppress appetite, reduce energy intake, and reduce fat synthesis . It has been demonstrated that neonates with IUGR had significantly lower serum leptin values than the normal newborns . However, the serum leptin values increase in both normal and IUGR children during their first year of life and significantly decrease thereafter in the both groups. The serum leptin concentrations after 12 months are significantly higher in the IUGR group than the NBW group . In the present experiment, the serum leptin levels in IUGR piglets at 28 days of age were significantly higher than the NBW pigs. It was suggested that the IUGR piglets develop an adaptative leptin resistance beneficial for their catch-up growth .
Muscle fiber type composition can directly affect meat quality ; ; ; . The type I fibers are the slow twitch fibers which have a dependence on oxidative metabolism. These fibers tend to have low glycogen and high triglyceride content . In contrast, the type II fibers are the fast twitch fibers which have a dependence on glycolytic metabolism. These fibers tend to have high glycogen and low triglyceride content . The MyHC IIb fibers have the highest glycolytic metabolism capacity, therefore they have the highest glycogen contents . As a result, muscles that have a high proportion of these types of fibers tend to have an increased rates of postmortem pH decline, along with a lower ultimate pH, as well as decreased water holding capacity and a paler colour ; ; . Our results showed that the b*, L*, and C* values in longissimus dorsi muscle of the IUGR pigs were significantly higher than NBW pigs. The possible explanation is that IUGR resulted in an increased ratio of MyHC IIb to other isoforms. The pressure loss reflects the capacity of muscle to hold water. It was suggested that the longissimus dorsi muscle in IUGR pigs had a lower water-binding capacity than high birth weight pigs ; . Our results were consistent with previous studies ; . Water-holding capacity is the ability of muscle tissues to retain water, which is related to the glycolytic rate of muscle glycogen . As the ratio of MyHC IIb to other isoforms increases, the glycolysis rate increases, the pH drops, both actin and myosin contract and condense. Ultimately, large quantities of water leaks from muscle, which produces dry and dull meat with a decreased in palatability .
In the present study we found that the IUGR significantly increased the ratio of MyHC IIb to other isoforms in longissimus dorsi muscle of pigs. Gondret et al. (2006) studied the growing-finishing pigs (102 ± 0.6 kg) and concluded that the ratio of MyHC IIb to other isoforms in longissimus dorsi muscle in IUGR pigs (0.97 ± 0.04 kg) was higher than the high birth weight pigs (1.91 ± 0.03 kg) (85.6 vs. 82.8). Zhu et al. (2006) restricted the diet of ewes during early and mid-pregnancy and found that the ratio of MyHC IIb to other isoforms in longissimus dorsi muscle of 8-month-old offspring significantly increased by 17.6% compared with the control group, which is consistent with the present results. The increased ratio of MyHC IIb to other isoforms may be one reason for the poor quality of pork in IUGR pigs . During development of muscle fiber and conversion of muscle fiber types, a series of important genes form complex regulatory networks and signal transduction pathways. As a PPARγ coactivator, PGC-1α may convert skeletal muscle fibers . Handschin et al. (2007) revealed that the ratio of MyHC I and IIa to other isoforms significantly decreased in PGC-1α knockout mice, while the ratio of MyHC IIb to other isoforms significantly increased. However, the results of our present study found that the PGC-1α mRNA gene expression in longissimus dorsi muscle was not significantly different between IUGR and NBW pigs. The specific regulatory mechanism through which IUGR transforms MyHC I muscle fibers into MyHC IIb muscle fibers in longissimus dorsi muscle requires further investigation.
Conclusion
In summary, IUGR had adverse effects on the growth performance and meat quality of pigs, resulting in low postnatal growth rates, increased ratio of MyHC IIb to other isoforms, lower water-holding capacity and meat color of slaughtering pigs.
Acknowledgement
The work was supported by the National Natural Science Foundation of China (NSFC) (Grants 31572418 and 31272454), the National Basic Research Program of China (973) (Grant 2012CB124703), and the Personnel Training Foundation of the College of Animal Science and Technology at Nanjing Agricultural University.
Statement of conflict of interest
Authors have declared no conflict of interest.
Figures
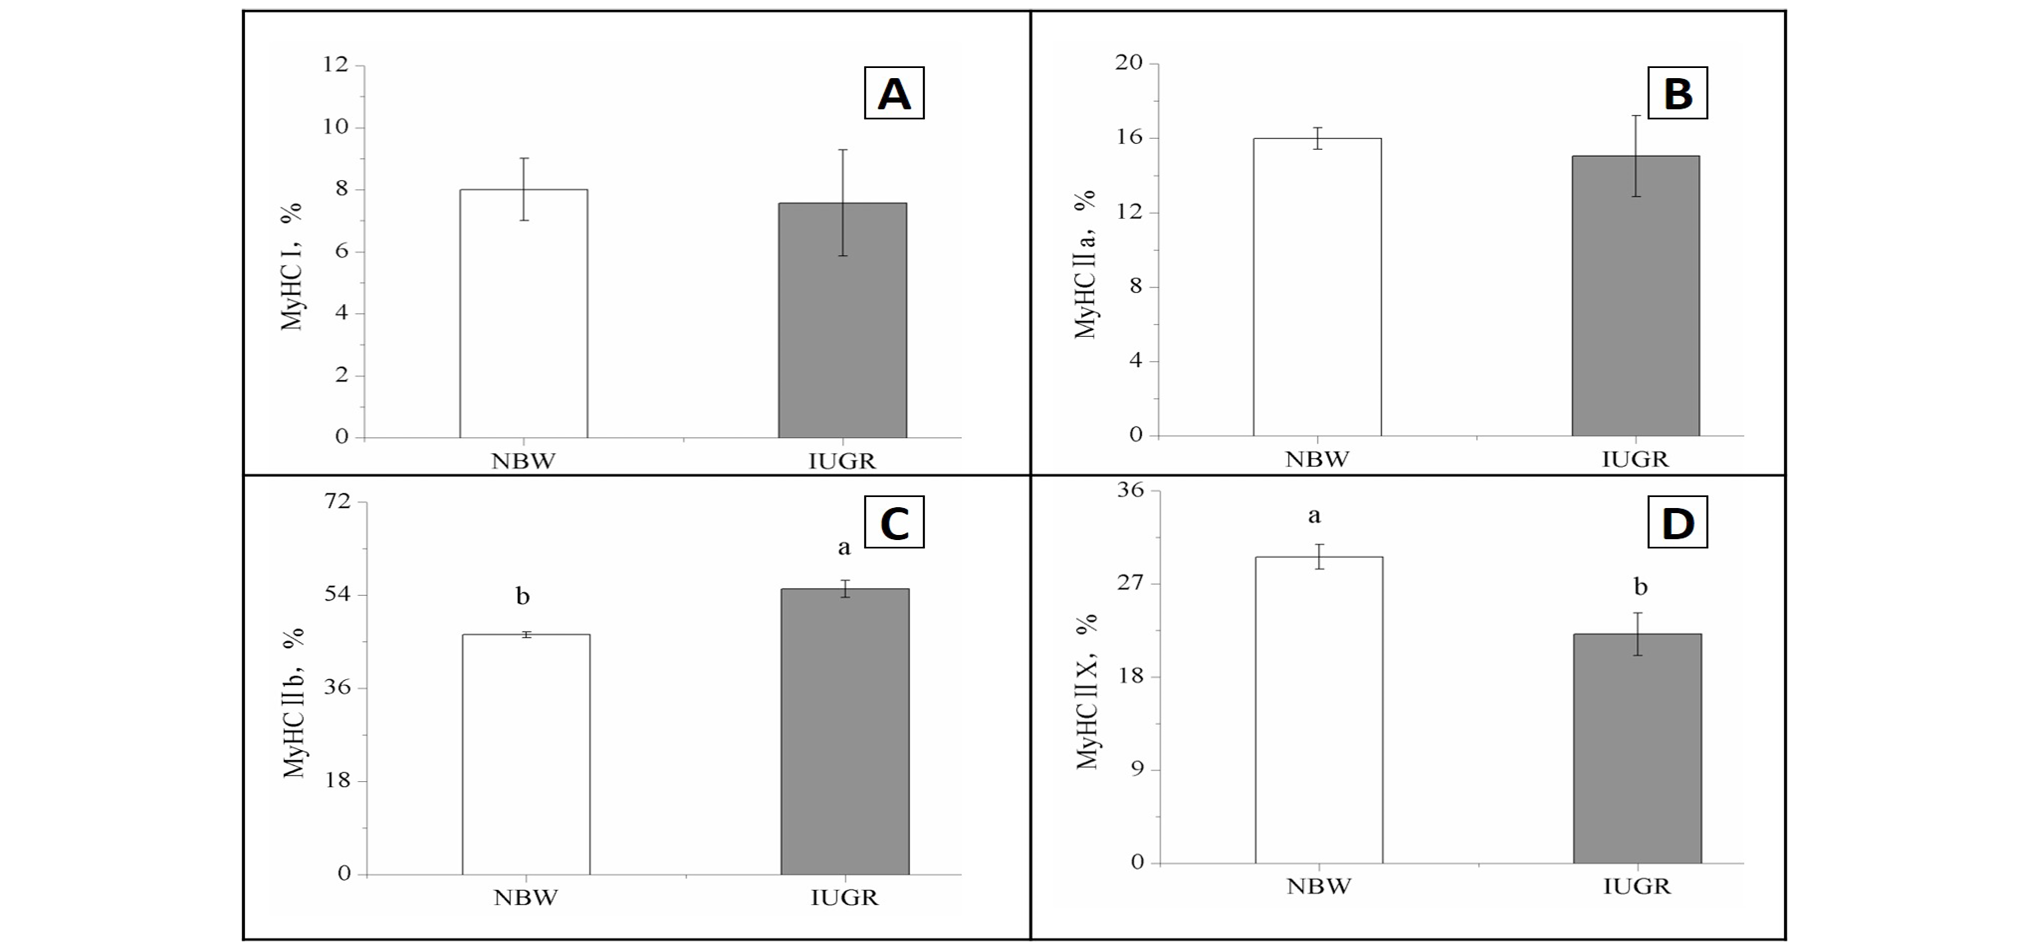
Muscle fiber type composition in the longissimus dorsi muscle of NBW and IUGR pigs at 160 days of age. NBW, normal birth weight; IUGR, intrauterine growth retardation; MyHC I, myosin heavy chain isoform I; MyHC IIa, myosin heavy chain isoform IIa; MyHC IIb, myosin heavy chain isoform IIb; MyHC IIx, myosin heavy chain isoform IIx. abDifferent letters show a significant difference between mean values (P<0.05).
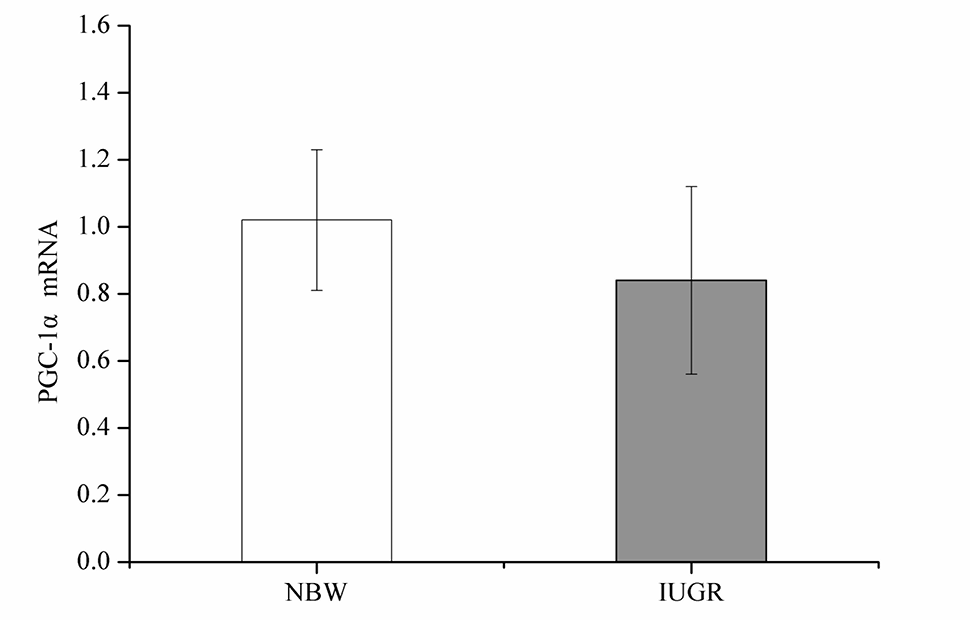
PGC-1α mRNA level in the Longissimus dorsi muscle of NBW and IUGR pigs at 160 days of age. NBW, normal birth weight; IUGR, intrauterine growth retardation; PGC-1α, peroxisome proliferator-activated receptor gamma coactivator 1-alpha; mRNA, messenger RNA.
References
- Ahima, R.S. and Osei, S.Y., 2004. Leptin signaling. Physiol. Behav., 81: 223-241. https://doi.org/10.1016/j.physbeh.2004.02.014[CrossRef]
- AOAC, 1990. Official methods of analysis, 16th ed. Association of Official Analytical Chemists, Washington, DC, USA.
- Bauer, R., Gedrange, T., Bauer, K. and Walter, B., 2006. Intrauterine growth restriction induces increased capillary density and accelerated type I fiber maturation in newborn pig skeletal muscles. J. Perinat. Med., 34: 235-242. https://doi.org/10.1515/JPM.2006.042[CrossRef]
- Beaulieu, A.D., Aalhus, J.L., Williams, N.H. and Patience, J.F., 2010. Impact of piglet birth weight, birth order, and litter size on subsequent growth performance, carcass quality, muscle composition, and eating quality of pork. J. Anim. Sci., 88: 2767-2778. https://doi.org/10.2527/jas.2009-2222[CrossRef]
- Choe, J.H., Choi, Y.M., Lee, S.H., Shin, H.G., Ryu, Y.C., Hong, K.C. and Kim, B.C., 2008. The relation between glycogen, lactate content and muscle fiber type composition, and their influence on postmortem glycolytic rate and pork quality. Meat Sci., 80: 355-362. https://doi.org/10.1016/j.meatsci.2007.12.019[CrossRef]
- De Boo, H.A. and Harding, J.E., 2007. Protein metabolism in preterm infants with particular reference to intrauterine growth restriction. Arch. Dis. Child-Fetal, 92: F315-319.
- Folch, J., Lees, M. and Sloane-Stanley, G., 1957. A simple method for the isolation and purification of total lipids from animal tissues. J. biol. Chem., 226: 497-509.
- Gondret, F., Lefaucheur, L., Louveau, I., Lebret, B., Pichodo, X. and Cozler, Y.L., 2005. Influence of piglet birth weight on postnatal growth performance, tissue lipogenic capacity and muscle histological traits at market weight. Livest. Prod. Sci., 93: 137-146. https://doi.org/10.1016/j.livprodsci.2004.09.009[CrossRef]
- Gondret, F., Lefaucheur, L., Juin, H., Louveau, I. and Lebret, B., 2006. Low birth weight is associated with enlarged muscle fiber area and impaired meat tenderness of the longissimus muscle in pigs. J. Anim. Sci., 84: 93-103. https://doi.org/10.2527/2006.84193x[CrossRef]
- Handschin, C., Chin, S., Li, P., Liu, F., Maratos-Flier, E., Lebrasseur, N.K., Yan, Z. and Spiegelman, B.M., 2007. Skeletal muscle fiber-type switching, exercise intolerance, and myopathy in PGC-1alpha muscle-specific knock-out animals. J. biol. Chem. 282: 30014-30021. https://doi.org/10.1074/jbc.M704817200[CrossRef]
- Harada, E., Shizuyama, M., Ihara, N. and Takeuchi, T., 2003. Impaired pancreatic endocrine and exocrine responses in growth-retarded piglets. J. Vet. Med. A, 50: 433-441. https://doi.org/10.1046/j.1439-0442.2003.00574.x[CrossRef]
- Huff-Lonergan, E., and Lonergan, S.M., 2005. Mechanisms of water-holding capacity of meat: The role of postmortem biochemical and structural changes. Meat Sci., 71: 194-204. https://doi.org/10.1016/j.meatsci.2005.04.022[CrossRef]
- Jaquet, D., Leger, J., Levy-Marchal, C., Oury, J.F. and Czernichow, P., 1998. Ontogeny of leptin in human fetuses and newborns: effect of intrauterine growth retardation on serum leptin concentrations. J. Clin. Endocr. Metab., 83: 1243-1246. https://doi.org/10.1210/jcem.83.4.4731[CrossRef]
- Jaquet, D., Leger, J., Tabone, M.D., Czernichow, P. and Levy-Marchal, C., 1999. High serum leptin concentrations during catch-up growth of children born with intrauterine growth retardation. J. Clin. Endocr. Metab., 84: 1949-1953. https://doi.org/10.1210/jc.84.6.1949[CrossRef]
- Joo, S.T., Kauffman, R.G., Kim, B.C. and Park, G.B., 1999. The relationship of sarcoplasmic and myofibrillar protein solubility to colour and water-holding capacity in porcine longissimus muscle. Meat Sci., 52: 291-297. https://doi.org/10.1016/S0309-1740(99)00005-4[CrossRef]
- Kim, G.D., Jeong, J.Y., Jung, E.Y., Yang, H.S., Lim, H.T. and Joo, S.T., 2013. The influence of fiber size distribution of type IIB on carcass traits and meat quality in pigs. Meat Sci., 94: 267-273. https://doi.org/10.1016/j.meatsci.2013.02.001[CrossRef]
- Kuang, L.D., Xie, X.H., Zhang, X.Y., Lei, M., Li, C.Y., Ren, Y.J., Zheng, J., Guo, Z.Q., Zhang, C.X., Yang, C. and Zheng, Y.C., 2014. Expression profiles of myostatin, myogenin, and myosin heavy chain in skeletal muscles of two rabbit breeds differing in growth rate. Anim. Biotechnol., 25: 223-233. https://doi.org/10.1080/10495398.2013.865639[CrossRef]
- Lefaucheur, L., Edom, F., Ecolan, P. and Butler-Browne, G.S., 1995. Pattern of muscle fiber type formation in the pig. Dev. Dynam., 203: 27-41. https://doi.org/10.1002/aja.1002030104[CrossRef]
- Lefaucheur, L., Milan, D., Ecolan, P. and Le Callennec, C., 2004. Myosin heavy chain composition of different skeletal muscles in large white and Meishan pigs. J. Anim. Sci., 82: 1931-1941. https://doi.org/10.2527/2004.8271931x[CrossRef]
- Li, B., Ahmad, H., Yang, X., Wang, J.J. and Wang, T., 2015. Effects of phytosterols on growth performance and fat metabolism in broilers. Pakistan J. Zool., 47: 111-118.
- Lowry, O.H., Rosebrough, N.J., Farr, A.L. and Randall, R.J., 1951. Protein measurement with the Folin phenol reagent. J. biol. Chem., 193: 265-275.
- Meek, K.I., Duncan, S.E., Marriott, N.G., Solomon, M.B., Kathman, S.J. and Marini, M.E., 2000. Quality and sensory characteristics of selected post-rigor, early deboned broiler breast meat tenderized using hydrodynamic shock waves. Poult. Sci., 79: 126-136. https://doi.org/10.1093/ps/79.1.126[CrossRef]
- National Research Council (NRC), 1998. Nutrient requirements of swine, 10th ed. National Academy Press, Washington DC, USA.
- Ogata, E.S., Swanson, S.L., Collins, J.W. and Finley, S.L., 1990. Intrauterine growth retardation: altered hepatic energy and redox states in the fetal rat. Pediat. Res., 27: 56-63. https://doi.org/10.1203/00006450-199001000-00017[CrossRef]
- Parr, T., Mareko, M.H.D., Ryan, K.J.P., Hemmings, K.M., Brown, D.M. and Brameld, J.M., 2016. The impact of growth promoters on muscle growth and the potential consequences for meat quality. Meat Sci., 120: 93-99. https://doi.org/10.1016/j.meatsci.2016.04.022[CrossRef]
- Quiniou, N., Dagorn, J. and Gaudré, D., 2002. Variation of piglets’ birth weight and consequences on subsequent performance. Livest. Prod. Sci., 78: 63-70. https://doi.org/10.1016/S0301-6226(02)00181-1[CrossRef]
- Rehfeldt, C. and Kuhn, G., 2006. Consequences of birth weight for postnatal growth performance and carcass quality in pigs as related to myogenesis. J. Anim. Sci., 84: 113-123. https://doi.org/10.2527/2006.8413_supplE113x[CrossRef]
- Rehfeldt, C., Tuchscherer, A., Hartung, M. and Kuhn, G., 2008. A second look at the influence of birth weight on carcass and meat quality in pigs. Meat Sci., 78: 170-175. https://doi.org/10.1016/j.meatsci.2007.05.029[CrossRef]
- Ryu, Y.C., and Kim, B.C., 2005. The relationship between muscle fiber characteristics, postmortem metabolic rate, and meat quality of pig longissimus dorsi muscle. Meat Sci., 71: 351-357. https://doi.org/10.1016/j.meatsci.2005.04.015[CrossRef]
- Ryu, Y.C., Choi, Y.M., Lee, S.H., Shin, H.G., Choe, J.H., Kim, J.M., Hong, K.C. and Kim, B.C., 2008. Comparing the histochemical characteristics and meat quality traits of different pig breeds. Meat Sci., 80: 363-369. https://doi.org/10.1016/j.meatsci.2007.12.020[CrossRef]
- Snoeck, A., Remacle, C., Reusens, B. and Hoet, J.J., 1990. Effect of a low protein diet during pregnancy on the fetal rat endocrine pancreas. Biol. Neonate, 57: 107-118. https://doi.org/10.1159/000243170[CrossRef]
- Uldry, M., Yang, W., St-Pierre, J., Lin, J., Seale, P. and Spiegelman, B.M., 2006. Complementary action of the PGC-1 coactivators in mitochondrial biogenesis and brown fat differentiation. Cell Metab., 3: 333-341. https://doi.org/10.1016/j.cmet.2006.04.002[CrossRef]
- Valsamakis, G., Kanaka-Gantenbein, C., Malamitsi-Puchner, A. and Mastorakos, G., 2006. Causes of intrauterine growth restriction and the postnatal development of the metabolic syndrome. Annls. N.Y. Acad. Sci., 1092: 138-147. https://doi.org/10.1196/annals.1365.012[CrossRef]
- Wang, T., Huo, Y.J., Shi, F.X., Xu, R.J. and Hutz, R.J., 2005. Effects of intrauterine growth retardation on development of the gastrointestinal tract in neonatal pigs. Biol. Neonate, 88: 66-72. https://doi.org/10.1159/000084645[CrossRef]
- Wang, Y., Zhang, L., Zhou, G., Liao, Z., Ahmad, H., Liu, W. and Wang, T., 2012. Dietary l-arginine supplementation improves the intestinal development through increasing mucosal Akt and mammalian target of rapamycin signals in intra-uterine growth retarded piglets. Br. J. Nutr., 5: 1-11. https://doi.org/10.3945/jn.111.148155[CrossRef]
- Whang, K.Y. and Easter, R.A., 2000. Blood urea nitrogen as an index of feed efficiency and lean growth potential in growing-finishing swine. Asian-Aust. J. Anim. Sci., 13: 811-816.
- Whang, K.Y., Kim, S.W., Donovan, S.M., McKeith, F.K. and Easter, R.A., 2003. Effects of protein deprivation on subsequent growth performance, gain of body components, and protein requirements in growing pigs. J. Anim. Sci., 81: 705-716. https://doi.org/10.2527/2003.813705x[CrossRef]
- White, M.F., and Kahn, C.R., 1994. The insulin signaling system. J. biol. Chem. 269, 1-4.
- Widdowson, E.M., 1971. Intra-uterine growth retardation in the pig. I. Organ size and cellular development at birth and after growth to maturity. Biol. Neonate, 19: 329-340. https://doi.org/10.1159/000240427[CrossRef]
- Wolter, B.F., Ellis, M., Corrigan, B.P. and de Decker, J.M., 2002. The effect of birth weight and feeding of supplemental milk replacer to piglets during lactation on preweaning and postweaning growth performance and carcass characteristics. J. Anim. Sci., 80: 301-308. https://doi.org/10.2527/2002.802301x[CrossRef]
- Wu, G., Bazer, F.W., Cudd, T.A., Meininger, C.J. and Spencer, T.E., 2004. Maternal nutrition and fetal development. J. Nutr., 134: 2169-2172.
- Wu, G., Bazer, F.W., Wallace, J.M. and Spencer. T.E., 2006. Board-invited review: intrauterine growth retardation: Implications for the animal sciences. J. Anim. Sci., 84: 2316-2337. https://doi.org/10.2527/jas.2006-156[CrossRef]
- Xu, R.J., Mellor, D.J., Birtles, M.J., Reynolds, G.W. and Simpson, H.V., 1994. Impact of intrauterine growth retardation on the gastrointestinal tract and the pancreas in newborn pigs. J. Pediat. Gastroenterol. Nutr., 18: 231-240. https://doi.org/10.1097/00005176-199402000-00018[CrossRef]
- Zhong, X., Wang, T., Zhang, X. and Li. W., 2010. Heat shock protein 70 is upregulated in the intestine of intrauterine growth retardation piglets. Cell Stress Chaperon, 15: 335-342. https://doi.org/10.1007/s12192-009-0148-3[CrossRef]
- Zhu, M.J., Ford, S.P., Means, W.J., Hess, B.W., Nathanielsz, P.W. and Du. M., 2006. Maternal nutrient restriction affects properties of skeletal muscle in offspring. J. Physiol. 575: 241-250. https://doi.org/10.1113/jphysiol.2006.112110[CrossRef]
Services
Article usage statistics
Loading…