
To observe the changes in the level of sclerosin in serum of patients after peritoneal dialysis (PD) and to analyze the underlying clinical factors, a total of 94 patients who were subjected to the peritoneal dialysis for over three months in the Nephrology Department of XXX Hospital between January 2019 and January 2020 were enrolled into the experiment group (n = 94). Simultaneously, 94 healthy subjects who received the physical examination were enrolled into the control group. Prior to the enrollment, all subjects had the plain abdominal radiograph, and, according to the abdominal aortic calcification score (AACS), PD patients were divided into the mild calcification group, moderate calcification group and severe calcification group. For all subjects, we detected the levels of relative biochemical indicators and performed the enzyme-linked immunosorbent assay to measure the levels of fibroblast growth factor-23 (FGF-23), 25(OH)D and sclerosin in the serum of patients. The levels of sclerosin and FGF-23 in the serum of patients in the experiment group were much higher than those in the control group, while the level of 25(OH)D was lower (P < 0.05). Aggravation of calcification came up with the increases in the levels of sclerosin, FGF-23, intact parathyroid hormone (iPTH), phosphorus, creatinine and uric acid, systolic blood pressure (SBP) and diastolic blood pressure (DBP) (P < 0.05), while the levels of 25(OH)D and calcium in serum and estimated glomerular filtration rate (eGFR) decreased (P < 0.05). Furthermore, the results of Pearson correlation analysis revealed that the level of sclerosin in serum was in positive correlation with age, serum phosphorus, iPTH, FGF-23, AACS, SPB and Creatinine (CREA) (P < 0.05), but in a negative correlation with the levels of 25(OH)D and calcium in serum and eGFR (P < 0.05). Results of logistic regression analysis revealed that AACS, eGFR, FGF-23, iPTH, serum phosphorus and 25(OH)D were the independent risk factors of sclerosin (P < 0.05). PD patients present with the significant elevation in the level of sclerosin in serum, which is clearly associated with the levels of AACS, eGFR, FGF-23, iPTH and serum levels of phosphorus and 25(OH)D.
Short Communication · Volume 54, Issue 6, 23 September 2022 · Open Access
Effect of Peritoneal Dialysis on Sclerosin Level in Serum of Patients with Variable Calcification
· ·
Affiliations & Notes ⌄
- 1Department of Nephrology, Traditional Chinese Medical Hospital of Huangdao District, QingDao, Shandong 266500, China 2Department of Encephalopathy, Traditional Chinese Medical Hospital of Huangdao District, QingDao, Shandong 266500, China 3Department of Pharmacy, Traditional Chinese Medical Hospital of Huangdao District, QingDao, Shandong 266500, China * Corresponding author: xyanzhang2021@gmail.com
Article Info ⌄
- Journal:
- Pakistan Journal of Zoology
- Published:
- 23 September 2022

From the article
- The results of Pearson correlation analysis revealed that the level of sclerosin in serum was in positive correlation with age, serum phosphorus, iPTH, FGF-23, AACS, SPB and CREA (P < 0.05), but in a negative correlation with the levels of 25(OH)D and calcium in serum and eGFR (P < 0.05; Fig. 2).
- In this study, we found that as compared to the control group, patients in the experiment group had higher levels of sclerosin and FGF-23 but lower level of 25(OH)D, and as the aortic calcification aggravated, the level of sclerosin in serum increased, coinciding with the findings of .
Selected from the article's own text.
Abstract
Materials and methods
A total of 94 patients who performed the peritoneal dialysis for over three months in the Nephrology Department of XXX Hospital between January 2019 and January 2020 were enrolled into the experiment group (n = 94). For all enrolled patients, diagnosis of calcification of aorta abdominalis was confirmed by the plain abdominal radiograph. Simultaneously, 94 healthy subjects who received the physical examination were enrolled into the control group. In the experiment group, there were 49 males and 45 females, aged between 34 and 72 years old with an average of 53.06±6.77 years. In the control group, there were 53 males and 41 females, aged between 39 and 68 years old with an average of 52.16±7.19 years.
Prior to the enrollment, all subjects had the plain abdominal radiograph, and, according to the AACS scores, PD patients were divided into the mild calcification group, moderate calcification group and severe calcification group. For all subjects, we detected the levels of relative biochemical indicators and performed the enzyme-linked immunosorbent assay to measure the levels of FGF-23, 25(OH)D and sclerosin in the serum of patients. All enrolled patients confirmed to the following exclusion criteria: 1) Patients who received the co-treatment of PD and hemodialysis; 2) Non-continuous ambulatory peritoneal dialysis (CAPD) patients; 3) Patients with malignant tumors, severe infection or diseases in liver; 4) Patients with acute heart failure or myocardial infarction; 5) Patients with mental diseases that could not cooperate with the treatment; 6) Patients with the connective tissue diseases. Comparison of the age and sex distribution between two groups showed no significant differences (P > 0.05), suggesting that the data were comparable. All enrolled subjects signed the written informed consents, and this study had been approved by the Medical Ethical Committee of XXX Hospital.
General data, including the age, sex, history and medication history, were obtained via asking the patients. Blood pressure was measured by using the mercurial sphygmomanometer, and the height and weight were also measured to calculate the body mass index (BMI). Besides, fasting elbow venous blood was drawn to detect the biochemical indicators by using an automatic biochemical detector, including the liver and kidney function, blood lipid and iPTH, while eGFR was calculated by using the MDRD formula.
All patients underwent the plain abdominal radiograph, and the results were interpreted by two blinded qualified radiologists. AACS was calculated according to the semi-quantification method published by Kauppila et al. (1997). AACS ranged from 0 to 24 points, where AACS was not higher than 4 points for mild or no calcification (n = 20), between 5 and 15 points for moderate calcification (n = 42) while not lower than 16 points for severe calcification (n = 32).
FGF-23, 25(OH)D and sclerosin levels in serum were detected by using the ELISA. In brief, patients were fasted for 8 h, and then 5 mL elbow venous blood was drawn and placed in an EDTA-contained tube for 30 min at room temperature, followed by centrifugation at 3000 r/min for 15 min at 4°C. Supernatant was stored at -80°C, and after sample collection, ELISA was performed to detect the concentration of FGF-23, 25 (OH)D and sclerosin in serum by using the corresponding kits (Gene, UK).
All data were analyzed using the SPSS 20.0 software. Measurement data were expressed in form of mean ± standard deviation (SD), where the difference was validated by using the t test or chi-square test, followed by the LSD-t test for pairwise comparison. Enumeration data were expressed in form of ratio (%), where the difference was validated by using the chi-square test. Correlation was validated using the Pearson correlation analysis, while the influencing factors for sclerosin were found by the multivariate Logistic regression model. P < 0.05 suggested that the difference had statistical significance.
Results
No significant difference was shown in comparison of the age, sex distribution and blood glucose level (P > 0.05). However, subjects in the experiment group had higher levels of SBP, DBP and levels of CREA, BUN, UA, iPTH, phosphorus, sclerosin and FGF-23 (P < 0.05), but lower levels of BMI, albumin (ALB), triglyceride (TG), total cholesterol (TC), low-density lipoprotein (LDL), potassium, calcium, eGFR and 25(OH)D, as compared to their counterparts in the control group (Table I).
Experiment group was further divided into three subgroups according to the AACS of patients, and the comparison of clinical indicators, including the levels of sclerosin, FGF-23, iPTH, phosphorus, CREA, 25(OH)D, calcium and uric acid (UA) in the serum, SBP, DBP and eGFR showed significant differences (P < 0.05; Fig. 1).
The results of Pearson correlation analysis revealed that the level of sclerosin in serum was in positive correlation with age, serum phosphorus, iPTH, FGF-23, AACS, SPB and CREA (P < 0.05), but in a negative correlation with the levels of 25(OH)D and calcium in serum and eGFR (P < 0.05; Fig. 2).
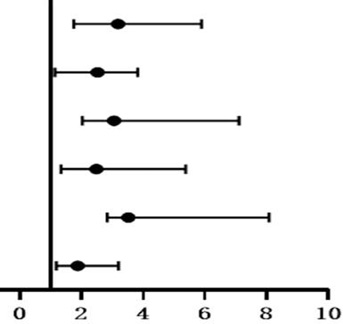
Multivariate logistic regression analysis was conducted with sclerosin level as dependent variable and age, serum phosphorus, iPTH, 25(OH)D, FGF-23, AACS, SBP, eGFR, serum calcium and CREA as independent variables, while the results revealed that AACS, eGFR, FGF-23, iPTH, serum phosphorus and 25(OH)D were the independent risk factors of sclerosin (P < 0.05; Table II).
Table I.- Effect of peritoneal on general clinical data between the two groups (n=94).
| Indices | Control group | Experimental group | t /χ2 value | P value |
| Age (years) | 52.16±7.19 | 53.06±6.77 | 2.310 | 0.340 |
| Male / female | 53/41 | 49/45 | 0.232 | 0.631 |
| BMI (kg/m2) | 23.55±1.38 | 21.10±1.10 | 0.863 | 0.013 |
| SBP (mmHg) | 119.75±7.18 | 148.18±14.27 | 6.551 | 0.000 |
| DBP (mmHg) | 72.12±5.42 | 96.29±10.17 | 3.250 | 0.002 |
| ALB (g/L) | 48.28±2.05 | 32.19±6.40 | -1.222 | 0.000 |
| TG (mmol/L) | 1.90±0.58 | 1.26±0.30 | 0.773 | 0.006 |
| TC (mmol/L) | 4.53±1.38 | 3.76±1.75 | 2.361 | 0.014 |
| LDL (mmol/L) | 2.90±0.60 | 1.89±0.62 | -0.553 | 0.001 |
| CREA (μmol/L) | 70.34±8.15 | 924.20±87.33 | 9.333 | 0.000 |
| BUN (mmol/L) | 5.85±1.15 | 24.53±7.76 | 6.330 | 0.000 |
| UA (μmol/L) | 356.30±74.59 | 441.21±81.33 | 2.004 | 0.003 |
| iPTH (ng/ml) | 44.12±6.19 | 224.40±92.44 | 3.117 | 0.000 |
| Blood potassium (mmol/L) | 4.52±0.49 | 3.45±0.82 | 0.228 | 0.008 |
| Blood calcium (mmol/L) | 2.38±0.09 | 2.15±0.35 | 1.222 | 0.002 |
| Blood phosphorus (mmol/L) | 1.22±0.19 | 2.27±0.95 | 0.881 | 0.000 |
| Blood sugar (mmol/L) | 4.92±0.49 | 5.10±0.72 | 0.993 | 0.305 |
| eGFR/[ml/ (min·1.73m2)] | 98.50±7.47 | 2.15±0.58 | 5.226 | 0.000 |
| 25(OH)D (ng/L) | 61.39±7.22 | 12.32±6.20 | 4.227 | 0.000 |
| Osteosclerotin (pg/ml) | 68.34±8.18 | 327.66±58.15 | 6.553 | 0.000 |
| FGF-23 (pg/ml) | 40.19±2.45 | 224.09±18.72 | -6.225 | 0.000 |
Discussion
Sclerosin, a SOST-encoded and osteocyte-secreted glycoprotein, is a blocker for WNT/β-catenin signal pathway that is involved in the regulation of bone-vessel axis and plays a key role in the vascular calcification. The latest evidence has shown that sclerosin is found in the plaque of patients with arteriosclerosis that may be involved in the pathogenesis of atherosclerosis and vascular calcification ; . Tremendous evidence also suggests that the level of sclerosin in serum is associated with the vascular calcification in uremia patients ; . Nevertheless, it is still controversial for the relationship between sclerosin and vascular calcification, while the mechanism of sclerosin in the vascular calcification remains unclear. Current evidence holds that patient with a higher level of sclerosin in the circulation system may have a lower risk of vascular calcification, suggesting that sclerosin in the circulation system may be a protective role for vascular calcification ; . Lee et al. (2016) found that the level of sclerosin in serum was in a negative correlation with the severity of calcification of aortic valve, and the Cox regression analysis also demonstrated that sclerosin level was correlated with the vascular calcification negatively and was a determining factor for vascular calcification, which further indicates that sclerosin may be protective factor that antagonizes the vascular calcification. Register et al. ( 2014) found that patients with calcification of aortic valve have a higher level of sclerosin in serum as compared to the healthy subjects, suggesting that sclerosin is a protective role for the vascular calcification.
In this study, we found that as compared to the control group, patients in the experiment group had higher levels of sclerosin and FGF-23 but lower level of 25(OH)D, and as the aortic calcification aggravated, the level of sclerosin in serum increased, coinciding with the findings of
Table II.- Independent variables.
| Independent variables | b | Sb | Wald χ2 | OR (95%CI) | P | |
| AACS | 0.447 | 0.226 | 3.228 | 3.19 (1.76, 5.89) | 0.000 | |
| eGFR | 0.369 | 0.119 | 2.137 | 2.52 (1.14, 3.82) | 0.012 | |
| FGF-23 | 0.842 | 0.554 | 4.008 | 3.06 (2.03, 7.11) | 0.004 | |
| iPTH | 0.771 | 0.424 | 3.226 | 2.49 (1.33, 5.38) | 0.000 | |
| Serum phosphorus | 0.428 | 0.311 | 4.119 | 3.52 (2.84, 8.09) | 0.000 | |
| 25(OH)D | 0.543 | 0.209 | 1.887 | 1.88 (1.19, 3.21) | 0.031 |
Shen et al. (2017) and Register et al. (2014) suggesting that sclerosin is a protective factor for vascular calcification. Thus, monitoring the level of sclerosin in PD patients may reflect the vascular calcification indirectly.
In summary, PD patients have a higher level of sclerosin as compared to the healthy subjects, and such a change is in a positive correlation with the severity of AACS, suggesting that sclerosin may be a risk factor for the calcification of aorta abdominalis in PD patients and is expected to be a predictive factor. As for the mechanism of sclerosin in the vascular calcification in PD patients, we hope to conduct more multicenter, large-sample studies.
Statement of conflict of interest
The authors have declared no conflict of interests.
Figures
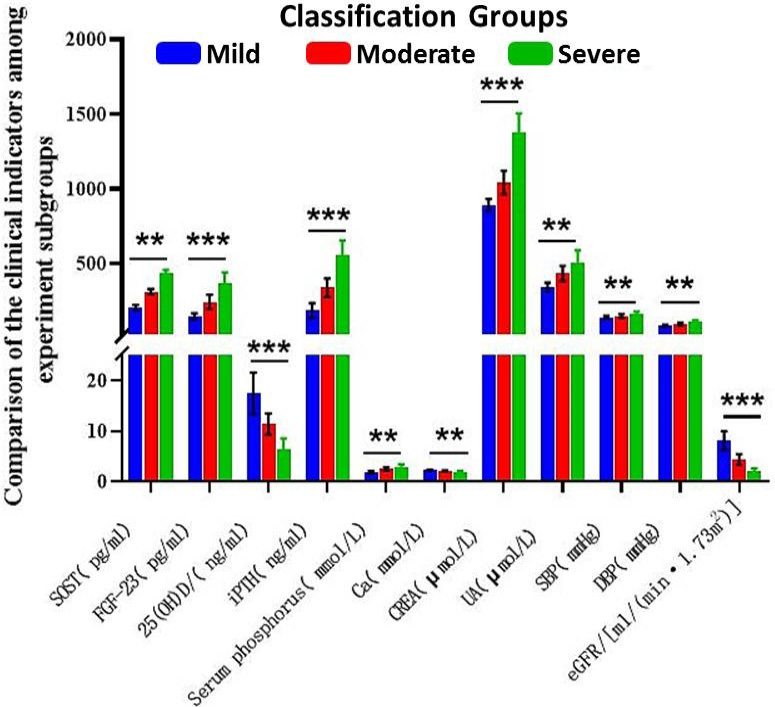
Comparison of the clinical indicators among experiment subgroups.
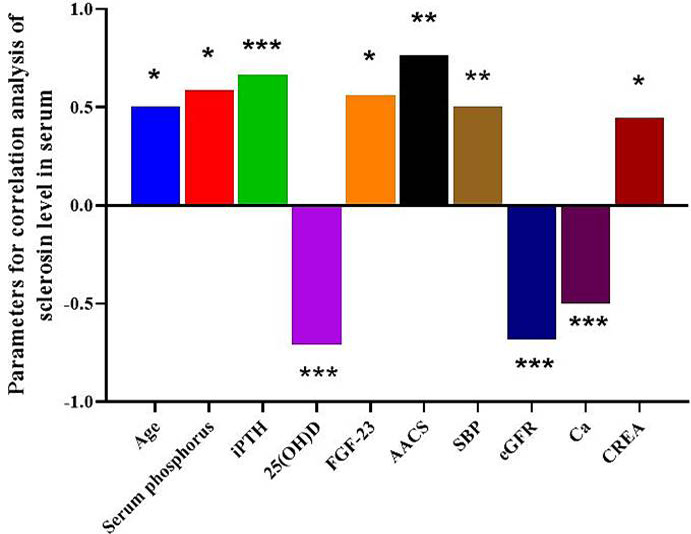
Parameters for correlation analysis of sclerosin level in serum.
References
- Brandenburg, V.M., Kramann, R., Koos, R., Krüger, T., Schurgers, L., Mühlenbruch, G., Hübner, S., Gladziwa, U., Drechsler, Ch. and Ketteler, M., 2013. BMC Nephrol., 14: 1–10. https://doi.org/10.1186/1471-2369-14-219[CrossRef]
- Claes, K.J., Viaene, L., Heye, S., Meijers, B., d’Haese, P. and Evenepoel, P., 2013. J. Clin. Endocrinol. Metab., 98: 3221–3228. https://doi.org/10.1210/jc.2013-1521[CrossRef]
- Drechsler, C., Evenepoel, P., Vervloet, M.G., Wanner, C., Ketteler, M., Marx, N., Floege J., Dekker F.W., Brandenburg, V.M. and Group, N.S., 2015. Nephrol. Dial. Transplant., 30: 288–293. https://doi.org/10.1093/ndt/gfu301[CrossRef]
- Kauppila, L.I., Polak, J.F., Cupples, L.A., Hannan, M.T., Kiel, D.P. and Wilson, P.W.F., 1997. Atherosclerosis, 132: 245–250.
- Kirkpantur, A., Balci, M., Turkvatan, A. and Afsar, B., 2016. Nefrología (English Edition), 36: 24–32. https://doi.org/10.1016/j.nefroe.2016.01.005[CrossRef]
- Koos, R., Brandenburg, V., Mahnken, A.H., Schneider, R., Dohmen, G., Autschbach, R., Matx N. and Kramann, R., 2013. J. Heart Value Dis., 22: 317–325.
- Lee, Y.T., Ng, H.Y., Chiu, T.T.Y., Li, L.C., Pei, S.N., Kuo, W.H. and Lee, C.T., 2016. Clin. Chim. Acta., 452: 38–43. https://doi.org/10.1016/j.cca.2015.10.031[CrossRef]
- Li, H., Yang, J. and Wang, Z., 2017. Chin. Med. Clin., 17: 79–81. https://doi.org/10.1097/SAP.0000000000000992[CrossRef]
- Ni, Z. and Jin, H., 2019. China Blood Purif., 18: 661–663.
- Omata, M., Fukagawa, M. and Kakuta, T., 2015. Clin. Calcium, 25: 645–653.
- Paloian, N.J. and Giachelli, C.M., 2014. Am. J. Physiol. Renal Physiol., 307: F891–F900. https://doi.org/10.1152/ajprenal.00163.2014[CrossRef]
- Pelletier, S., Confavreux, C.B., Haesebaert, J., Guebre-Egziabher, F., Bacchetta, J., Carlier, M.C., Chardon L., Laville M., Chapurlat R., London, G.M., Lafage-Proust, M.H. and Fouque, D., 2015. Osteoporos. Int., 26: 2165–2174. https://doi.org/10.1007/s00198-015-3127-9[CrossRef]
- Register, T.C., Hruska, K.A., Divers, J., Bowden, D.W., Palmer, N.D., Carr, J.J., Wagenknecht, L.E., Hightower, R.C., Xu, J., Smith, S.C., Dietzen, D.J., Langefeld, C.D. and Freedman, B.I., 2014. J. clin. Endocrinol. Metab., 99: 315–321.
- Shen, L., Gao, Z. and Wang, L., 2017. Rat. Use Drug, 10: 3–4.
- Sun, Z. and Yu, X., 2019. Chin. J. Med., 99: 3033–3037.
Services
Article usage statistics
Loading…