
This study aims to investigate the relationship between EphA2 level and PRMT1 expression in non-small cell lung cancer patients (NSCLCP). This a retrospective observational study totally includes 40 participants, and these participants are divided into following two groups: control group (health participants), experimental group (NSCLCP), and then all these participants receive standardized bronchoalveolar lavage. Participants’ general data are collected and analyzed. EphA2 expression and PRMT1 expression in blood samples are determined by ELISA, and EphA2 protein and PRMT1 protein in bronchoalveolar lavage fluid (BALF) samples are determined by western blotting, and then EphA2 mRNA and PRMT1 mRNA in BALF samples are determined by RT-PCR. The EphA2 expression and PRMT1 expression in experimental group were found clearly higher than those in the control. It appears up-regulation of EphA2 and PRMT1 expression can promote the development of NSCLC.
Short Communication · Volume 56, Issue 3, 11 May 2024 · Open Access
Clinical Implications of Expression of EphA2 and PRMT1 in Non-Small Cell Lung Cancer Patients
· · · ·
Affiliations & Notes ⌄
- 1General Thoracic Surgery, General Hospital of Ningxia Medical University, No. 804 Shengli Street, Xingqing District, Yinchuan, Ningxia Hui Autonomous Region, 750003, China. * Corresponding author: hwei_8688@126.com
Article Info ⌄
- Journal:
- Pakistan Journal of Zoology
- Published:
- 11 May 2024

Abstract
Materials and methods
We conduct this retrospective observational study which totally enrolls 20 NSCLCP from our hospital during December 2021 to January 2023, and all these patients were set as experimental group. Twenty health participants during the same period were also included in this retrospective observation study and are set as control group. All patient used for this retrospective observation study were treated and were performed with standardized bronchoalveolar lavage.
Inclusion criteria for all NSCLCP who signed an informed consent form for fiberoptic bronchoscopy examination; were diagnosed according to the histological classification of lung, pleura, thymus, and heart tumors issued by the Avasarala et al. (2015), including lung biopsy, tissue biopsy, and postoperative pathological confirmation of lung cancer, with pathological types of lung adenocarcinoma or squamous cell carcinoma, large cell lung cancer; no history of lung cancer surgery.
Exclusion criteria for all NSCLCP who were not diagnosed by histopathology evidence have been diagnosed with NSCLC but accompany with other diseases; have a history of radiation, chemotherapy, and biological targeted therapy; incomplete clinical data and have not signed the informed consent form.
Inclusion criteria for health participants were those not diagnosed as NSCLC and agreed to receive standardized bronchoalveolar lavage; had no surgical history and had signed the informed consent form, those who had no complete clinical data and did not sign the informed consent.
After patients were admitted to hospital, routine tests were conducted followed by a bronchoscopy, and clinical bronchoalveolar lavage fluid (BALF) samples are collected for further experiment analyses.
ELISA was used to measure the EphA2 and PRMT1 levels in blood samples from NSCLCP and health participants. The blood samples were grinded and lysed using cell lysate, which was centrifuged at 4°C, 10,000 rpm for 10 min, and the supernatant was collected for protein quantification and ELISA using the ELISA kit (WuHan AmyJet Scientific Inc., China).
For detection of BALF samples by RT-PCR Trizol reagent was incubated with BALF samples, and the centrifuged at 12000 RPM for 15 min at 4°C. Chloroform (200 μL) was added to precipitate total RNA. Equal volume of isopropanol was added, and the mixture was centrifuged at 12000 RPM for 15 min at 4°C. Supernatant was discarded 1 mL of 75% absolute ethanol was used to rinse the precipitate. The samples were centrifuged at 4°C, 12000 RPM for 5 min. Twenty μL DEPC water was used to dissolve the RNA. qPCR system was utilized to conduct RT-PCR reaction of RNA according to the company’s recommendations using the following primers.
| EphA2 | F 5’ CCAAGTTCGCTGACATCGT 3’ |
| R 5’ GCCATGAAGTGC TCCGTAT 3’ | |
| PRMT1 | F 5’ AGCGAGTGGATGGGTTATTG 3’ |
| R 5’ ATACAGGGTGGCTCGGTCT 3’ |
Western blotting was also used for detection of BALF samples. The BALF samples were lysed using 150-250 μl/ 20 mg RIPA buffer containing 1% phosphotransferase inhibitor and 1% proteinase inhibitor, and then the mixture was centrifuged at 12,000g at 4°C for 15 min. Total proteins was collected and stored at -80°C. Proteins were quantified using BCA protein assay kit. Then 180μl BCA working solution was added to each well. The purification of proteins was performed using gel electrophoresis to transfer the protein on polyvinylidene difluoride (PVDF) membrane. The PVDF membrane was then incubated overnight with the primary antibody at 4 °C and then for two hours with secondary antibodies (1:1000) at room temperature, followed by washing three times/5 min each. Finally, the blots are observed in the imaging system using enhanced chemiluminescence.
SPSS 20.0 statistical software was used for statistical analysis. The descriptive data were presented by n (%), and measurement data are expressed by mean ± standard deviation (x±s). Chi-square test is performed for evaluation of descriptive data and t test is used to compare the difference of measurements data between two groups. P<0.05 show the difference is significant.
Results
Clinical medical data for NSCLCP (experimental group) and health participants (control group) are presented in Table I.
Table I. Demographic data of participants.
| Variable | Experimental group | Control group |
| Number of participants | 20 | 20 |
| Gender, male (%) | 8 (40%) | 10(50%) |
| Age (year) | 54.4±7.8 | 55.5±6.3 |
| TNM staging | ||
| Ⅰ | 11(55%)* | 0(0%) |
| Ⅱ | 5(25%)* | 0(0%) |
| Ⅲ, Ⅳ | 4(20%)* | 0(0%) |
A Chi-square test is performed for evaluation of descriptive data and measurement data was compared using t test. *, compared to measurement data in control group, P<0.05.
Figure 1 shows the comparison of EphA2 level and PRMT1 levels between experimental group and control group as detemined by ELISA, EphA2 value in control group is 34.6±8.6 ng/L and the EphA2 value in experimental group is 45.4±9.2 ng/L, and the PRMT1 value in control group is 6.5 ±2.6 ng/L and the PRMT1 value in experimental group is 15.1±5.3 ng/L. The EphA2 and PRMT1 values of experimental group compared to control group are significantly increased and the difference is statistically significant (P<0.05).
EphA2 and PRMT1 protein level are determined by western blotting and presented in Figure 1C, D. Those outcomes by western blotting suggested that the experimental group had high expression of EphA2 protein and PRMT1 protein compared to control group.
Figure 1E, F show the EphA2 and PRMT1 mRNA level are determined by RT-PCR, suggest that the experimental group showed high expression of EphA2 mRNA and PRMT1 mRNA compared to the control group.
Our results show that number of patients with I, II, III, IV staging in experimental groups is significantly higher than those in control group. Compared to control EphA2 and PRMT1 protein levels in blood samples and in experimental group is clearly increased. In addition, EphA2 and PRMT1 mRNA relative level as determined by RT-PCR are up-regulated in experimental groups. All these outcomes suggest that EphA2 and PRMT1 have associated with the development of NSCLC by controlling the cell physiological functions.
EphA2, as receptor tyrosine kinase, play an important role in patients with cancer by controlling cell biological processes. but studies relating to EphA2 in NSCLC remain short. A trial by Lee et al. (2017) point out that EphA2 is a new biomarker which is expressed in NSCLC rat model, and down-regulation of EphA2 can attenuate NSCLC development. These results in this study show that EphA2 is a biomarker in the diagnosis of NSCLC. However, the clinical information described in this study remain limited. To further clarify the relationship between EphA2 and NSCLC, a vitro study by Gong et al. (2022) investigate the role of EphA2 in radiosensitivity of all NSCLC, and these results in this vitro study suggest that EphA2 down-regulation can enhance radiosensitivity of NSCLC, we can see that EphA2 can be considered as a diagnostic biomarker for NSCLC. The relationship between EphA2 expression and NSCLC is investigated in our study, these results in present trial suggest that over-expression EphA2 can promote the development of NSCLC. Our findings have been reported in related fields and it provides a probable method of diagnosis for early NSCLC.
PRMT1, also participates in development process of multiple cancers. Some studies have also reported the relationship between PRMT1 expression and NSCLC cells. In vitro trial by Avasarala et al. (2015), who report that PRMT1 is a new biomarker in NSCLC, and over-expression of PRMT1 can calculate NSCLC progression and metastasis by controlling epithelial-mesenchymal transition. However, the clinical relationship between PRMT1 expression and NSCLC remains unclear. Therefore, we also conduct a clinical study to compare relationship between PRMT1 expression and NSCLC, and our results show that up-regulated of PRMT1 can promote the development of NSCLC. Our results are consistent with those reported by Avasarala et al. (2015). These results in present trial provide research data of diagnosis for NSCLC. However, there are some limitations in our study. The small sample is main limitation and it is difficult to draw definitive conclusions from present study. Therefore, further big sample study is needed to conduct in next study.
Conclusion
The up-regulated EphA2 and PRMT1 expression can promote the development of NSCLC.
Funding
None.
Ethics approval and consent to participate
The ethic approval was reviewed and approved by the Ethic Committee of The General Hospital of Ningxia Medical University and written informed consent was obtained from all patients with diabetes.
Availability of data and materials
The data are free access to available upon request.
Statement of conflict of interest
The authors have declared no conflict of interest.
Figures
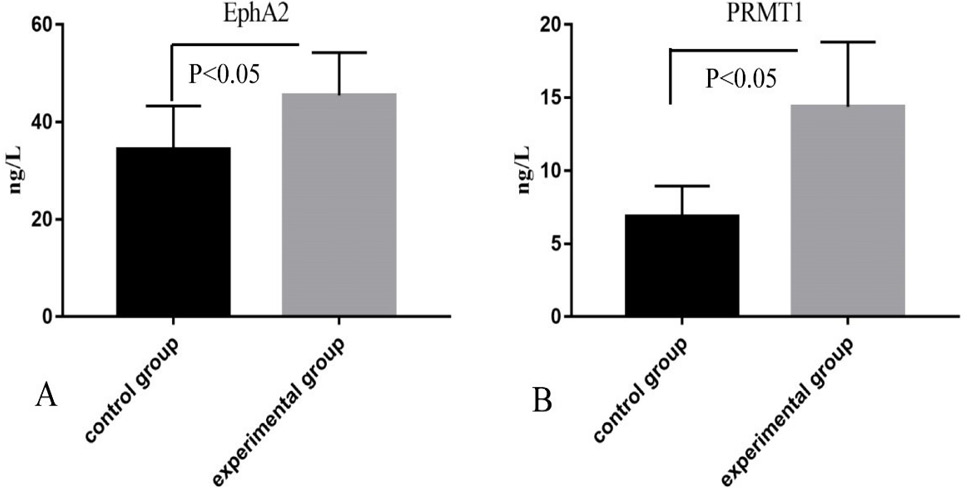
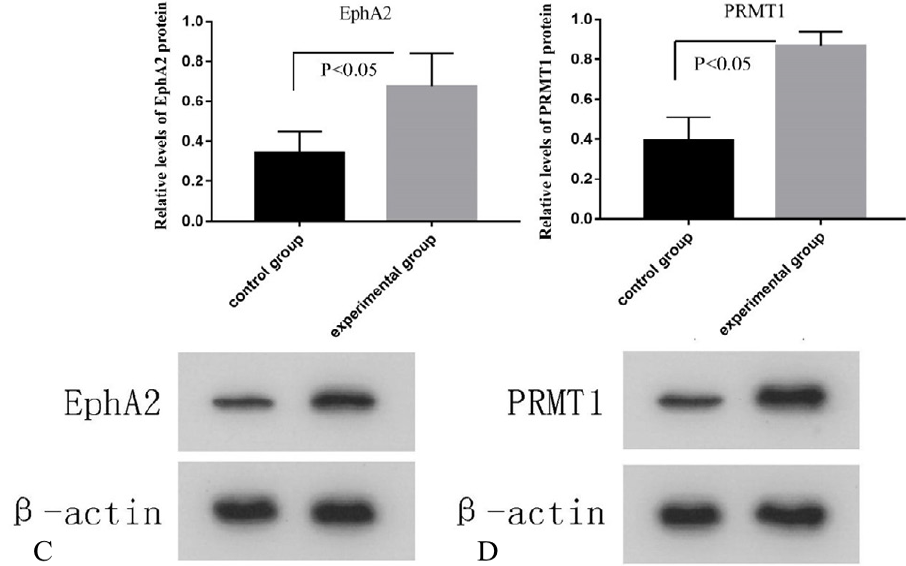
The relative levels of EphA2 and PRMT1 of blood samples (A, B) and BALF samples (C, D, E, F, G) of control and experimental group as determined by ELISA (A, B), Western blotting (C, D) and RT-PCR (F, F). The values are presented as means ± standard deviation. The data of two groups were compared using t test. *P<0.05 represented statistically significant.
References
- Alexander, M., Kim, S.Y. and Cheng, H., 2020. Lung, 198: 897-907. https://doi.org/10.1007/s00408-020-00407-5[CrossRef]
- Avasarala, S., Van Scoyk, M., Karuppusamy R.M.K., Zerayesus, S., Zhao, X., Zhang, W., Pergande, M.R., Borgia, J.A., DeGregori, J., Port, J.D., Winn, R.A. and Bikkavilli, R.K., 2015. J. biol. Chem., 290: 13479-13489. https://doi.org/10.1074/jbc.M114.636050[CrossRef]
- Brannan, J.M., Sen, B., Saigal, B., Prudkin, L., Behrens, C., Solis, L., Dong, W., Bekele, B.N., Wistuba, I. and Johnson, F.M., 2009. Cancer Prev. Res., 2: 1039-1049.
- Broderick, S.R., 2020. Thorac. Surg. Clin., 30: 215-220. https://doi.org/10.1016/j.thorsurg.2020.01.001[CrossRef]
- Gao, Y., Zhao, Y., Zhang, J., Lu, Y., Liu, X., Geng, P., Huang, B., Zhang, Y. and Lu, J., 2016. Sci. Rep., 6: 19874. https://doi.org/10.1038/srep19874[CrossRef]
- Goebel, C., Louden, C.L., McKenna, R., Jr., Onugha, O., Wachtel, A. and Long, T., 2019. Cancer Genom. Proteom., 16: 229-244. https://doi.org/10.21873/cgp.20128[CrossRef]
- Gong, S., Li, Y., Lv, L. and Men, W., 2022. Gene Ther., 29: 588-600. https://doi.org/10.1038/s41434-020-00213-x[CrossRef]
- He, T., Cao, J., Xu, J., Lv, W. and Hu, J., 2020. Zhongguo Fei Ai Za Zhi, 23: 479-486.
- Jonna, S. and Subramaniam, D.S., 2019. Discov. Med., 27: 167-170.
- Lee, H.Y., Mohammed, K.A., Kaye, F., Moudgil, B.M. and Nasreen, N., 2017. Am. J. Transl. Res., 9: 3293-3303.
- Li, Z., Wang, D., Chen, X., Wang, W., Wang, P., Hou, P., Li, M., Chu, S., Qiao, S., Zheng, J. and Bai, J., 2021. Cell Death Dis., 12: 1080. https://doi.org/10.1038/s41419-021-04381-5[CrossRef]
- Psilopatis, I., Karniadakis, I., Danos, K.S., Vrettou, K., Michaelidou, K., Mavridis, K., Agelaki, S. and Theocharis, S., 2022. Int. J. mol. Sci., 24. https://doi.org/10.3390/ijms24010093[CrossRef]
- Sankar, K., Gadgeel, S.M. and Qin, A., 2020. Expert. Rev. Anticancer Ther., 20: 647-661. https://doi.org/10.1080/14737140.2020.1787156[CrossRef]
- Schabath, M.B. and Cote, M.L., 2019. Cancer Epidemiol. Biomark. Prev., 28: 1563-1579. https://doi.org/10.1158/1055-9965.EPI-19-0221[CrossRef]
- Song, C., Chen, T., He, L., Ma, N., Li, J.A., Rong, Y.F., Fang, Y., Liu, M., Xie, D. and Lou, W., 2020. Cell Oncol. (Dordr), 43: 51-62. https://doi.org/10.1007/s13402-019-00435-1[CrossRef]
- Xiao, T., Xiao, Y., Wang, W., Tang, Y.Y., Xiao, Z. and Su, M., 2020. J. Hematol. Oncol., 13: 114. https://doi.org/10.1186/s13045-020-00944-9[CrossRef]
- Yu, L., Chen, D. and Song, J., 2020. Thorac. Cancer, 11: 603-611. https://doi.org/10.1111/1759-7714.13304[CrossRef]
Services
Article usage statistics
Loading…