All of these findings reveal that Swiss mice demonstrated more stressful behavior than Balb/c mice in response to MAS.
SMAS mice showed higher serum levels of corticosterone than BMAS mice, and both SMAS and BMAS mice showed higher corticosterone levels than SC and BC mice.
MAS exposure to different mice strains as Swiss and Balb/c resulted in elevated levels of behavior and biochemical parameters in Swiss mice compared with Balb/c mice, concerning strain difference in all parameters in both strains.
From the aforementioned results, we could conclude that Swiss albino mice are more adequate for use in stress research because of their high responsivity to MAS.
Selected from the article's own text.
Abstract
Stress is involved in several neurological disorders of human beings. Mice are frequently used in biomedical research, including stress research. However, mice respond differently to stress. Therefore, we conducted this study to screen the behavioral and biochemical responsiveness of two different strains of mice, Balb/c (B) and Swiss (S). A total of fourteen adult males, each of (S) and (B) mice, were housed in either the control group or the multiple concurrent acute stress (MAS) group that was exposed to different physical and emotional stressors for 3-hours. Serum corticosterone level, brain levels of interleukin-6 (IL-6), tumor necrosis factor-alpha (TNF-α), malondialdehyde (MDA), and glutathione (GSH) were measured. Mice were subjected to open field, plus maze, and dark light activity box tests. Swiss Multiple Acute concurrent Stress (SMAS) showed more responsiveness to MAS than Balb/c Multiple Acute concurrent Stress (BMAS) in most biochemical and behavioral parameters, with an elevated level of corticosterone and MDA IL-6, and TNF-α and reduced levels of GSH. In conclusion, SMAS showed a more effective response to MAS than BMAS, making them a selection model in stress research.
Several studies on stress have made fundamental progress contributions in recent years on animals and humans ; ; . Stress is defined as a single stereotypic response that evolved by any demand upon the body . All acute stressful events induce several negative long-term effects, such as post-traumatic stress disorder (PTSD) in many individuals . Different preclinical studies have reported that social stress-induced in rodent models outputs several behavioral and physiological effects that differ from those induced by nonsocial stress ; .
Rodent models are highly appropriate for investigating the outcomes of disruption patterns such as stress on behavior and physiology . However, Swiss and Balb/c are considered animals of choice in several biomedical studies related to stress disorders . Multiple concurrent acute stress (MAS) is one of the recognized stresses that can provide a more optimal model for the concurrent acute life stresses that provoke negative long-term results . In MAS, mild to moderate stressors such as bright light, restraint, loud noise, and shaking are delivered to the animal simultaneously.
Previous research has documented that Balb/c mice are more sensitive to chronic stress than Swiss albino mice . To the best of the author’s knowledge, no research was conducted to screen the responsivity of Swiss and Balb/c mice in response to MAS, so we aimed in this study to screen the behavioral and biochemical responsivity of Swiss and Balb/c mice to MAS.
MATERIALS AND METHODS
Animals Housing And Management
A total of 14 Swiss male albino mice and 14 male Balb/c mice weighing 25-30 grams before starting the experiment were measured using an analytical balance (SHIMADZU, model TXB2201L, the Philippines) purchased from Theodor Bilharz -Institute (Cairo, Egypt) were used in this study. The animals were housed in four shoebox-type plastic cages, and each cage was covered with galvanized wire lids. The minimum floor area for each animal was 65 cm2, and a constant temperature of 22±2°C was maintained using an automatic system of air conditions, with a relative humidity of 40% -70%. The ventilation rates was10 -15 air changes per hour, and a lighting cycle of 12- h light and 12- h dark was adjusted inside the laboratory animal house during the study period. The mice were fed on a commercial balanced pellet diet (Meladco Company, Obour city, Egypt), with free access to high-quality purified filtered water inside the cage. Individual identification was performed by a color-marking technique using a permanent marker to write numbers on the tail to differentiate the animals during observations. Cleaning procedures were applied by changing the bedding twice per week, washing the cages with soap and water, applying acetic acid to remove debris and odor, and then rewashing.
The animal facility was provided with an electric fly trapper. The disinfection program was applied through a three-step process. The first step is the mechanical removal of organic material from cages, floors, and surfaces (urine, blood, feces, hair, etc.). Then, all surfaces were thoroughly cleaned with soap and water, rinsed, and then dried well. Next, the disinfectant was applied and allowed to settle for a contact time of 3-10 min. Finally, the disinfectant was removed with a damp cloth, and then the area was dried well. The facility has only a good drainage system through top mesh gutters to facilitate the drainage cycle. All procedures were approved by the Institutional Animal Care and Use Committee of the Faculty of Veterinary Medicine Cairo University Vet. CU. IACUC (approval number Vet.CU.28/4/2021/276).
Experimental Design
A total of 28 male mice were distributed into four groups (seven mice in each group) as follows: group 1 Balb/c control (BC), group 2 Balb/c multiple acute stress (BMAS), group 3 Swiss control (SC), and group 4 Swiss multiple acute stress (SMAS). Each mouse was subjected to multiple acute stressors in the MAS groups for 3-hours .
Sress Procedures
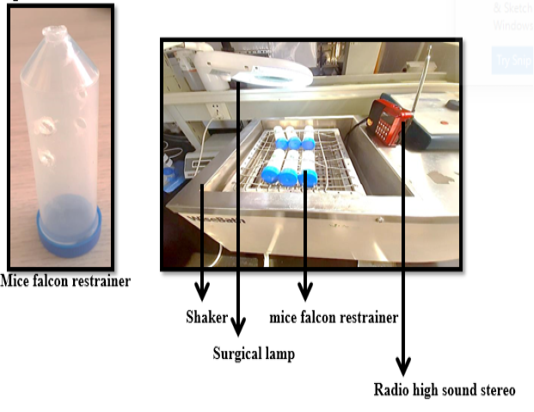
The stress procedures were performed by applying four stressors on the mice simultaneously for 3-hours as shown in (Table 1 and Figure 1) as described previously . All mice were checked during the stress procedures (every 10 or 15 min).
Table 1: The types of stressors and procedures
Stressors type
Procedures
Restrainer
50ml conical falcon tube with 5 holes to permit animal breathing
Shaker
200 rpm
Noise
high radio sound stereo85-90 db
Light
Direct light from surgical lamp
Behavioral Evaluations
Open field test: An open-aired Plexiglas black color cube measuring 40 cm L× 40 cm W × 30 H cm was used in the study. The floor of the apparatus was divided into 16 equal-sized squares, with 4 squares in the center and 12 squares in the periphery. At the beginning of the test, each animal was allowed to explore the arena freely for 5 min. A recording camera was mounted above the open field apparatus to video record the movements of each animal, and then the videos were analyzed by ANY-maze maze video analysis (version 4.5; Stoelting Co., Wood Dale, IL) Anxiety behavior was analyzed by measuring the distance traveled by each mouse in the center squares vs. the peripheral squares. Total immobility time (s), within the apparatus and the total distance traveled by each mouse were also calculated as described previously ; .
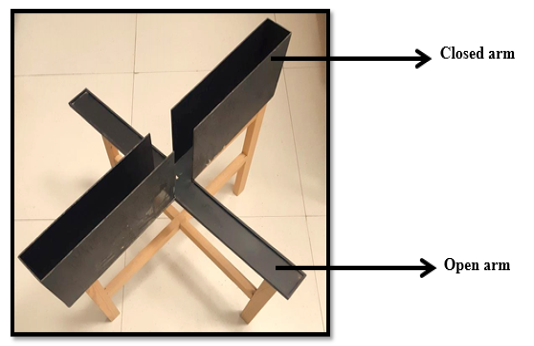
Elevated plus-maze test: Anxious-like behavior was measured using the elevated plus-maze test (EPM) . The EPM is made of a Plexiglas platform (Figure 2) containing four perpendicular black color arms, two open arms, two closed arms measuring35 cm L ×5 cm W, and the wall height of the closed arm is 20 cm, with a central open square of 5 cm2. The plus-maze is elevated on legs 50 cm above the ground surface. Before each mouse was introduced, the EMP surface was cleaned with cotton and alcohol to remove any residues, after which the mouse was introduced into the central open square facing a closed arm and then was allowed to move around freely in the maze for 5 min. A recording camera was mounted above the maze with a sufficient distance to record the movement of each animal, and the videos were analyzed by any maze video analysis. This is to analyze anxiety behavior for the number of entries in the open and the closed arms and time spent exploring the open and closed arms of the EMP according to . The maze was regularly cleaned with 70% ethyl alcohol to prevent odor bias (olfactory cues) of the previous mouse.
Dark Light activity box test: This test is performed in the same arena as the open field test, but with some modification that included an opaque black box inserted inside the open field which was divided into equal halves (light and dark) with a door containing a small opening between them . The mice were tested for 5 min in the light-dark box test. A recording camera was mounted above the dark light activity box to record the movement of each tested animal, and then the videos were analyzed by ANY-maze video analysis. The time spent by each mouse in the light vs. the dark compartments and to monitor the locomotors activity and the number of times the animal crossed between the two compartments were analyzed ; .
Blood Sampling
Blood samples were collected by using the orbital sinus puncture method by heparinized capillary tubes under the effect of ketamine xylazine cocktail anesthesia . The samples were transferred into Eppendorf tubes and centrifuged at 14,000 rpm for 10 min at 4℃. Then the resulting serum was separated and stored at −80 °C for biochemical analysis.
Biochemical Profile Sampling
Preparation of tissue homogenate: After sacrificing, the brain tissues of mice were washed thoroughly and rinsed on ice. They were gently blotted between the folds of a filter paper and weighed in an analytical balance. A 10% homogenate was prepared in 0.05 M phosphate buffer (PH 7) (Fisher Scientific Co., Norway) using the polytron homogenizer at 40C. The homogenate was centrifuged for 20 min at 10,000 rpm to remove the cell debris, erythrocytes, unbroken cells, mitochondria, and nuclei. Then the levels of MDA, GSH, IL-6, and TNF-α in the supernatant (cytoplasmic extract) were determined according to manual instructions. The protein content of the brain tissue was determined using the protein estimation kit (Genei, Bangalore) according to the method of (Bradford, 1976).
Determination of tissue protein: All enzyme-linked immunosorbent assay (ELISA) kits were evaluated using the ELISA reader. The color absorbance was read at OD 490 -630 nm using an ELISA plate reader (Stat Fax 2200, Awareness Technologies, Florida, USA).
Estimation of corticosterone: The mice corticosterone ELISA kit (#catalog#k7430-100) was used according to the manufacturer’s instructions.
Estimation of oxidative stress and antioxidant biomarkers: The mice ELISA kit (competitive (MDA) EIA) (catalog LS-F28474) and the mice (GSH) ELISA kit (catalog AMS.EA1490Mo) were used according to the manufacturer’s instructions.
Estimation of inflammatory biomarkers:The mice (IL-6) ELISA kit (catalog ab100713) and the mice (TNF-α) ELISA kit (catalog E-EL-M0049) were used according to the manufacturer’s instructions.
Statistical Analyses
All data were tested for normality and variance homogeneity before statistical analysis. Being normally distributed and variances homogeneous, the data were analyzed by one-way analysis of variance (ANOVA) followed by Bonferroni post hoc analysis (SPSS 24.0 software; SPSS Inc, Armonk, NY, USA). Significance was set at P<0.05.
Table 2: Effect of MAS on the locomotor activity of mice in the open field test.
Open field test. (BC) Balb/c control group, (BMAS) Balb/c multiple acute stress, (SC) Swiss control, and (SMAS) Swiss multiple acute stress groups. Data are expressed as mean ± standard error; (a, b, c, d) denote statistically significant differences at 0.005 between groups.
Treatment
Total distance travelled
Total time immobile (m/s)
Time in the center zone (s)
Distance travelled in the center zone (m)
Distance travelled in the peripheral zone (m)
BC
9.1883±3.809a
132.7 ±41.94a
0.2 ±0.2a
0.038 ±0.0380
8.269 ±3.6848a
BMAS
16.987±3.408b
145.48 ±34.82b
2.13 ±0.6b
0.2917 ±0.0836
13.5805 ±2.8055b
SC
10.987±1.272a
108.13 ±15.79c
0.03 ±0.03b
0 ±0.000
10.4217 ±1.5087c
SMAS
9.4358 ±2.635a
191.65 ±28.26d
2.17 ±0.7b
0.029 ±0.0941
4.9600 ±2.0249d
Table 3: Effect of MAS on the anxiety-like behavior of mice in the plus-maze test. Plus-maze test. (BC) Balb/c control group, (BMAS) Balb/c multiple acute stress, (SC) Swiss control, and (SMAS) Swiss multiple acute stress groups. Data are expressed as mean ± standard error; (a, b, c) denote statistically significant differences at 0.005 between groups.
Treatment
Number of entries to the open arm zone
Number of entries to the close arm zone
Time in the open arm zone (s)
Time in the close arm zone (s)
BC
7.86 ±3.13
15 ±4.57a
51.35 ±15.0a
218.37 ±28.0a
BMAS
4 ±1.53
9.33 ±2.96b
38.2 ±22.6b
271.43 ±49.1b
SC
6.17±1.56
12.33 ±2.40a
64.8 ±18.3a
227.63 ±24.62a
SMAS
4.67±0.88
10.83 ±1.76a
23.6 ±5.23c
360.1 ±33.68c
Table 4: Effect of MAS on the anxiety-like behavior of mice in the dark light activity box test.
Dark and light activity box test. (BC) Balb/c control group, (BMAS) Balb/c multiple acute stress, (SC) Swiss control, and (SMAS) Swiss multiple acute stress groups. Data are expressed as mean ± standard error; (a, b, c, d) denote statistically significant differences at 0.005 between groups.
Treatment
Time in light zone (s)
Time in the dark zone (s)
Number of entries to the light zone
Number of entries to the dark zone
BC
171.83 ±75.25a
119.27 ±76.94a
2 ±0.58
1.67 ±0.88
BMAS
129.54 ±58.40b
181.7 ±60.62b
3.4 ±1.21
2.8 ±1.36
SC
250.82 ±27.41 c
62.95 ±16.36 c
5.25 ±1.75
5.25 ±1.75
SMAS
155.63 ±67.71d
217.77 ±117.13d
5 ±3.51
5 ±3.51
Table 5: Effect of MAS on corticosterone, oxidative stress parameters (MDA and GSH), and inflammatory parameters (IL-6 and TNF-α) in mice blood serum.
MDA, GSH, IL-6, and TNF-α levels in the brain tissue. (BC) Balb/c control group, (BMAS) Balb/c multiple acute stress, (SC) Swiss control, and (SMAS) Swiss multiple acute stress groups. Data are expressed as mean ± standard error; (a, b, c, d) denote statistically significant differences at 0.005 between groups.
Treatment
Corticosterone
MDA
GSH
IL6
TNF
BC
4.7333
±0.26034a
3.96
±0.38a
201.4667
±8.5218a
32.7667
±3.33483a
42.00
±2.2942a
BMAS
8.1667
±0.35277b
5.3000
±0.38442a
155.700
±11.75004b
55.9000
±6.89855b
72.7333
±2.6295b
SC
11.400
±1.15902b
9.1333
±0.2333b
117.4333
±5.6875c
93.0667
±2.94184c
95.600
±3.8656b
SMAS
24.566
±1.61692c
13.1333
±0.7446c
72.7667
±2.85268d
167.4333
±8.8197d
188.366
±14.8416c
RESULTS
Behavioral Evaluations
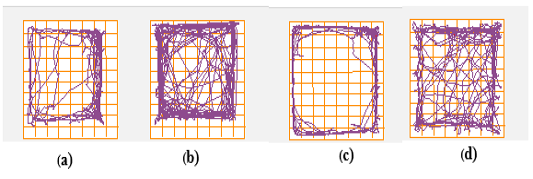
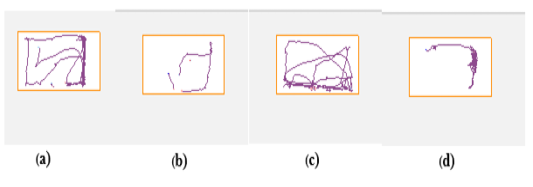
Open field test: SMAS mice displayed a marked increase in locomotors activity as evidenced by traveling less distance with a significant difference compared with BMAS mice. SMAS mice also showed highly significant increases in the total immobility time compared with BMAS mice. (Table 2 and Figure 3). However, SMSA mice traveled shorter distances in the peripheral zone of the open field
than BMAS mice.
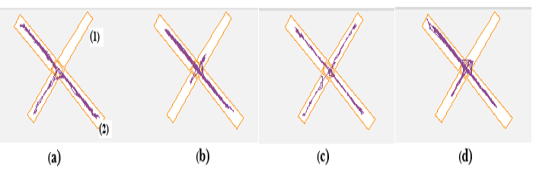
Plus-maze test: SMAS mice spent more time the in closed arm along with a significantly high number of entries in the closed arm compared to BMAS mice. However, they spent less time in the open arm compared with BMAS mice (Table 3 and Figure 4).
Dark light activity box test: SMSA mice spent more time in the dark zone than BMAS mice (Table 4 and Figure 5). They also spent highly significantly more time in the light zone than the time spent by BMAS mice (Table 4).
Biochemical Profile
The serum corticosterone levels in both SMSA and BMAS mice were significantly higher than those in the control groups SC and BC (Table 5). However, SMAS mice had high serum corticosterone levels compared with BMAS mice (Table 5).
In brain tissue, MDA levels were significantly higher in SMAS mice than in BMAS mice (Table 5). GSH levels showed significant differences between all the groups, SMAS mice had lesser GSH levels than BMAS mice (Table 5). The levels of IL-6 in SMAS mice were significantly higher than those in BMAS mice (Table 5). The levels of (TNF-α) in SMAS mice were also significantly high than those in BMAS mice (Table 5).
DISCUSSION
Mice have a pivotal role in biomedical research as they exhibit comprehensive strain variations that could affect the results of experiments. Therefore, it is important to examine the responsivity of two mice strains that are commonly used in stress research. In the present study, we exposed two mice strains (Swiss and Balb/c) to MAS for 3-hours and measured their behavioral and biochemical responses.
The behavioral response included the anxiety-like behavior measured using the open field test, EPM, and light-dark box. The open-field test is widely used and depends on the natural fear of rodents from open spaces. It is used to measure anxiety-like behavior, locomotion, and exploration.
We observed that SMAS mice traveled less distance peripherally and centrally in the total distance, but their total immobility time was more than that of had BMAS. These results were consistent with previous studies ; .
The plus-maze test is also used to measure anxiety-like behavior. It is based on the normal propensity of mice to avert an open or elevated arena counterbalanced with their natural inquisitiveness to explore places that are new to them. Mice that exhibit less anxiety will visit the open arms of the maze more frequently. However, mice that exhibit high anxiety will tend to visit closed arms more frequently . Thus, SMAS mice spent more time in closed arms and less time in open arms than BMAS mice. These results are consistent with previous research and indicated that Swiss mice were more affected by the applied MAS than Balb/c. mice..
In addition, the dark light activity box test is also used to measure anxiety-like behavior by analyzing the animal’s preferences for the light and dark compartments of the box, especially in response to mild stressors. This test is based on the normal disfavor of mice toward light spaces and susceptibility toward an exploratory behavior . SMAS mice spent more time in the dark compartment and less time in the open compartment than BMAS mice. These results are in agreement with the study of , who showed that the SMAS mice were more stressed than BMAS mice.
All of these findings reveal that Swiss mice demonstrated more stressful behavior than Balb/c mice in response to MAS.
Furthermore, the pattern in which stress affects phenotypically varies considerably across all individuals. However, similar stressors can provoke a high risk for different neuropsychiatric states in different individuals . This was obvious in the biochemical analysis of the serum for corticosterone levels, which is a steroid hormone that is induced by acute and chronic stress in mice and produced by the adrenal cortex it’s levels are increased in the serum in both types (acute and chronic) of stress . Its levels are also increased in the case of acute restraint stress . SMAS mice showed higher serum levels of corticosterone than BMAS mice, and both SMAS and BMAS mice showed higher corticosterone levels than SC and BC mice.
Stress also affects the cellular functions of the body through oxidative damage via the release of free radicals. Acute restraint stress is one of the stressors that stimulate several cellular events which result in the production of reactive oxygen species (ROS). These free radicals cause damage to the body system, especially the central nervous system as the brain is the organ with high oxygen consumption. Stress exposure in mice induces several neurochemical, hormonal, and behavioral abnormalities . Therefore, MDA is the often-used biomarker of oxidative stress in several health problems, including mood disorders . In the present study, SMAS mice exhibited higher MDA levels than BMAS mice, and both SMAS and BMAS mice showed higher (MDA) levels than SC and BC mice. We also observed depleted levels of GSH which is implicated in cell death that causes various neurological diseases . The levels of GSH in SMAS mice were lower than those in BMAS mice, indicating that Swiss mice are more affected and more exposed to neurological diseases under the effect of MAS than Balb/c mice.
Although neuroinflammation is involved in the process of neurodegeneration, all inflammatory cytokines such as (IL-6) and (TNF-α) participate in the inflammation process, which leads to an inflammatory response in the central nervous system . IL-6 is up-regulated in several animal models of brain injury . Hence, IL-6 levels were found to be significantly high in individuals who had suffered a traumatic brain injury . These data were very clearly to indicate that MAS exposure results in high IL-6 levels in SMAS mice compared to those in BMAS. However, each of SMAS and BMAS mice showed higher levels of IL-6 than the control groups SC and BC, respectively. TNF-α is an important factor for the onset of neurodegenerative diseases, and elevated levels of this cytokine were detected in the affected areas in the brain . Consequently, we also observed elevated concentrations of TNF-α in SMAS mice compared with BMAS mice because of the effect of multiple stressors on them.
CONCLUSION
MAS exposure to different mice strains as Swiss and Balb/c resulted in elevated levels of behavior and biochemical parameters in Swiss mice compared with Balb/c mice, concerning strain difference in all parameters in both strains. From the aforementioned results, we could conclude that Swiss albino mice are more adequate for use in stress research because of their high responsivity to MAS.
ACKNOWLEDGMENT
None.
CONFLICT OF INTEREST
The authors declare that there is no conflict of interest regarding the publication of this article.
AUTHORS CONTRIBUTION
Mohamed Y and Abeer H designed and planned this study. Rawda S prepared the animals and performed the experimental behavioral work, samples collection. All authors participated in manuscript writing and approved the final manuscript.
novelty statement
A new comparison between Balb/c and Swiss albino mice was implemented during the exposure to multiple concurrent acute stress (MAS) to screen the behavioral and biochemical responses.
Figures
Figure 1. Figure 1.
Mice falcon restrainer and MAS procedure.
Figure 2.
Plus maze test.
Figure 3.
Open field track plots. Open field track plots showing the position of the center of the animal (a) BC Balb/c control, (b) BMAS Balb/c multiple acute stress, (c) SC Swiss control, and (d) SMAS Swiss multiple acute stress groups.
Figure 4.
Plus-maze track plots. Plus-maze track plots show the position of the center of the animal, where (1) is the open arm, and (2) is the closed arm. (a) BC Balb/c control, (b) BMAS Balb/c multiple acute stress, (c) SC Swiss control, and (d) SMAS Swiss multiple acute stress groups.
Figure 5.
Dark light activity box track plots. Dark light track plots showing the position of the center of the animal in the light portion, where (a) BC Balb/c control, (b) BMAS Balb/c multiple acute stress, (c) SC Swiss control, and (d) SMAS Swiss multiple acute stress groups.
References
Atrooz F, Alkadhi KA, Salim S (2021). Understanding stress: Insights from rodent models. Curr. Res. Neurobiol. 2: 100013. https://doi.org/10.1016/j.crneur.2021.100013[CrossRef]
Bailey KR, Crawley JN (2009). Anxiety-Related Behaviors in Mice, in: Buccafusco, J.J. (Ed.), Methods of Behavior Analysis in Neuroscience, Frontiers in Neuroscience. CRC Press/Taylor & Francis, Boca Raton (FL).
Barlow SM, Morrison PJ, Sullivan FM (1975). Effects of acute and chronic stress on plasma corticosterone levels in the pregnant and non-pregnant mouse. J. Endocrinol. 66: 9O – 9. https://doi.org/10.1677/joe.0.0660093[CrossRef]
Belovicova K, Bogi E, Csatlosova K, Dubovicky M (2017). Animal tests for anxiety-like and depression-like behavior in rats. Interdiscip. Toxicol. 10: 40–43. https://doi.org/10.1515/intox-2017-0006[CrossRef]
Bradford MM (1976). A rapid and sensitive method for the quantitation of microgram quantities of protein utilizing the principle of protein-dye binding. Analyt. Biochem. 72: 248–254. https://doi.org/10.1016/0003-2697(76)90527-3[CrossRef]
Dickson DW (1997). The pathogenesis of senile plaques. J. Neuropathol. Exp. Neurol. 56: 321–339. https://doi.org/10.1097/00005072-199704000-00001[CrossRef]
Galiano M, Liu ZQ, Kalla R, Bohatschek M, Koppius A, Gschwendtner A, Xu S, Werner A, Kloss CU, Jones LL, Bluethmann H, Raivich G (2001). Interleukin-6 (IL6) and cellular response to facial nerve injury: effects on lymphocyte recruitment, early microglial activation and axonal outgrowth in IL6-deficient mice. Eur. J. Neurosci. 14: 327–341. https://doi.org/10.1046/j.0953-816x.2001.01647.x[CrossRef]
Hammen, C (2016). Depression and stressful environments: identifying gaps in conceptualization and measurement. Anxiety, Stress, & Coping.
Hariri AR, Holmes A (2015). Finding translation in stress research. Nat. Neurosci. 18: 1347–1352. https://doi.org/10.1038/nn.4111[CrossRef]
Hoff J (2000). Methods of Blood Collection in the Mouse. Lab Anim. 29: 7.
Hokenson RE, Oijala M, Short AK, Bolton JL, Chen Y, Molet J, Maras PM, Baram TZ, Lur G (2020). Multiple Simultaneous Acute Stresses in Mice: Single or Repeated Induction. Bio Protoc. 10: e3699. https://doi.org/10.21769/BioProtoc.3699[CrossRef]
Karatsoreos IN, Bhagat S, Bloss EB, Morrison JH, McEwen BS (2011). Disruption of circadian clocks has ramifications for metabolism, brain, and behavior. Proc. Natl. Acad. Sci. U S A. 108: 1657–1662. https://doi.org/10.1073/pnas.1018375108[CrossRef]
Kossmann T, Hans VH, Imhof HG, Stocker R, Grob P, Trentz O, Morganti-Kossmann C (1995). Intrathecal and serum interleukin-6 and the acute-phase response in patients with severe traumatic brain injuries. Shock. 4: 311–317. https://doi.org/10.1097/00024382-199511000-00001[CrossRef]
Kraeuter A-K, Guest PC, Sarnyai Z (2019). The Elevated Plus Maze Test for Measuring Anxiety-Like Behavior in Rodents. Methods Mol. Biol. 1916: 69–74. https://doi.org/10.1007/978-1-4939-8994-2_4[CrossRef]
Li Y, Shen R, Wen G, Ding R, Du A, Zhou J, Dong Z, Ren X, Yao H, Zhao R, Zhang G, Lu Y, Wu X (2017). Effects of Ketamine on Levels of Inflammatory Cytokines IL-6, IL-1β, and TNF-α in the Hippocampus of Mice Following Acute or Chronic Administration. Front. Pharmacol. 8: 139. https://doi.org/10.3389/fphar.2017.00139[CrossRef]
Mayo LM, Asratian A, Lindé J, Holm L, Nätt D, Augier G, Stensson N, Vecchiarelli HA, Balsevich G, Aukema RJ, Ghafouri B, Spagnolo PA, Lee FS, Hill MN, Heilig M (2020). Protective effects of elevated anandamide on stress and fear-related behaviors: translational evidence from humans and mice. Mol. Psychiat. 25: 993–1005. https://doi.org/10.1038/s41380-018-0215-1[CrossRef]
McVey Neufeld K-A, Kay S, Bienenstock J (2018). Mouse Strain Affects Behavioral and Neuroendocrine Stress Responses Following Administration of Probiotic Lactobacillus rhamnosus JB-1 or Traditional Antidepressant Fluoxetine. Front. Neurosci. 12: 294. https://doi.org/10.3389/fnins.2018.00294[CrossRef]
Patki G, Solanki N, Atrooz F, Allam F, Salim S (2013). Depression, anxiety-like behavior and memory impairment are associated with increased oxidative stress and inflammation in a rat model of social stress. Brain Res. 1539: 73–86. https://doi.org/10.1016/j.brainres.2013.09.033[CrossRef]
Perals D, Griffin AS, Bartomeus I, Sol D (2017). Revisiting the open-field test: what does it really tell us about animal personality? Anim. Behav. 123: 69–79. https://doi.org/10.1016/j.anbehav.2016.10.006[CrossRef]
Popović N, Stojiljković V, Pejić S, Todorović A, Pavlović I., Gavrilović L, Pajović SB (2019). Modulation of Hippocampal Antioxidant Defense System in Chronically Stressed Rats by Lithium. Oxidat. Med. Cellul. Longevit. e8745376. https://doi.org/10.1155/2019/8745376[CrossRef]
Rosmond R (2005). Role of stress in the pathogenesis of the metabolic syndrome. Psychoneuroendocrinology. 30: 1–10. https://doi.org/10.1016/j.psyneuen.2004.05.007[CrossRef]
Saharan S, Mandal PK (2014). The emerging role of glutathione in Alzheimer’s disease. J. Alzheimers Dis. 40: 519–529. https://doi.org/10.3233/JAD-132483[CrossRef]
Serchov T, Calker D. van, Biber K (2016). Light/Dark Transition Test to Assess Anxiety-like Behavior in Mice. Bio-protocol. 6: e1957–e1957.
Solomonow J (2015). Anxiety Behavior Induced in Mice by Acute Stress. Tulane Undergraduate Res. J. 2.
Sulakhiya K, Patel VK, Saxena R, Dashore J, Srivastava AK, Rathore M (2016). Effect of Beta vulgaris Linn. Leaves Extract on Anxiety- and Depressive-like Behavior and Oxidative Stress in Mice after Acute Restraint Stress. Pharmacog. Res. 8: 1–7. https://doi.org/10.4103/0974-8490.171100[CrossRef]
Thakare VN, Dhakane VD, Patel BM (2016). Potential antidepressant-like activity of silymarin in the acute restraint stress in mice: Modulation of corticosterone and oxidative stress response in cerebral cortex and hippocampus. Pharmacolog. Rep. 68: 1020–1027. https://doi.org/10.1016/j.pharep.2016.06.002[CrossRef]
Torrisi SA, Leggio GM, Drago F, Salomone S (2019). Therapeutic Challenges of Post-traumatic Stress Disorder: Focus on the Dopaminergic System. Front. Pharmacol. 10: 404. https://doi.org/10.3389/fphar.2019.00404[CrossRef]
Yalcin I, Belzung C, Surget A (2008). Mouse strain differences in the unpredictable chronic mild stress: a four-antidepressant survey. Behaviour. Brain Res. 193: 140–143. https://doi.org/10.1016/j.bbr.2008.04.021[CrossRef]
Yehuda R, LeDoux J (2007). Response variation following trauma: a translational neuroscience approach to understanding PTSD. Neuron. 56: 19–32. https://doi.org/10.1016/j.neuron.2007.09.006[CrossRef]