
Obesity has been shown to be associated with dyslipidemia. The study was aimed at determining the baseline dyslipidemia profile of a selected cohort of obese subjects and compare the results with healthy controls from Pakistan. 250 obese subjects and 225 healthy age and sex matched controls were analyzed for lipid profile (Total Cholesterol, Triglycerides, HDL-c, LDL-c and VLDL). The results showed that Pakistani obese patients are hyperlipidemic except for HDL, which is low in obesity. The anthropometric traits were significantly different between dyslipidemic obese subjects and nondyslipidemic non obese subjects. In conclusion, obesity is accompanied by a dyslipidemic profile and increased weight and/or BMI. The progression of clinical forms of obesity can be assessed by the strong predicting indices, including weight, BMI, low HDL and high TC.
Short Communication · Volume 50, Issue 6, 6 November 2018 · Open Access
Association of Anthropometric and Metabolic Indices in Obese Punjabi Subjects
· ·
Affiliations & Notes ⌄
- 1Department of Microbiology and Molecular Genetics, University of the Punjab, Lahore 54690 , * Corresponding author: shabana.mmg@pu.edu.pk
Article Info ⌄
- Journal:
- Pakistan Journal of Zoology
- Published:
- 6 November 2018

From the article
- We used Pearson’s correlation analysis to test the correlation between TC, TG, HDL, LDL and the ratios of TC/HDL and LDL/HDL.
- Although in our study, the TC/HDL ratio is significantly higher than controls, the values are below this cutoff.
- The current analysis showed that the dyslipidemic serum profile and increased weight are the strongest predictors of obesity.
- The study demonstrates that dyslipidemia occurs in obese population with increased levels of TC, TG and LDL-c and decreased levels of HDL-c while TC/HDL and LDL/HDL ratios are also significantly increased in the obese population.
Selected from the article's own text.
Abstract
Materials and methods
The study sample consisted of a total of 475 subjects, of which 250 were obese and 225 were non-obese controls . Study subjects were recruited by random sampling from public sector hospitals and the general population from Punjab, Pakistan after obtaining informed consent. The largest part of the subjects came from Lahore itself (46.52%), followed by Burewala (26. 6%), Bhakkar (13.6%), Rawalpindi (9.1%), and Faisalabad (4.1%). A detailed questionnaire regarding demographic information, lifestyle, exercise habits and family history of obesity was completed for each subject. The inclusion criteria were based on BMI and waist to hip ratio (WHR). The BMI cutoffs used were those defined for Asian population as described previously . An additional measure to differentiate between obese and non-obese used was WHR and a value of ≥ 0.85 in females and ≥ 1 in males was used as cut-off . Exlusion criteria included pregnancy, recent infection, functional disorders of liver or kidneys, and tumors. Subject recruitment was not restricted to any particular age group and subjects ranged in age from 10-78 years. All procedures were in compliance with the declaration of Helsinki and the study was approved by the institutional ethics committee (Ethical Committee, School of Biological Sciences, University of the Punjab, Pakistan).
Subjects were further divided into diabetic (DM) obese and non-diabetic (NDM) obese, hypertensive (HTN) and normotensive (NTN), and cardiovascular disease (CVD) and non-cardiovascular disease (NCVD) affected obese individuals. Diabetes was indicated by fasting
Table I.- Mean lipid profile parameters across different groups.
| Parameter | Controls (n=225) | Obese (n=250) | Diabetic | Non diabetic | HTN | NTN | CVD | NCVD |
| TC (mmol/l) | 4.11±0.79 | 5.53±0.90 | 5.65±1.11 | 5.50± 0.79 | 5.60± 0.77 | 5.52± 0.94 | 5.63± 0.87 | 5.51± 0.95 |
| TG (mmol/l) | 2.12±0.05 | 2.54±0.83 | 2.48±0.68 | 2.57± 0.89 | 2.63± 0.79 | 2.50± 0.83 | 2.57± 0.71 | 2.53± 0.87 |
| HDL (mmol/l) | 2.09±0.44 | 1.11±0.10 | 1.12±0.11 | 1.15± 0.11* | 1.11± 0.11 | 1.12± 0.11 | 1.12± 0.10 | 1.11± 0.12 |
| LDL (mmol/l) | 2.02±0.34 | 2.99±0.56 | 3.03±0.54 | 2.98± 0.58 | 3.07± 0.63 | 2.96± 0.56* | 3.07± 0.72 | 2.97± 0.56 |
| VLDL (mmol/l) | 0.42±0.09 | 0.51±0.16 | 0.51±0.14 | 0.51± 0.18 | 0.53± 0.16 | 0.50± 0.17* | 0.51± 0.14 | 0.51±0.17 |
| TC/HDL | 1.96±0.15 | 5.01±0.97 | 5.09±1.21 | 4.97± 0.83 | 5.10± 0.89 | 4.98± 0.99 | 5.03± 0.91 | 4.99± 1.01 |
| LDL/HDL | 0.97±0.06 | 2.69±0.36 | 2.71±0.29 | 2.59±0.39* | 2.71± 0.29 | 2.64± 0.29* | 2.74± 0.41 | 2.67±0.29* |
The table summarizes the general characteristics of the study population. Values are indicated as mean±SD (CI=95%). *, significant difference of the relevant parameter between the compared groups.TC, total cholesterol; TG, triglycerides; HDL-c, high density lipoprotein cholesterol; LDL-c, low density lipoprotein cholesterol; VLDL, very low density lipoprotein cholesterol; TC/HDL, ratio of TC to HDL values; LDL/HDL, ratio of LDL to HDL; HTN-hypertensives, NTN, normotensives; CVD, cardiovascular disease; NCVD, non-cardiovascular disease.
blood glucose (FBG) of 6.7mmol/L or above or 2 h postprandial blood glucose of 11.1mmol/L or above. The criterion for classification of hypertensive and normotensive individuals was based on report from seventh Joint National Committee for Hypertension, JNC-V . Blood pressure measurements were taken by a trained health professional after the subject had a 5 min sitting. Cardiovascular disease designation was based on clinical history.
Age, weight (Kg), height (m), waist and hip circumferences (cm) of the subjects were noted using standard methods. BMI and WHR were calculated for each subject.
For lipid profile estimation, 5ml blood was drawn after 12-14 h of fasting, into a vacutainer contining gel (clot activator) from median cubital vein with tourniquet tied on the limb and fingers squeezed. All tests were performed with sera. Plasma lipids and lipoprotein variables, namely total cholesterol (TC), and triglycerides (TG), were determined using commercially available kits (Spectrum Diagnostics). All optical density measurements were made using Epoch Biotek (SN 257866, USA) microplate reader.
Data was analyzed for means and standard deviation for all parameters. Data analysis was done by Microsoft excel and statistical package for social sciences (SPSS version 22). Quantitative variables were log transformed where appropriate. Comparisons for different parameters between categorized groups were performed using student’s t-test considering a p-value of 0.05 as statistically significant.
Results
A total of four hundred and seventy five subjects were used in the study. Obese subjects had a mean age of 37.78±11.53 and fulfilled the strict criteria for overweight and obesity as devised by the World Health Organization. The demographic characteristics of controls, obese, diabetic and non-diabetic obese, hypertensive and normotensive obese, and cardiac and non-cardiac obese subjects are summarized in Supplementary Table I.
Table I shows mean TC, TG, HDL-c, LDL-c, and VLDL concentrations in mmol/l and TC/HDL and LDL/HDL ratios between obese individuals overall and those categorized into different groups.
As obese subjects had a dyslipidemic profile in the majority of cases, we checked whether these lipid traits are correlated with the anthropometric parameters. We used Pearson’s correlation analysis to test the correlation between TC, TG, HDL, LDL and the ratios of TC/HDL and LDL/HDL. Among anthropometric traits, weight, BMI, WC, HC and WHR were tested. All these traits were significantly correlated with elevated serum TC, TG, TC/HDL and decreased HDL levels (Table II).
Table II.- Pearson’s correlation values between different anthropometric values and plasma lipid parameters.
| Para- meters | TC | TG | HDL | LDL | TC/ HDL | LDL/ HDL |
| Weight | 0.36** | 0.172** | -0.417** | 0.417** | 0.591** | 0.081 |
| BMI | 0.35** | 0.202** | -0.551* | 0.437** | 0.582** | 0.032 |
| WC | 0.265** | 0.123** | -0.418** | 0.332** | 0.446** | -0.06 |
| HC | 0.144** | 0.098* | -0.265** | 0.24** | 0.269** | 0.022 |
| WHR | 0.110* | 0.008 | -0.142** | 0.142 | 0.176** | -0.055 |
**, Correlation is significant at 0.01 level; *, Correlation is significant at 0.05 level.
We performed ROC curve analysis for assessing the predictive value of different anthropometric and biochemical parameters in predisposition to obesity (Fig. 1). It is clear that the maximum value for area under curve (AUC) was obtained for weight (0.990) followed by BMI (0.979), decreased HDL (0.926), WC (0.868), increased TC (0.811), increased LDL (0.804), HC (0.721), increased TG (0.0.679) and WHR (0.613).
Discussion
The study showed that the mean TC, TG, LDL-c concentrations, TC/HDL and LDL/HDL ratios are significantly increased in obese subjects in all categories whereas HDL-c concentrations are significantly decreased as compared to controls. This is in concordance with previous studies, but the patterns of dyslipidemia in different categories and across both genders is somewhat different from that previously reported. The significance of the study lies in that it is of the first of its type to establish a baseline data about lipid profile estimates for obese individuals in Pakistan.
TC/HDL ratio is considered to be a sensitive predictor of cardiovascular disease risk, especially if the values are ≥ 6 ; ; . Although in our study, the TC/HDL ratio is significantly higher than controls, the values are below this cutoff. In the USA, however, the TC/HDL ratio above 5 is considered to be atherogenic. Interestingly using this cut-off, we noticed a gender difference in the patterns of dyslipidemia among diabetic and non-diabetic groups. Among diabetics, the mean ratio for males, 5.22 is higher than the USA cut off while female had a ratio, 4.88 below the cut-off. On the contrary, in the non-diabetic group, females had a ratio, 5.08, higher than the cut off while males had a mean ratio, 4.89, lower than the cut-off.
Comparison of diabetic and non-diabetic individuals, all parameters, except HDL concentration (p<0.002) and LDL/HDL (p<0.001) ratio, did not show any significant difference from each other. The significant difference observed in HDL concentration and the LDL / HDL ratio can be attributed to the fact that although being non-diabetic, the individuals are obese and some also have cardiac problems therefore probably taking some lipid lowering drugs. Comparison of hypertensive and normotensive obese subjects with controls reveals a significant difference for all parameters. When hypertensive obese subjects are compared with normotensive obese subjects for lipid profile parameters, LDL-c values in the normotensive group were significantly lower than that in hypertensive subjects (p<0.001), while other parameters are not significantly different. HDL-c concentration is significantly reduced in hypertensives, while TC/HDL and LDL/HDL ratios are increased. Both groups had TC/HDL ratios greater than 5.0, and more specifically, values are higher for males as compared to females. In the cardiovascular disease group, the ratio is slightly and non-significantly higher than 5.0. This can be attributed to the fact that diagnosed cardiac cases are already on medications therefore there TC/HDL is not as high as expected for non-diagnosed or at risk patients and is considered atherogenic. Male diabetic, hypertensive and cardiac obese subjects consistently had lower HDL and higher LDL concentration as compared to females in the study. The difference observed, however not significant, is contrary to the findings of Cook et al. (2000).
The study had limitation of small sample size which is insufficient to rule out any minor gender related differences. The coexistence of several comorbidities further complicated the study.
Conclusion
The current analysis showed that the dyslipidemic serum profile and increased weight are the strongest predictors of obesity. The study demonstrates that dyslipidemia occurs in obese population with increased levels of TC, TG and LDL-c and decreased levels of HDL-c while TC/HDL and LDL/HDL ratios are also significantly increased in the obese population. The study provides information regarding the importance of lipid profile in the diagnosis and predisposition to obesity.
Acknowledgements
The study was supported by Indigenous scholarship (PIN#bm7-153) from the Higher Education Commission, Pakistan.
Supplementary material
There is supplementary material associated with this article. Access the material online at: http://dx.doi.org/10.17582/journal.pjz/2018.50.6.sc1
Statement of conflict of interest
Authors have declared no conflict of interest.
Figures
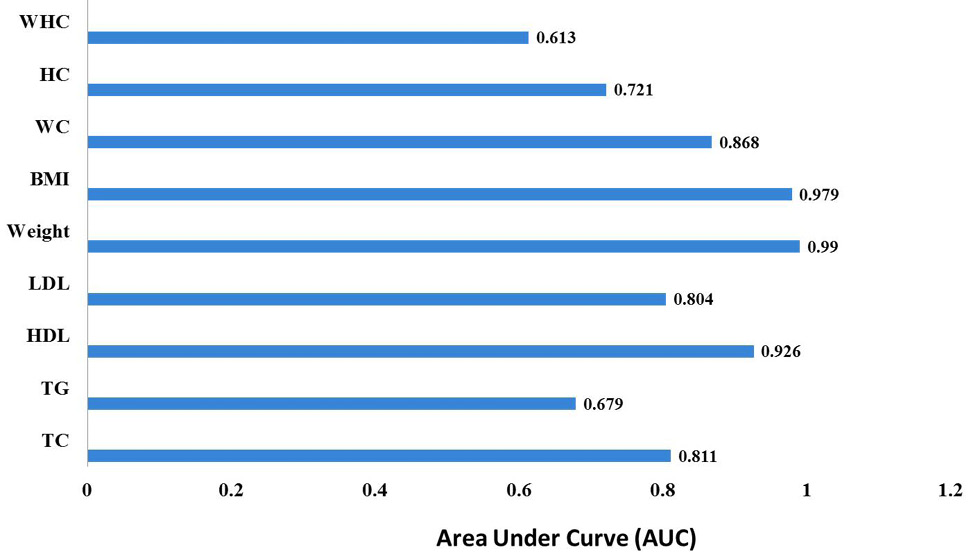
The ability of different anthropometric and lipid parameters to predict obesity.
References
- Anithakumari, A., Midhun, S., Biju, G. and Roy, R., 2015. J. Obes. Metab. Res., 2: 74. https://doi.org/10.4103/2347-9906.151754[CrossRef]
- Chobanian, A.V., Bakris, G.L., Black, H.R., Cushman, W.C., Green, L.A., Izzo, J.L., Jones, D.W., Materson, B.J., Oparil, S. and Wright, J.T., 2003. Hypertension, 42: 1206-1252. https://doi.org/10.1161/01.HYP.0000107251.49515.c2[CrossRef]
- Consultation, W., 2000. Obesity: Preventing and managing the global epidemic. World Health Organ. Tech. Rep. Ser., 894.
- Cook, C.B., Erdman, D.M., Ryan, G.J., Greenlund, K.J., Giles, W.H., Gallina, D.L., El-Kebbi, I.M., Ziemer, D.C., Ernst, K.L. and Dunbar, V.G., 2000. Diabetes Care, 23: 319-324. https://doi.org/10.2337/diacare.23.3.319[CrossRef]
- Eldin, L.B., Algamal, H.A., El-Dory, G.F., Rashad, M., El Arab, S.E. and Alella, N.A.A., 2014. Egyptian J. Ped. Allerg. Immunol., 6: 27-34
- Genest, J., Frohlich, J., Fodor, G. and McPherson, R., 2003. Can. med. Assoc. J., 169: 921-924.
- Gordon, L., Ragoobirsingh, D., St Errol, Y., Choo-Kang, E., McGrowder, D. and Martorell, E., 2010. J. Lab. Physic., 2: 25. https://doi.org/10.4103/0974-2727.66709[CrossRef]
- Hu, D., Hannah, J., Gray, R.S., Jablonski, K.A., Henderson, J.A., Robbins, D.C., Lee, E.T., Welty, T.K. and Howard, B.V., 2000. Obes. Res., 8: 411-421. https://doi.org/10.1038/oby.2000.51[CrossRef]
- Javed, A., Jumean, M., Murad, M., Okorodudu, D., Kumar, S., Somers, V., Sochor, O. and Lopez-Jimenez, F., 2014. Ped. Obes., 10: 234-244. https://doi.org/10.1111/ijpo.242[CrossRef]
- Laakso, M., 1997. J. Diab. Compl., 11: 137-141. https://doi.org/10.1016/S1056-8727(96)00092-X[CrossRef]
- Nagashree, V., Rumana, N. and Devi, M., 2015. Indian J. clin. Anat. Physiol., 2: 16-20.
- Shabana, Shahid, S.U., Li, K.W., Acharya, J., Cooper, J.A., Hasnain, S. and Humphries, S.E., 2016. Eur. J. Hum. Genet., 24: 903-910. https://doi.org/10.1038/ejhg.2015.212[CrossRef]
- Thakur, J.S. and Bisht, S., 2010. VSRD Tech. Non Tech. J., 1: 26-29.
- Yusuf, S., Hawken, S., Ôunpuu, S., Bautista, L., Franzosi, M.G., Commerford, P., Lang, C.C., Rumboldt, Z., Onen, C.L. and Lisheng, L., 2005. The Lancet, 366: 1640-1649. https://doi.org/10.1016/S0140-6736(05)67663-5[CrossRef]
Supplementary material
Cited by 1 article
In journals published by ResearchersLinks.
Services
Article usage statistics
Loading…