Research Article · Volume 14, Issue 4, 6 September 2026 · Open Access
A 19 bp Indel of the PLAG1 as a Potential Marker for Growth Performance in Indonesian Ongole Cattle
· · · · · · ·
Affiliations & Notes ⌄
1Department of Animal Science, Universitas Sebelas Maret, Jl. Ir. Sutami 36 Kentingan, Jebres, Surakarta 57126, Indonesia
2Institute for Good Breeding Practice and Green Animal Fodders Sembawa, Directorate General for Livestock and Animal Health, Jl. Raya Palembang - Pangkalan Balai KM 29 Desa Lalang Sembawa, Sembawa, Banyuasin 30953, Indonesia. *Correspondence | Muhammad Cahyadi, Department of Animal Science, Universitas Sebelas Maret, Jl. Ir. Sutami 36A Kentingan, Jebres, Surakarta, Jawa Tengah 57126, Indonesia
In the present study, the g.32212 (19 bp indel) polymorphism was significantly associated with chest girth in PO cattle, with animals carrying the DD genotype exhibiting larger chest girth than those with the ID genotype.
This study confirmed polymorphisms at two PLAG1 loci in PO cattle.
The g.32212 (19 bp indel) variant showed a significant association with chest girth in PO cattle, indicating potential relevance to body measurement.
Further study using larger populations, additional PLAG1 variants, and whole-genome association approaches (GWAS) is recommended to validate these findings.
Selected from the article's own text.
Abstract
This study investigated the association of PLAG1 gene polymorphisms with growth-related traits in Indonesian Ongole cattle maintained at the Institute for Good Breeding Practice and Green Animal Fodders (BPTU-HPT) Sembawa, Indonesia. A total of 101 animals were genotyped for two PLAG1 polymorphisms, g.48308C>T and a 19 bp insertion/deletion (g.32212). Genotype frequencies for g.48308C>T were CC (n = 16), CT (n = 50), and TT (n = 35), whereas those for the 19 bp indel were DD (n = 89) and ID (n = 12), with no II genotype detected. Association analysis revealed that the 19 bp indel was associated with chest girth (P = 0.042), with DD animals exhibiting greater chest girth (69.47 ± 0.48 cm) than ID animals (66.75 ± 1.35 cm). No significant associations were observed for the remaining growth traits. Similarly, the g.48308C>T polymorphism showed no significant association with any trait evaluated. Linkage disequilibrium analysis using Haploview indicated weak LD between the two loci (D′ = 0.22; r² = 0.002), suggesting that they segregate largely independently in the studied population. These findings indicate a potential role of the PLAG1 19 bp indel in body measurement. However, the highly unbalanced genotype distribution and absence of the II genotype warrant cautious interpretation. Further validation in larger populations is required before this variant can be considered for marker-assisted selection in PO cattle.
Beef cattle production plays a strategic role in supporting national food security and meeting the increasing demand for animal-derived protein in Indonesia. Nevertheless, domestic beef production remains insufficient to satisfy national consumption requirements, resulting in a supply deficit of approximately 263 thousand tons annually (BPS, 2024). Enhancing the genetic merit of local cattle populations is therefore considered one of the most sustainable long-term approaches for improving productivity, feed efficiency, carcass quality, and adaptation to tropical production environments . Recent advances in livestock genomics have further accelerated the implementation of genomic-assisted breeding strategies aimed at improving economically important traits in beef cattle under diverse environmental conditions .
Indonesian Ongole cattle, a Bos indicus derived breed widely distributed in Indonesia, are recognized for their adaptability to hot and humid climates, resistance to environmental stressors, and ability to survive under low-input production systems ; . Despite these adaptive advantages, PO cattle generally exhibit moderate growth performance and carcass productivity compared with specialized commercial beef breeds. Improvement of productive efficiency in PO cattle requires an integrated approach involving nutrition, management, and genetics. Among these factors, genetic background exerts substantial influence on body conformation, growth rate, carcass composition, and feed utilization efficiency ; . Consequently, identification of functional genetic markers associated with growth-related phenotypes has become increasingly important for accelerating genetic improvement in Indonesian tropical cattle populations.
Molecular breeding approaches, particularly marker-assisted selection (MAS), enable the incorporation of DNA polymorphisms into conventional selection programs to improve breeding accuracy and shorten generation intervals . Among candidate genes associated with bovine growth traits, Pleomorphic adenoma gene 1 (PLAG1) has received considerable attention due to its pleiotropic effects on body size, carcass traits, and reproductive performance. The PLAG1 gene, located on bovine chromosome 14 (BTA14), encodes a zinc-finger transcription factor involved in the regulation of insulin-like growth factor pathways, cellular proliferation, embryonic development, and skeletal growth ; . Functional studies have demonstrated that PLAG1 regulates growth-associated pathways through modulation of IGF2 expression and related endocrine mechanisms . Variants within or near PLAG1 have consistently been identified as major quantitative trait loci (QTL) affecting stature, body weight, carcass composition, and puberty traits in cattle populations worldwide ; ; . In addition, recent evidence indicates that PLAG1 may also contribute to muscle development, adipogenesis, and meat quality regulation through interactions with metabolic signaling pathways .
Several polymorphisms within PLAG1, including single nucleotide polymorphisms (SNPs) and insertion/deletion (indel) variants, have been associated with economically important growth traits across Bos taurus and Bos indicus breeds. Previous studies reported significant associations between PLAG1 variants and body measurements in Brahman cattle , body weight in Madura and Bali cattle , and skeletal development traits in Chinese cattle populations ; . However, despite the economic and genetic importance of PO cattle, information regarding PLAG1 polymorphisms and their association with growth performance in this breed remains limited. Furthermore, the effects of PLAG1 variants appear to be breed-dependent, likely due to differences in genetic background, linkage disequilibrium structure, and environmental adaptation ; . Therefore, the present study aimed to evaluate the association of two PLAG1 polymorphisms, namely g.48308C>T and the g.32212 19 bp indel, with growth-related traits in Indonesian Ongole cattle. The findings of this study are expected to provide additional insight into the genetic architecture of growth traits in Indonesian cattle and support the future implementation of PLAG1-based molecular markers in tropical beef cattle breeding programs.
Materials and Methods
Animals, management, and phenotypic data
A total of 101 Indonesian Ongole cattle maintained at the Institute for Good Breeding Practice and Green Animal Fodders (BPTU-HPT) Sembawa, Indonesia, were included in this study. All animals were clinically healthy and managed under a semi-intensive production system. The daily ration consisted of approximately 3 kg of commercial concentrate and 30 kg of fresh forage grass per animal.
Phenotypic records included birth weight, body length, withers height, chest girth, hip height, corrected body weight at 750 days, mature body weight, and average daily gain (ADG). Morphometric traits were recorded according to the routine performance recording protocol of BPTU-HPT Sembawa at standardized ages, thereby minimizing age-related variation among animals. These measurements were selected because they are widely used indicators of growth performance, skeletal development, and carcass production potential in beef cattle.
DNA extraction
Genomic DNA was isolated from whole blood samples using a commercial extraction kit (Geneaid Biotech Ltd., Taiwan) following the manufacturer’s instructions with slight optimization. Approximately 300 μL of blood was transferred into a 1.5 mL microtube and mixed with three volumes of red blood cell (RBC) lysis buffer. The suspension was allowed to stand for 10 minutes at room temperature and then centrifuged at 3,000 rpm for 5 minutes to remove the supernatant. The resulting pellet was resuspended in 100 μL of RBC lysis buffer and mixed with 200 μL of GB buffer to lyse the cells completely. The tube was incubated at 60°C for 10 minutes with gentle inversion every few minutes. Afterward, 200 μL of absolute ethanol was added to the lysate and vortexed briefly before being transferred to a GD spin column placed in a 2 mL collection tube. The column was centrifuged at 14,000–16,000 rpm for 5 minutes to bind DNA to the membrane. The column was then washed twice, first with 400 μL of W1 buffer and then with 600 μL of wash buffer, each followed by short centrifugation to remove impurities. To ensure complete removal of ethanol, the column was centrifuged again for 3 minutes at maximum speed. Finally, the column was placed in a new 1.5 mL microtube, and 100 μL of pre-warmed elution buffer (60°C) was added to release the DNA. After a 3-minute incubation, the tube was centrifuged at 14,000 rpm for 30 seconds. The purified genomic DNA was then stored at –20°C for downstream analyses, including PCR amplification and genotyping.
Amplification and genotyping of PLAG1 polymorphisms
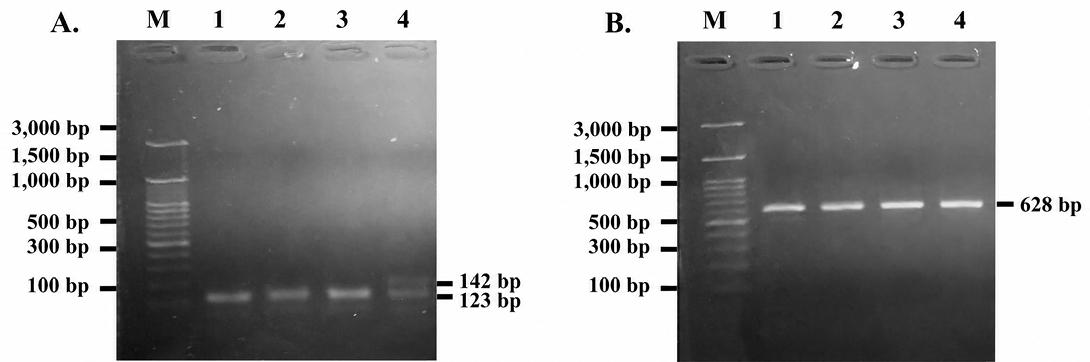
Two polymorphic loci within the PLAG1 gene, namely g.48308C>T and g.32212 (19 bp indel), were amplified using the primer pairs listed in Table 1. Polymerase chain reactions (PCR) were performed in a final volume of 25 μL containing 12.5 μL of 2× MyTaq HS Red Mix (Bioline, UK), 1 μL of each primer, 1 μL of genomic DNA, and 9.5 μL of nuclease-free water (Promega, USA). Amplification was carried out in a MiniAmp® Thermal Cycler (Thermo Fisher Scientific, Singapore) under the following conditions: Initial denaturation at 95°C for 5 min; 35 cycles of 95°C for 30 s, 60°C for 30 s, and 72°C for 30 s; followed by a final extension at 72°C for 10 min. PCR products were separated on 1.5% agarose gels prepared in 1× TAE buffer, stained with FluoroSafe, and visualized under ultraviolet illumination. Fragment sizes were estimated using a 100 bp DNA ladder (Figure 1).
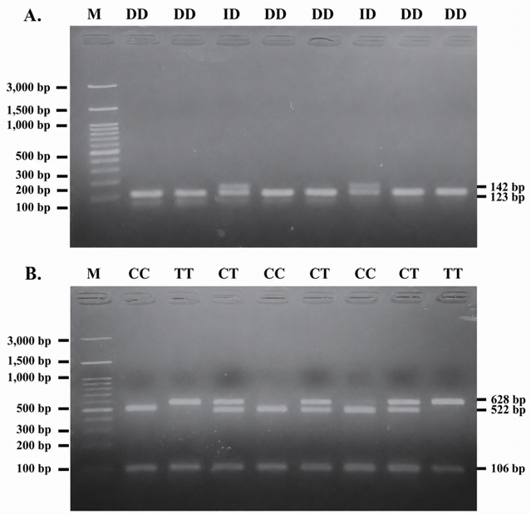
Genotyping was performed using PCR–restriction fragment length polymorphism (PCR-RFLP) and fragment size analysis. For the g.32212 (19 bp indel), the insertion (I) allele generated a 142 bp fragment, whereas the deletion (D) allele generated a 123 bp fragment (Figure 1A). Consequently, the DD genotype was identified by a single 123 bp band, the ID genotype by two bands (142 and 123 bp), and the II genotype by a single 142 bp band (Figure 1B).
For the g.48308C>T polymorphism, the 628 bp PCR product was digested with SacII (Figure 2A). The CC genotype produced two fragments of 522 and 106 bp, the TT genotype remained undigested and yielded a single 628 bp fragment, whereas the CT genotype displayed three fragments of 628, 522, and 106 bp (Figure 2B). Genotypes were assigned according to the resulting electrophoretic patterns.
Table 1: Primer pairs targeting two polymorphisms of PLAG1.
Polymorphism
Location
Primer (5’ to 3’)
Annealing (oC/sec.)
Amplicon (bp)
Restriction enzyme
g.48308 C>T
3’ UTR
F: GCGCGTATCAGTCAGGACAT
R: CCTTTGCCTGTTGCTTTCCC
58/45
628
SacII
g.32212
(19 bp indel)
Intron 3
F: TCCGAACAACAGGTGAGGGAGAAAT
R: CCACTTCAGGGGTGCTCTAGGTTTG
60/30
142/123
-
UTR is an untranslated region.
Linkage disequilibrium analysis
Pairwise linkage disequilibrium (LD) between the g.48308C>T SNP and the g.32212 (19 bp indel) was estimated using Haploview version 4.2 . LD was quantified using Lewontin’s standardized disequilibrium coefficient (D′) and the squared correlation coefficient (r²).
Statistical analysis
Allele and genotype frequencies were calculated according to Nei and Kumar (2000), and deviations from Hardy–Weinberg equilibrium (HWE) were assessed using the chi-square (χ²) test.
Associations between PLAG1 genotypes and growth traits were evaluated using the following mixed linear model implemented in MINITAB 19.1:
Yᵢⱼ = μ + Gᵢ + Sⱼ + eᵢⱼ
Where Yᵢⱼ is the observed phenotypic value, μ is the overall mean, Gᵢ is the fixed effect of genotype, Sⱼ is the random effect of sire, and eᵢⱼ is the random residual error.
Morphometric traits were recorded within a standardized age range under the institutional performance recording system. Therefore, age at measurement was not included as a covariate. Statistical significance was declared at P < 0.05, and differences among least-squares means were compared using Tukey’s honestly significant difference (HSD) test.
Because the g.32212 (19 bp indel) locus exhibited a highly unbalanced genotype distribution, a post-hoc power analysis was conducted for chest girth based on the observed effect size. The difference between DD and ID genotypes (2.72 cm) corresponded to a large standardized effect (Cohen’s d ≈ 0.80). Under unequal sample sizes (n = 89 and n = 12) and α = 0.05, the estimated statistical power ranged from 0.70 to 0.75. Although sufficient to detect moderate-to-large effects, this power remained below the conventional threshold of 0.80 and therefore warrants cautious interpretation of the observed association.
Results
PLAG1 genotyping outcomes
Genotyping successfully identified polymorphisms at two loci of the PLAG1 in PO cattle population. For the g.48308C>T locus, three genotypes were detected, CC (n = 16), CT (n = 50), and TT (n = 35), while for the g.32212 (19 bp indel) locus, two genotypes were observed, DD (n= 89) and ID (n= 12) (Table 2). The g.48308C>T locus exhibited moderate genetic variation, as indicated by the balanced distribution among homozygous and heterozygous genotypes. In contrast, the g.32212 locus showed a predominance of the DD genotype, suggesting a lower level of polymorphism.
Table 2: Allele and genotype frequencies for PLAG1 polymorphisms.
Locus
Genotype frequency
Allele frequency
Chi-Square (χ²) Test
g.48308C>T
CC= 0.158, CT= 0.495, TT= 0.346
C = 0.406 T = 0.594
χ² = 0.0746, df = 1, p > 0.05, Expected: CC = 0.3067, CT = 0.494, TT = 0.199
g.32212 (19 bp indel)
DD= 0.881, ID= 0.119, II= 0
I = 0.059 D = 0.941
χ² = 0.408, df = 1, p > 0.05, Expected: DD = 0.885, ID = 0.111, II = 0.0035
Table 3: Association of PLAG1 polymorphism g.48308C>T with growth traits in PO cattle population.
Variable
g.48308C>T
P value
CC (16)
CT (50)
TT (35)
Birth weight (kg)
31.13±1.09
30.62±0.52
29.57±0.39
0.235
Body length (cm)
60.31±0.82
60.42±0.60
59.74±0.59
0.691
Withers height (cm)
73.88±0.63
73.00±0.48
73.26±0.57
0.675
Chest girth (cm)
69.13±1.05
69.70±0.72
68.37±0.69
0.315
Hip height (cm)
77.94±0.66
77.40±0.45
76.97±0.53
0.545
Corrected body weight at 750 days (kg)
281.30±11.70
274.22±5.98
266.46±7.73
0.719
Mature body weight (kg)
281.00±11.40
273.74±6.11
265.03±7.72
0.658
Mature body length (cm)
123.06±1.53
122.08±0.85
121.40±0.94
0.775
Mature withers height (cm)
125.69±1.08
126.04±0.56
125.63±0.63
0.906
Mature chest girth (cm)
155.50±2.43
155.10±1.33
155.49±1.63
0.984
Mature hip height (cm)
132.60±1.25
133.43±0.60
133.00±0.73
0.766
Average daily gain (kg)
0.32±0.02
0.31±0.01
0.29±0.02
0.766
Association of the g.48308C>T polymorphism with growth traits
The association between the g.48308C>T polymorphism of the PLAG1 and growth-related traits is presented in Table 3. Statistical analysis revealed no significant differences (P> 0.05) among genotypes (CC, CT, and TT) for any of the evaluated phenotypic traits.
Association of the g.32212 (19 bp indel) polymorphism with growth traits
The association analysis of the g.32212 (19 bp indel) polymorphism with growth traits is summarized in Table 4. A nominally significant association (P = 0.042) was observed between the g.32212 (19 bp indel) and chest girth, with DD genotypes showing larger mean values than ID genotypes. Given the highly unbalanced genotype frequencies, this result should be interpreted as suggestive rather than definitive. Other traits, including birth weight, withers height, hip height, corrected body weight at 750 days, mature body weight, body length, and ADG, did not differ significantly (P > 0.05) between genotypes.
Linkage disequilibrium between PLAG1 polymorphisms
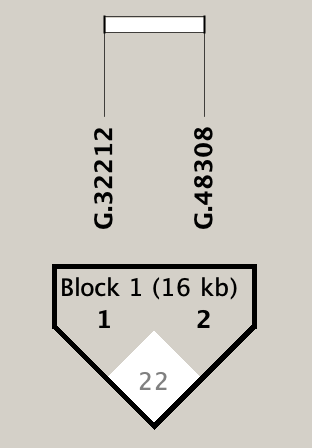
Pairwise LD analysis performed using Haploview revealed weak linkage disequilibrium between the g.48308C>T SNP and the g.32212 (19 bp indel), with D′ and r² values of 0.22 and 0.002, respectively (Figure 3). These results indicate a low degree of non-random association and virtually no correlation between the two loci, suggesting that they segregate largely independently in the PO cattle population.
Table 4: Association of g.32212 (19 bp indel) of the PLAG1 with growth traits in PO cattle population.
Variable
g.32212 (19 bp indel)
P value
DD (89)
ID (12)
Birth weight (kg)
30.55±0.35
28.75±1.19
0.088
Body length (cm)
60.44±0.40
58.17±0.98
0.051
Withers height (cm)
73.30±0.34
72.67±1.02
0.501
Chest girth (cm)
69.47a±0.48
66.75b±1.35
0.042
Hip height (cm)
77.44±0.32
76.58±0.98
0.336
Corrected body weight at 750 days (kg)
272.47±4.61
274.00±14.60
0.780
Mature body weight (kg)
271.65±4.58
273.50±15.50
0.779
Mature body length (cm)
121.89±0.63
122.83±1.64
0.488
Mature withers height (cm)
125.71±0.41
126.83±1.17
0.331
Mature chest girth (cm)
155.40±1.02
154.50±2.44
0.751
Mature hip height (cm)
133.00±0.46
134.27±1.38
0.358
Average daily gain (kg)
0.31±0.01
0.27±0.04
0.302
Discussion
The Pleomorphic adenoma gene 1 (PLAG1) encodes a zinc-finger transcription factor involved in the regulation of growth, development, somatic cell proliferation, and skeletal formation . Variants within or near PLAG1 have been consistently associated with economically important traits, including body size, carcass composition, and reproductive performance across livestock species ; ; . Given its pleiotropic role, PLAG1 has emerged as one of the most important candidate genes influencing growth-related traits in cattle.
In the present study, the g.32212 (19 bp indel) polymorphism was significantly associated with chest girth in PO cattle, with animals carrying the DD genotype exhibiting larger chest girth than those with the ID genotype. Chest girth is an important indicator of thoracic development, body capacity, and carcass production potential . This finding agrees with previous studies reporting associations between PLAG1 polymorphisms and growth-related traits in cattle. For example, Trilaksono et al. (2024) reported significant effects of the g.48308C>T SNP and the 19 bp indel on body weight and chest girth in Brahman cattle, whereas Cahyadi et al. (2022) demonstrated that an intronic PLAG1 variant influenced body length in Bali cattle. Collectively, these findings support the involvement of PLAG1 in skeletal growth and body conformation in Indonesian cattle breeds.
The biological relevance of the 19 bp indel is further supported by studies conducted in other cattle populations. Xu et al. (2018) identified the same indel in multiple Chinese cattle breeds and reported significant associations with growth traits, suggesting that this variant, or a closely linked functional mutation, may contribute to skeletal development. Similarly, Zhou et al. (2019) demonstrated that the 19 bp indel was widely distributed across 37 Chinese native breeds and significantly associated with body height and chest circumference. Together with the present results, these studies indicate that the PLAG1 19 bp indel may represent a conserved source of genetic variation influencing body size in cattle.
Despite the observed association, the results should be interpreted cautiously due to the highly unbalanced genotype distribution at the g.32212 locus, characterized by the absence of the II genotype and the low frequency of heterozygotes. The insertion allele frequency was only 0.059, yielding an expected II genotype frequency of approximately 0.35% under Hardy–Weinberg equilibrium. Consequently, fewer than one II individual would be expected in the sampled population, indicating that the absence of this genotype is likely attributable to low allele frequency and limited sample size rather than biological lethality or strong negative selection. Similar genotype distributions have been reported in Bos indicus-derived cattle populations carrying the same polymorphism ; .
The skewed genotype distribution may also reduce statistical power and increase susceptibility to Type I error, particularly in association studies involving low-frequency variants ; . Nevertheless, post-hoc analysis indicated that the observed association with chest girth was accompanied by a relatively large effect size (Cohen’s d ≈ 0.80), partially compensating for the reduced power associated with unequal sample sizes. Moreover, consistent associations of the same 19 bp indel with growth- and body size-related traits across independent cattle populations provide additional biological support for the observed relationship ; ; . Nonetheless, validation in larger populations remains necessary before this variant can be confidently incorporated into marker-assisted selection programs.
In contrast, no significant association was detected between the g.48308C>T SNP and any of the evaluated growth traits. This discrepancy may be explained, at least in part, by the weak linkage disequilibrium observed between the two PLAG1 polymorphisms (D′ = 0.22; r² = 0.002). Although both variants are located within the same gene, the extremely low r² value indicates that the 3′ UTR SNP does not effectively tag the 19 bp indel in the studied population. Therefore, the association observed for the indel is unlikely to be attributable to linkage with the g.48308C>T SNP and more likely reflects an independent genetic signal or linkage with another functional variant within the PLAG1 region.
Several genomic studies provide additional support for the role of PLAG1 in growth regulation. Song et al. (2016) identified a pleiotropic quantitative trait nucleotide within the PLAG1–CHCHD7 region that explained a substantial proportion of variation in multiple carcass traits in Simmental cattle. Furthermore, Li et al. (2019) reported genotype-dependent differences in PLAG1 mRNA expression among tissues and developmental stages, suggesting that sequence variation within this region may influence growth through transcriptional regulation. Likewise, Hou et al. (2020) demonstrated associations between PLAG1 variants and adult body height in Chinese cattle, supporting the notion that PLAG1 exerts stronger effects on skeletal development and mature body size than on early-life growth traits.
Recent evidence also indicates that PLAG1 influences traits beyond body size. Engle and Hayes (2022), using genomic data from 2,839 Australian Brahman cows, reported significant associations between PLAG1 variants and both growth and fertility traits, suggesting that the gene contributes to endocrine pathways affecting somatic and reproductive development. In addition, Wang et al. (2023) showed that PLAG1 copy number variations were associated with body size traits in goats, highlighting the conserved biological role of PLAG1 across ruminant species and emphasizing the potential importance of structural variants, including indels, in regulating growth-related phenotypes.
The absence of association for the g.48308C>T SNP may reflect limited statistical power, breed-specific linkage disequilibrium patterns, or interactions between genetic background and environmental conditions. Previous studies have demonstrated that the phenotypic effects of PLAG1 variants vary among cattle breeds and production systems . Furthermore, PLAG1 generally exerts stronger effects on mature stature and skeletal dimensions than on juvenile growth traits ; , which may explain the lack of detectable effects for several traits evaluated in the present study.
Overall, the results suggest that the PLAG1 g.32212 (19 bp indel) polymorphism may contribute to variation in chest girth in PO cattle. Combined with evidence from Brahman, Bali, and Chinese cattle populations, the findings further support the role of PLAG1 as an important growth-related gene in cattle. However, because of the limited sample size and highly unbalanced genotype distribution, the observed association should be regarded as preliminary until confirmed in larger populations. Future studies incorporating larger datasets, genome-wide association analyses, and functional genomic approaches will be valuable for elucidating the molecular mechanisms through which PLAG1 influences growth, body conformation, and production traits in tropical cattle.
Conclusions
This study confirmed polymorphisms at two PLAG1 loci in PO cattle. The g.32212 (19 bp indel) variant showed a significant association with chest girth in PO cattle, indicating potential relevance to body measurement. However, due to limited genotype balance, this finding should be considered preliminary and requires validation in larger populations before application in breeding programs. Further study using larger populations, additional PLAG1 variants, and whole-genome association approaches (GWAS) is recommended to validate these findings.
Acknowledgments
This study was funded by RKAT Universitas Sebelas Maret for Fiscal Year 2025 under the Penelitian Unggulan Terapan (PUTA-UNS) with Research Assignment Agreement Number: 369/UN27.22/PT.01.03/2025. The authors sincerely thank the staff of the Institute for Good Breeding Practice and Green Animal Fodders Sembawa (BPTU-HPT Sembawa), Indonesia, for their valuable assistance during blood sample collection and phenotypic data recording. Their technical expertise and dedication were essential to the successful completion of this study.
Novelty Statement
This study is the first to evaluate the effects and linkage disequilibrium of the PLAG1 g.48308C>T SNP and the 19 bp indel in Indonesian Ongole cattle. It demonstrates a breed-specific association of the 19 bp indel with chest girth and provides new genetic evidence supporting the potential application of PLAG1 in marker-assisted selection for beef cattle breed.
Authors Contribution
DDP: Writing original draft, investigation, formal analysis, data curation. AERM: Methodology, Formal analysis. WP: Writing review and editing, validation, funding acquisition, supervision. YY: Validation, funding acquisition, formal analysis. SS: Validation, funding acquisition, formal analysis. HK: Investigation, data curation. MI: Investigation, data curation. MC: Writing review and editing, validation, methodology, funding acquisition, conceptualization, supervision.
Ethical approval
All animal procedures related to blood collection were reviewed and approved by the Research Ethics Commission of the National Research and Innovation Agency (BRIN), Indonesia, under approval number 81/Klirens/X/2021.
Generative AI and AI assisted technology statement
The authors declare that no generative AI and AI assisted technology was used in the creation of this manuscript.
Conflict of interest
The authors have declared no conflict of interest.
Figures
Figure 1:.
Agarose gel electrophoresis of PCR products targeting two PLAG1 polymorphisms. A: PCR product targeting g.48308C>T SNP; B: PCR product targeting g.32212 (19 bp indel). M = 100 bp DNA ladder; lanes 1–4 represent PO cattle samples.
Figure 2:.
Genotypes of two PLAG1 polymorphisms. A: PCR-RFLP product targeting g.48308C>T SNP using the restriction enzyme SacII; B: Genotypes of g.32212 (19 bp indel). M = 100 bp DNA ladder; CC, CT and TT are genotypes of g.48308C>T SNP; DD and ID are genotypes of g.32212 (19 bp indel).
Figure 3:.
Pairwise linkage disequilibrium (LD) between the g.48308C>T SNP and the g.32212 (19 bp indel).
References
Azovtseva AI, Pozovnikova MV, Shcherbakov YS, Tulinova OV, Romanova EA, Ryabova AE (2024). Genome-wide association study for conformation traits in Ayrshire cattle. Anim. Sci. J., 95: e13985. https://doi.org/10.1111/asj.13985[CrossRef]
Barrett JC, Fry B, Maller J, Daly MJ (2005). Haploview: Analysis and visualization of LD and haplotype maps. Bioinformatics, 21: 263–265. https://doi.org/10.1093/bioinformatics/bth457[CrossRef]
Borges ERDS, Mota LF, Verardo LL, Albuquerque LGD, Duarte MR, Santos GC, Magalhães AF (2025). Weight gain and tenderness in Nelore cattle: Genetic association and a potential pleiotropic role of transcription factors and genes. Animals, 15: 2874. https://doi.org/10.3390/ani15192874[CrossRef]
BPS (2024). Peternakan dalam angka 2024. 1st edn. Badan Pusat Statistik, Jakarta, Indonesia.
Buchanan FC, Fitzsimmons CJ, Van Kessel AG, Thue TD, Winkelman-Sim DC, Schmutz SM (2002). Association of a missense mutation in the bovine leptin gene with carcass fat content and leptin mRNA levels. Genet. Sel. Evol., 34: 105–116. https://doi.org/10.1186/1297-9686-34-1-105[CrossRef]
Cahyadi M, Sukaryo S, Dhiaurridho MI, Bramastya TA, Yanti Y, Riyanto J, Volkandari SD, Sudrajad P (2022). Association of pleomorphic adenoma gene 1 with body weight and measurement of Bali cattle (Bos javanicus). Vet. World, 15: 782–788. https://doi.org/10.14202/vetworld.2022.782-788[CrossRef]
D’Occhio MJ, Campanile G, Baruselli PS, Porto Neto LR, Hayes BJ, Collins A, Fortes MRS (2024). Pleomorphic adenoma gene 1 in reproduction and implication for embryonic survival in cattle: A review. J. Anim. Sci., 102: skae103. https://doi.org/10.1093/jas/skae103[CrossRef]
Edwards BJ, Haynes C, Levenstien MA, Finch SJ, Gordon D (2005). Power and sample size calculations in the presence of phenotype errors for case/control genetic association studies. BMC Genet., 6: 18. https://doi.org/10.1186/1471-2156-6-18[CrossRef]
Engle BN, Hayes BJ (2022). Genetic variation in PLAG1 is associated with early fertility in Australian Brahman cattle. J. Anim. Sci., 100: skac084. https://doi.org/10.1093/jas/skac084[CrossRef]
Fink T, Tiplady K, Lopdell T, Johnson T, Snell RG, Spelman RJ, Littlejohn MD (2017). Functional confirmation of PLAG1 as the candidate causative gene underlying major pleiotropic effects on body weight and milk characteristics. Sci. Rep., 7(1): 44793. https://doi.org/10.1038/srep44793[CrossRef]
Fortes MRS, Lehnert SA, Bolormaa S, Reich C, Fordyce G, Corbet NJ, Whan V, Hawken RJ, Reverter A (2012). Finding genes for economically important traits: Brahman cattle puberty. Anim. Prod. Sci., 52: 143–150. https://doi.org/10.1071/AN11165[CrossRef]
Hartati H, Putra WPB, Mariyono M, Luthfi M, Affandhy L, Robba DK, Handiwirawan E, Irmawanti S, Aryogi A, Noor SM, Romjali E, Septian WA (2026). Novel associations of GSN indel and PLAG1 c.48333G>A variants with growth traits in mature Indonesian Madura and Bali cattle. J. Adv. Vet. Anim. Res., 13: 228–235. https://doi.org/10.5455/javar.2026.m1026[CrossRef]
Hou J, Qu K, Jia P, Hanif Q, Zhang J, Chen N, Dang R, Chen H, Huang B, Lei C (2020). A SNP in PLAG1 is associated with body height trait in Chinese cattle. Anim. Genet., 51: 87–90. https://doi.org/10.1111/age.12872[CrossRef]
Irma RS, Hilmia N, Sumantri C (2025). Association of c.974C>G mutation in growth differentiation factor 9 with recovery rate in Peranakan Ongole cattle. Adv. Anim. Vet. Sci., 13: 465–473. https://doi.org/10.17582/journal.aavs/2025/13.2.465.473[Full text][CrossRef]
Karim L, Takeda H, Lin LI, Druet T, Arias JA, Baurain D, Cambisano N, Davis SR, Farnir F, Grisart B, Harris BL (2011). Variants in PLAG1 are associated with stature and other growth traits in cattle. Nat. Genet., 43: 405–413. https://doi.org/10.1038/ng.814[CrossRef]
Kowalewska I, Czerniawska-Piatkowska E, Mlynek K, Andraszek K, Banaszewska D (2024). Detection of the rs109815800 and rs210941459 polymorphisms in the PLAG1 gene and their effect on growth traits in Limousin cattle. Anim. Sci. Genet., 20: 33–41. https://doi.org/10.5604/01.3001.0054.4562[CrossRef]
Lamido M, Alade NK, Kembe ND, Mukaddas J (2024). Marker assisted selection in livestock breeding: A review. Niger. J. Anim. Prod., 51: 113–116. https://doi.org/10.51791/njap.vi.7488[CrossRef]
Li S, Liu L, Ahmed Z, Wang F, Lei C, Sun F (2024). Identification of Heilongjiang crossbred beef cattle pedigrees and reveals functional genes related to economic traits based on whole-genome SNP data. Front. Genet., 15: 1435793. https://doi.org/10.3389/fgene.2024.1435793[CrossRef]
Li Z, Wu M, Zhao H, Fan L, Zhang Y, Yuan T, He S, Wang P, Zhang Y, Sun X, Wang S (2019). The PLAG1 mRNA expression analysis among genetic variants and relevance to growth traits in Chinese cattle. Anim. Biotechnol., 31: 504–511. https://doi.org/10.1080/10495398.2019.1632207[CrossRef]
Mia L, Mony SI, Maruf TM, Pabitra MH, Bhuiyan AKFH, Talukder KU, Motaleb MA, Bhuiyan MSA (2022). Detection of 19 bp indel of PLAG1 gene and its effects on morphometric traits in indigenous and crossbred cattle of Bangladesh. Bangladesh J. Anim. Sci., 51: 31–39. https://doi.org/10.3329/bjas.v51i1.58885[CrossRef]
Nei M, Kumar S (2000). Molecular evolution and phylogenetics. 1st edn. Oxford University Press, UK. https://doi.org/10.1093/oso/9780195135848.001.0001[CrossRef]
Putri RF, Widodo N, Suyadi S (2021). The potential of growth traits between Limousin and Ongole Crossbred (PO) cattle at Tuban, Indonesia. IOP Conf. Ser. Earth Environ. Sci., 788: 012024. https://doi.org/10.1088/1755-1315/788/1/012024[CrossRef]
Serdar CC, Cihan M, Yücel D, Serdar MA (2021). Sample size, power and effect size revisited: Simplified and practical approaches in pre-clinical, clinical and laboratory studies. Biochem. Med., 31: 010502. https://doi.org/10.11613/BM.2021.010502[CrossRef]
Song Y, Xu L, Chen Y, Zhang L, Gao H, Zhu B, Niu H, Zhang W, Xia J, Gao X, Li J (2016). Genome-wide association study reveals the PLAG1 gene for knuckle, biceps and shank weight in Simmental beef cattle. PLoS One, 11: e0168316. https://doi.org/10.1371/journal.pone.0168316[CrossRef]
Takasuga A (2016). PLAG1 and NCAPG–LCORL in livestock. Anim. Sci. J., 87: 159–167. https://doi.org/10.1111/asj.12417[CrossRef]
Trilaksono B, Rodhiyah AF, Yanti Y, Riyanto J, Kurniawan H, Imron M, Cahyadi M (2024). Body weight and measurement traits of Brahman cattle affected by pleomorphic adenoma gene 1 variations. Open Vet. J., 14: 3248–3256. https://doi.org/10.5455/OVJ.2024.v14.i12.10[CrossRef]
Wang J, Huang Y, Xu J, Yue B, Wen Y, Wang X, Lei C, Chen H (2022). Pleomorphic adenoma gene 1 (PLAG1) promotes proliferation and inhibits apoptosis of bovine primary myoblasts through the PI3K–Akt signaling pathway. J. Anim. Sci., 100: skac098. https://doi.org/10.1093/jas/skac098[CrossRef]
Wang Q, Wei Z, Zhu H, Pan C, Akhatayeva Z, Song X, Lan X (2023). Goat pleomorphic adenoma gene 1 (PLAG1): mRNA expression, CNV detection and associations with growth traits. Animals, 13: 2023. https://doi.org/10.3390/ani13122023[CrossRef]
Xu W, He H, Zheng L, Xu JW, Lei CZ, Zhang GM, Dang RH, Niu H, Qi XL, Chen H, Huang YZ (2018). Detection of 19-bp deletion within PLAG1 gene and its effect on growth traits in cattle. Gene, 675: 144–149. https://doi.org/10.1016/j.gene.2018.06.041[CrossRef]
Yu J, Naseem S, Park S, Hur S, Choi Y, Lee T, Li X, Choi S (2025). FASN, SCD, and PLAG1 gene polymorphism and association with carcass traits and fatty acid profile in Hanwoo cattle. Animals, 15: 897. https://doi.org/10.3390/ani15060897[CrossRef]
Zhong JL, Xu JW, Wang J, Wen YF, Niu H, Zheng L, Huang YZ (2019). A novel SNP of PLAG1 gene and its association with growth traits in Chinese cattle. Gene, 689: 166–171. https://doi.org/10.1016/j.gene.2018.12.018[CrossRef]
Zhou Z, Huang B, Lai Z, Li S, Wu F, Qu K, Jia Y, Hou J, Liu J, Lei C, Dang R (2019). The distribution characteristics of a 19 bp indel of the PLAG1 gene in Chinese cattle. Animals, 9: 1082. https://doi.org/10.3390/ani9121082[CrossRef]