South Asian Journal of Life Sciences


Research Article
South Asian Journal of Life Sciences 2 (2): 33 – 40Magnitude of Genetic Diversity of Fenugreek (Trigonilla foenum–gracum) Germplasm Based on Agronomic Traits and Biochemical Markers
Ihsan Ul Haq1, Hasnain Nangyal1, Gul Jan1, Shah Masaud Khan2, Sadiqullah1, Sikandar Khan Sherwani3, Rana Kausar4
- Department of Botany, Faculty of Life Sciences, Hazara University Khyber Pakhtoonkhwa Pakistan
- Department of Agriculture Haripur University Pakistan
- Department of Microbiology, FUUAST, Karachi, Pakistan
- Department of Biochemistry, FUUAST, Karachi, Pakistan
*Corresponding author:[email protected]
ARTICLE CITATION:
Ihsan ul Haq, Nangyal H, Jan G, Khan SM, Sadiqullah, Sherwani SK, Kausar R (2014). Magnitude of genetic diversity of fenugreek (trigonillafoenum–gracum) germplasm based on agronomic traits and biochemical markers. S. Asian J. Life Sci. 2 (2): 33 – 40.
Received: 2014–11–01, Revised: 2014–12–22, Accepted: 2014–12–23
The electronic version of this article is the complete one and can be found online at
(
http://dx.doi.org/10.14737/journal.sajls/2014/2.2.33.40
)
which permits unrestricted use, distribution, and reproduction in any medium, provided the original work is properly cited
ABSTRACT
The present study was aimed to evaluate the level of genetic diversity in germplasm of Fenugreek, to evaluate Fenugreek germplasm for Agro–morphological trait and SDS–PAGE and Estimation of genetic diversity in Trigonlla foenum–gracum germplasm to select elite genotypes for utilization in the breeding programs. In the preliminary study of genetic diversity in local germplasm evaluation of Trigonellafoenum greacum germplasm consisting of 55 accessions, was evaluated for qualitative and quantitative characters. For qualitative characters a significant in consistency was perceived for traits of plant, shape and types of plants. Correlation analysis for quantitative traits revealed that, significant correlations were observed for different characters for all accessions studied and the result could be implied in wider perspectives. In the current studies, Intraspecific variations was not high and it was evaluate that SDS–PAGE alone did not exihibit high level of intraspecific variations, as a result varied accessions depends on SDS–PAGE and recommended to be attained from alterations, preferably from centre of diversity to build a broad based gene pool with maximum variability. SDS–PAGE was conducted for 55 genotypes of the base of qualitative and quantitative traits. SDS–PAGE Marker proved to be valid biochemical technique for determining genetic diversity and variability. The grouping on the base of altitude, crop ecological zones and physio geo–graphical regions of Pakistan could not prove its worth for the present Trigonella foenumgreacum used. Further, cluster analysis showed that the breeders or transport of grains to different markets from where the seed of various is disseminated throughout the country grouped many accessions from same origin separately that may be because of frequent exchange of germplasm.
INTRODUCTION
The genus Trigonella is one of the largest genera of the tribe Trifoliatae in the family Fabaceae and sub–family Papilionaceae (Polhil and Raven 1981). Trigonella, has yellowishwhite flowers. The species epithet foenum–graecum means ‘Greek hay’ and due to the appearance of their two seed pods arise from the stem in opposite direction that resemble horn of ox or goat, it is also called ‘ox horn’ or ‘goat horn’ (Mehrafarin et al., 2010). Among Trigonellaspecies, Trigonellafoenum–graecum commonly known as fenugreek is an annual plant, with autogamous white flowers and it is occasionally visited by insects. It is indigenous to countries on the eastern shores of Mediterranean; fenugreek is widely cultivated in Pakistan, China, India, Egypt, Ethiopia, and Morocco and occasionally in England (Rajagopalan 2001). It is well known for its pungent aromatic properties (Max, 1992).
According to ancient medicinal system, it is an herbal drug that is bitter or pungent in taste. It is effective against anorexia and is a gastric stimulant (Balodi and Rao 1991). Fenugreek is becoming popular around the world with its extract used to flavour cheese in Switzerland, artificial maple syrup and bitter–run in Germany, roasted seeds as coffee–substitute in Africa, seed powder mixed with flour as fortification to make flat–bread in Egypt, as an anti–diabetic herb in Israil, whole seed and dried plant used as insect and pest repellent in grain storage, and oil used in perfumery in France (Rajagopalan MS., 1998) and is often used to add flavour in Malaysian homes (Perry, 1980). Fenugreek seeds mixed with yogurt are used as a conditioner for hair. Seeds are used for making oily pickles in South Asia. Galactagogue in fenugreek seeds are used to increase milk supply in lactating women (Chantry et al., 2004). Fenugreek seeds also contain high level of iron and phosphorus and are used as insect and pest repellent in grain storage (Billaud and Adrian, 2001). Research reports have indicated that fenugreek can be a remedy to diabetes by lowering blood sugar and cholesterol level and partially restore the activities of key enzymes of carbohydrate and lipid metabolism close to normal values (Basch et al., 2003; Srinivasan, 2006). In unani systems of medicine, fenugreek is used for treatment of epilepsy, paralysis, gout, dropsy, chronic cough and piles (Bin–Hafeez et al., 2003).
Fenugreek seed contains 45–60% carbohydrates, mainly mucilaginous fiber (galactomannans), 20–30% proteins high in lysine and tryptophan, 5 – 10% fixed oils (lipids), pyridine alkaloids, mainly trigonelline (0.2 – 0.38%), choline (0.5%), gentianine and carpaine, the flavonoids apigenin, luteolin, orientin, quercetin, vitexin and isovitexin, free amino acids, such as 4–hydroxyisoleucine (0.09%), arginine, histidine and lysine, calcium and iron, saponins (0.6 – 1.7%), glycosides yielding steroidal sapogenins on hydrolysis (diosgenin, yamogenin, tigogenin, neotigogenin), cholesterol and sitosterol, vitamins A, B1, C and nicotinic acid and 0.015% volatile oils ‘n–alkanes’ and ‘sesquiterpenes’ (Budavari, 1996; Newall et al., 1996; Mehrafarin et al., 2011). Its green leaves are rich in protein, minerals and vitamin C. (Qureshi et al., 2009).
Biochemical technique is the application of the tools and concepts of chemistry to living systems. Characterization of germplasm using biochemical techniques (fingerprinting) has received attention because of the increase recognition of germplasm resources in crop improvement and in selection of desirable genotypes to be used in breeding programmes. Genetic markers are useful for screening germplasm with the minimum cost and labour. Seed protein patterns obtained by electrophoresis have been successfully used to resolve the taxonomic and evolutionary relationships among crops and their wild relatives (Rao et al., 1992). They can also be used distinguishing cultivars of particular species (Jha and Ohri, 1996). Sodium Dodecyl SulphatPolyacrelamide Gel Eletrophoresis(SDS–PAGE) is widely used due to its reliability and simplicity in describing the genetic structure of crop germplasm (Murphy et al., 1990; Ghafoor et al., 2002; Sultana et al., 2005; Nisar et al., 2008).
Aims and Purposes of the Study
To assess the level of genetic diversity in Fenugreek germplasm.
To evaluate Fenugreek germplasm for Agro–morphological trait and SDS–PAGE.
Estimation of genetic diversity in Fenugreek germplasm to select elite genotypes for utilization in the breeding programs.
MATERIALS AND METHODS
The study was accompanied at National Agriculture Research Center, Islamabad, Pakistan. Seeds of 55 genotypesof Trigonella (Trigonellafoenumgraecum) were collected from various agro–ecologicalzones of Pakistan including K.P.K, Punjab, Sindh and Baluchistan according to the quadratemethod. The current study was initiatedto investigate the potential electrophoresisfor intra specific characterizationof Trigonellaon the basis of their total seedprotein and explore various agronomic traitsamong 55 genotypes of Trigonella. The acquired germplasm was planted at field using augmented design keeping the row to row spacing of (30 cm), data was recorded on some quantitative and qualitative traits of the crop. The quantitative aspects will include days to (50%) flowering, Height of plant, Number of branches per plant, Number of pods per plant, Pods length, Pod width, Number of seed per pod, Seed yield per plant, Seed yield per row, biomass per plant and biomass per row. Qualitative traits including Plant type and plant habit. Harvest Index will be calculated as percentage of seed yield and biomass.
For extraction of proteins, several seed will be ground to fine powder with mortar and pestle. Sample buffer (400µl) will be added to 0.01g seed powder as extraction liquid and mixed thoroughly in an appendorf tube with a small rod. The extraction buffer will contain the following final concentrations: 0.5 M Tris–HCl (pH 6.8), 2.5% SDS, 10% glycerol and 5% 2–mercoptoethanol. Bromophenol Blue (BPB) will be added to sample buffer as tracking dye to monitor the movement of protein in the gel. Seed protein will be analyzed through slab–type SDS–PAGE using 12.25% polyacralamide gel measuring 7×9cm. Two separate gels will be run under similar electrophoresis conditions in order to check the reproducibility of the method. The molecular weights of the dissociated polypeptide will be determined using molecular weight protein standerds (MW–SDS–70kit, Sigma, U.S.A.). SDS–PAGE of total seed protein will be carried out in a discontinuous buffer system according to the method of (Laemmli 1970; Cheema et al., 2010). The gels will be stained with Coomassie Brilliant Blu (CBB) and then distained till the background become transparent (Masood et al., 2003). Similarity indices of 55 genotypes were calculated for all possible pairs of protein types and were used to construct dendrogram by the UPGMA (Nisar et al., 2008) by computer software STATISTICA vir–6.0. The binary data matrix was analyzed for cluster analysis calculates the genetic diversity and genetic homology.
RESULTS AND DISCUSSION
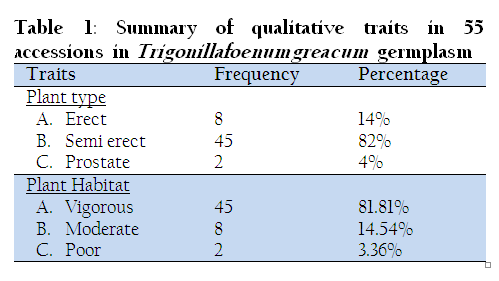
For qualitative characters a considerable level of variability was observed for 55 accessions of fenugreek germplasm. In the present study semi erect plant type (81%) was dominant characters as compared to erect and prostrate. In plant habit accessions were also varied from each other. Qualitative characters are important for plant description (Kurlovich, 1998) and are mainly influenced by the consumer’s preference, socio–economic scenario and natural selection. In the present study mature pods were green and light green tips. The mature pods were cream colored, spotted cream colored and brown spotted green. These characters were influenced by environmental stress.
Study of Genetic Diversity Based on Quantitative Traits
Data of 10 quantitative traits i.e. days to 50% flowering, plant height, number of branch/plant, number of pods/plant, pod width, pod length, total biomass, total seed yield, 100 seed weight and harvest index were recorded. Harvest Index of 55 germplasms was calculated from percentage of seed yield and biomass. The results of these quantitative traits were described below.
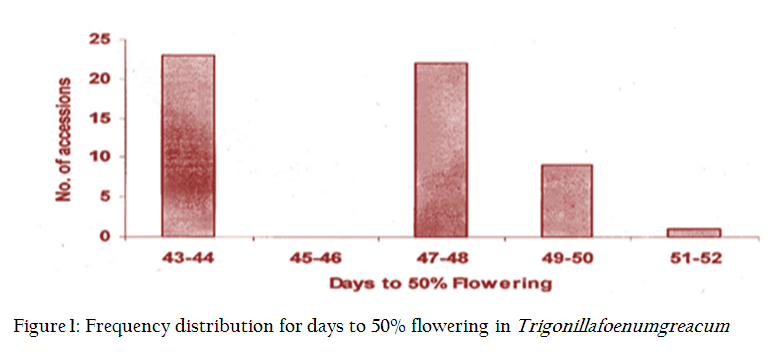
Days to 50% flowering of 55 different accessions were studied; days to 50% flowering varied from 43–51 with mean value of 46.25±. Standard error (0.31) and standard deviation (2.32) was also calculated (Table 2, Figure 1).
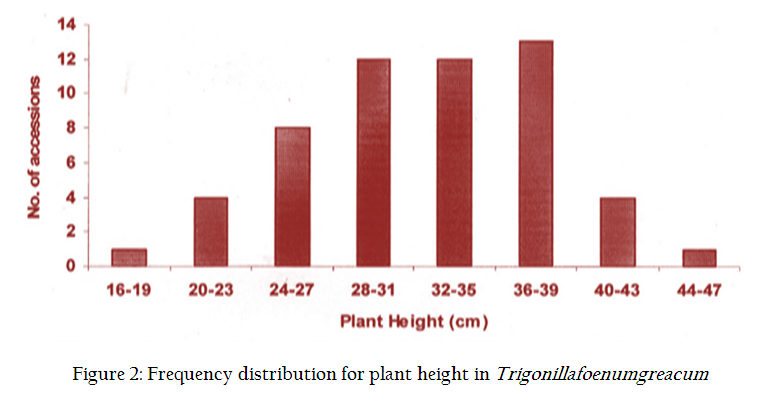
Plant height of 55 accessions were ranged from 16.6cm to 48.2cm with mean value of 32.95± having standard error 0.84 and standard deviation 6.26 (Table 2).
Number of branches/plant of 55 different accessions were studied, it was ranged from 2–11 with mean value of 4.95±, having standard error (SE) 0.27 and standard deviation 1.98 (Table 2).
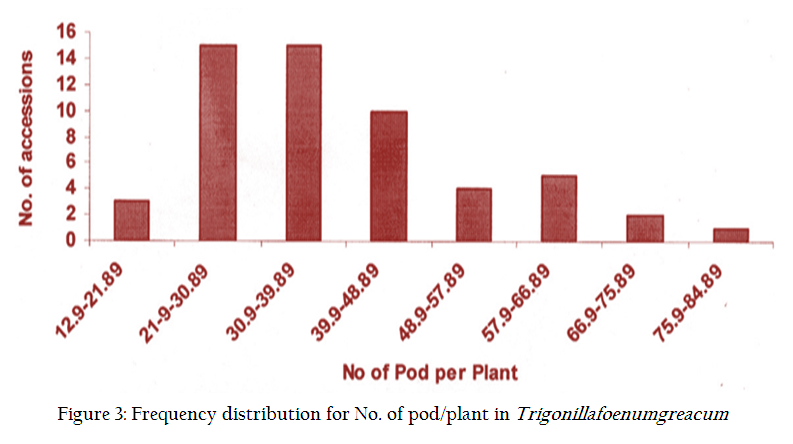
Numbers of pods/plant of 55 different accessions were ranged from 15 to 82 with mean of 39.88±. Standard error (1.96) and standard deviation (14.54) was also recorded (Table 2).
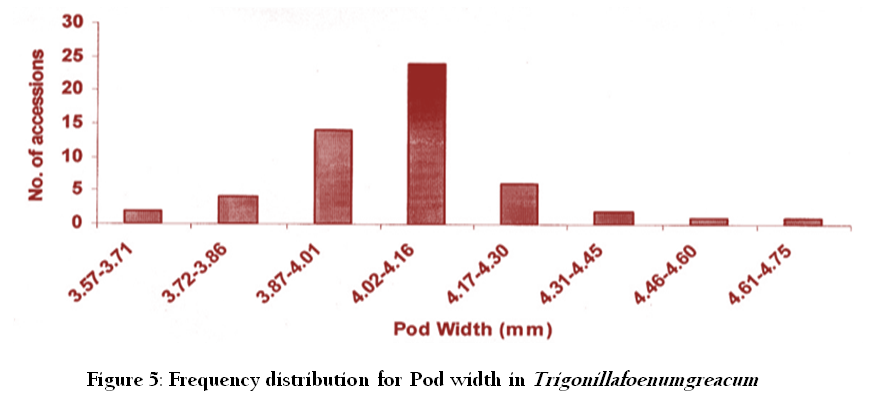
The pod widths of 55 different accessions of fenugreek were studied. Pod width were ranged from 3.57mm to 4.76mm with mean of 4.07±, having standard error 0.03 and standard deviation 0.21 (Table 2).
Pod length was calculated in fenugreek accessions which range from 9.48cm to 31.8cm with mean valve of 12.01±. Standard error (0.38) and standard deviation (2.83) was also calculated (Table 2).
Total biomass of 55 different accessions were studied, it was ranged from 722.30–4353.69g with mean value of 2678.63±.standerd error (SE) was found 105.98 and standard deviation 785.98 (Table 2).
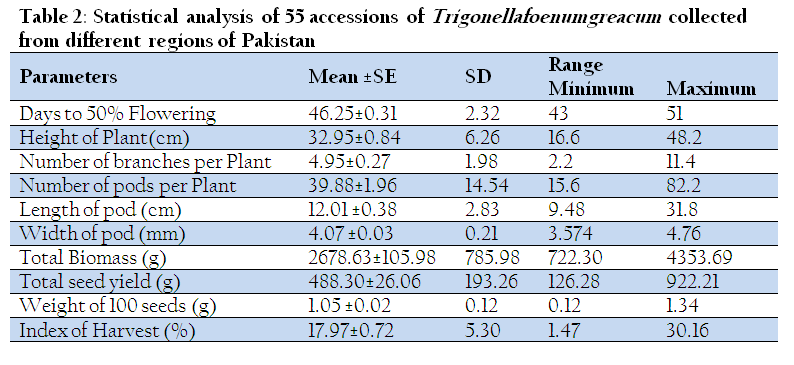
Table 2: Statistical analysis of 55 accessions of Trigonellafoenumgreacum collected from different regions of Pakistan
In different 55 accessions of fenugreek, the total seed yield were studied it were range from 126.3g to 922.2g with mean valve of 488.30±. Having standard error 26.06 and standard deviation 193.26 (Table 2).
100 seed weight of 55 different accessions were studied, it was ranged from 0.82–1.34g with mean value of 1.05±. Standard error (SE) was measured as 0.02 and standard deviation was 0.12 (Table 2).
Harvest index in different 55 accessions of fenugreek were studied, it were ranged from 1.47% to 30.16% with mean valve of 17.97±, having standard error 0.72 and standard deviation 5.30 (Table 2).
A wide range of variability was observed in number of branches, plant height, biological yield bearing characters are found to be suitable for selection of high yielding lines, these lines can be used in hybridization programs. (Sharma and Mishra, 1997 and Rewale et al., 1996) reported that days to 50% flowering, plant height and harvest index contributed the most towards genetic divergence. In the present findings low variance was observed for 100 seed weight (0.01), and high to moderate variance was found in seed yield /plant (3.4), number of branches (3.94) and days to 50% flowering (5.38), number of Pod/plant (211.40), plant height (39.16), seed yield (37462.39) and biological yield (621022.05) (Kole and Mishra 2006) found, High to moderate values of genotypic and phenotypic coefficients of variation were observed in branches per plant, pods per plant, seed per pod, 100–seed weight, pod weight, husk weight, straw yield, biological yield and grain yield per plant. The characters with low genetic variance needed to be improved by acquiring germplasm from other sources using breeding techniques like wide hybridization or mutation. Numbers of branches were strongly associated with yield which was also supported by (Mehta and Zaveri, 1999).
Frequency Distribution Forquantitative Characters
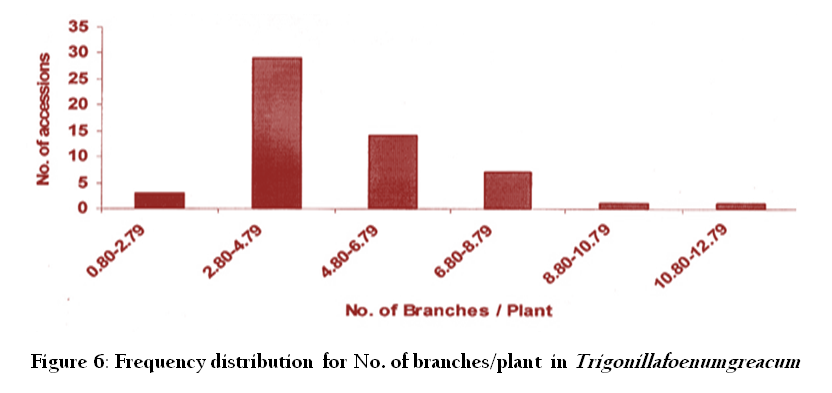
These characters, days to 50% flowering, days to maturity, biological yield and harvest index showed highest contribution to the yield of Trigonellafoenum greacum. These traits are recommended for feature evaluation and breeding programs. Whereas the characters, seed yield 37462.39, 100–sw 0.01of variance also needs to be improved. Number of Branches, pod length, showed variance 3.94, 8.03, respectively. These selected lines suggested to be used in hybridization program to improve the yield potential of fenugreek. Frequency distribution for quantitative characters (Figure 1 – 6) showed that frequency distribution of 50% flowering in Trigonella foenum graecum showed that 23 accessions (40%) were present in the range of 47–48 days after planting proved to be early 50% flowering and maturity, and 1 accession in the range of 51–52 days. For plant height maximum, 13 accessions (23.63%) were in the range from 36–39cm, 12 accessions (21.81%) were in the range from 28–31cm, where 12 accessions (21.81%) were in the frequency range of 32.35cm, this shows that most of the accessions occur from 36–39cm. 8 accessions (14.545%) were in the range of 24–27cm, 4 accessions (7.272%) were in range of 20–23cm, 5 accessions (9.09%) where in the range of 40–43cm, which is the maximum height range observed from all of the rest accessions, 2 accessions (3.63%) in the range of 16–19cm which indicated the lowest height range (Figure 2).Frequency distribution for number of branches showed that maximum number of accession (50%) in the range of 2.80–4.79, 14 accessions (25.45%) in the range of 4.802–6.79, 6 accessions (10.90%) in the range of 6.80–8.79, 3 accessions (5.45%) in the range of 0.80–2.79, and 2 accessions (3.63%) each in the range of 8.80–10.79, and 10.80–12.79. respectively as shown in (Figure 6) .This indicated that highest numbers of branches are found in accession 22.73 which have 11.4 numbers of branches from Pashin, Baluchistan and accession number 021521 containing 10.6 branches per plant from D.G Khan, Punjab. One of the approaches to increase the grain yield in fenugreek germplasm could be the selection for high branch number to increase productivity.frequency distribution For number of pods/plant showed that maximum 15 accessions (27.27%) each ranged from 21.8–30.80 and 30.8–39.80 pods per plant, respectively, 9 accessions (16.36%) were ranged from 39.8–48.80, 5 accessions (3.63%) in the range of 66.92–75.80, while 1 accessions (1.80%) in the range of 75.8–84.89, as shown in the (Figure 3). The maximum pods possess indicated in the range of 75.8–84.89 which is one and that is 22073 from indicated in the range of 75.8–84.89 which is one and that is 22.73 from Pashin Baluchistan which could be exploited for improving this trait. Showed (Datta et al., 2005) that the number of pods per plant had the highest direct effects on seed yield. For frequency distribution of pod width (mm) maximum 25 accessions (45.45%) were found in the range of 40.02–4.18 mm followed by 14 accessions (25.45%) ranged from 3.87–4.01, six accessions (10.90%) were in the range of 4.17–4.45, four genotypes (7.27%) ranged from 3.57–3.71mm and 4.31–4.45 respectively and one (1.81%) accession each in the range of 4.48–4.45 and 4.81–4.78, respectively, as shown in (Figure 5). The maximum pod width 4.76mm observed for accession number 020626 from Narowal Punjab.
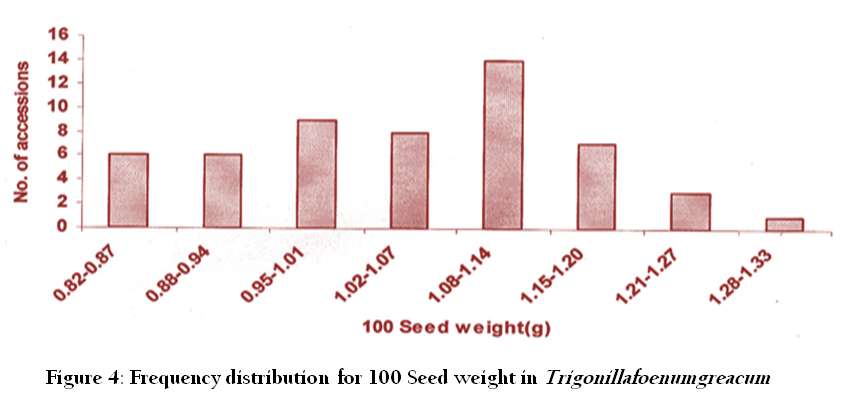
For 100 seed weight (gm) frequency distribution of maximum numbers, 14 genotypes (25%) ranged from 0.98–1.014, 9 accessions (16.63%) ranged from 0.98–1.01cm, 8 accessions (14.54%) ranged 1.02–1.20, 6 accessions (10.90%) each ranged from 0.82–0.87 and 0.88–0.94, respectively, 3 accessions (5.45%) were in the range of 1.21–1.27 and 1 accession (1.81%) in the range of 1.28–1,83 as shown in (Figure 4).The highest one recorded for the 100 seed weight gm were 021256 of 1.343gm origin from Jhang Punjab.
Correlation Studies
The correlation coefficients were computed among quantitative traits. Different combinations of correlation were studied between plant traits. Data presented in Table–5 show the extent of correlation among various parameters studied. Plant height was found to be in significant negative association with No. of Branches per plant, No. of pods per plant and 100 seed weight whereas, it has positive highly significant correlation with biomass. And positive correlation with pod width pod length and total seed yield. Plant height found positive correlation with total seed yield plant height was the most important traits which directly or indirectly influence seed yield (Kailash et al., 2000 and Balai et al., 2006).
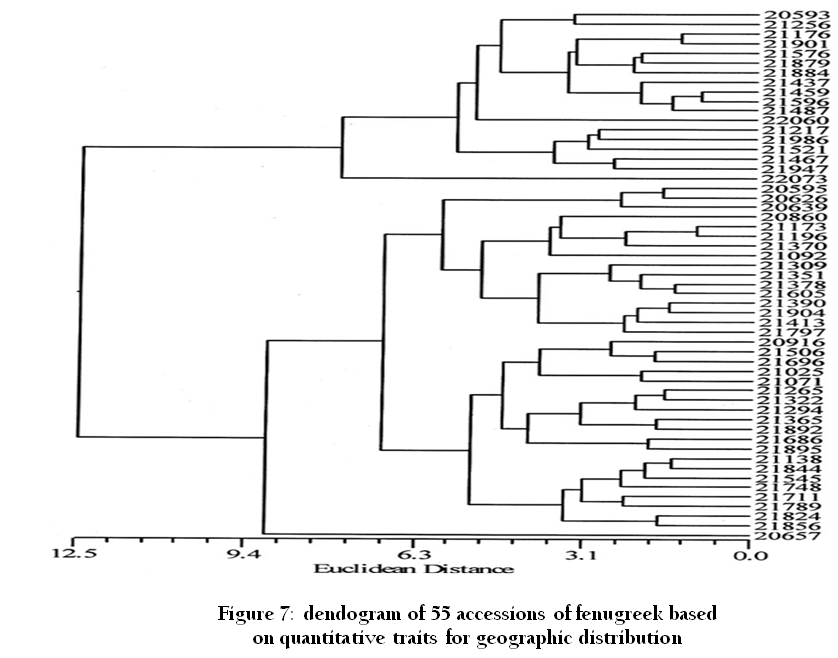
Figure 7: dendogram of 55 accessions of fenugreek based on quantitative traits for geographic distribution

Figure 8: Dendogram of 55 accessions of fenugreek of protein bands based on SDS–PAGE marker of geographical distribution pattern
No. of Branches was found in highly significant correlation with No. of pods per plant and positive correlation with 50% flowering and negatively in significant correlation with biomass while negative correlation with all other characters.
No. of pods per plant were negatively in significant correlation with biomass. Pods length was found to be in significant correlation with harvest index. Pod width was in significant positive association with biomass.
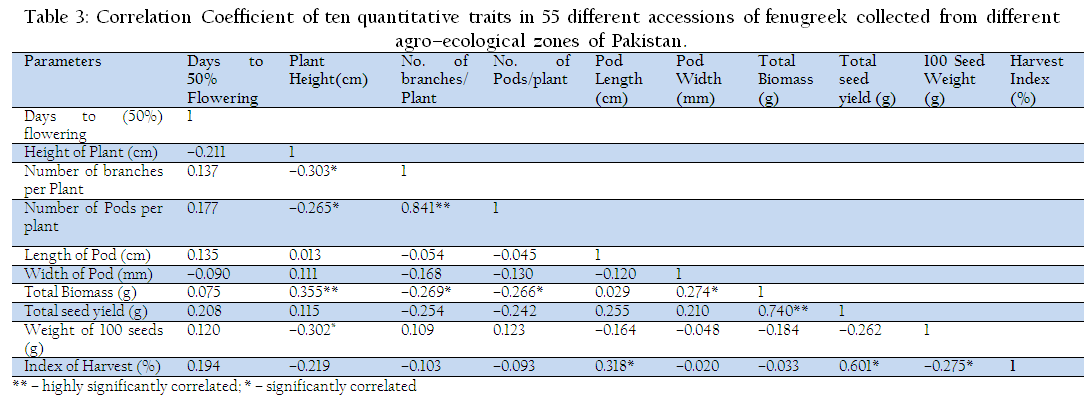
Table 3: Correlation Coefficient of ten quantitative traits in 55 different accessions of fenugreek collected from different agro–ecological zones of Pakistan
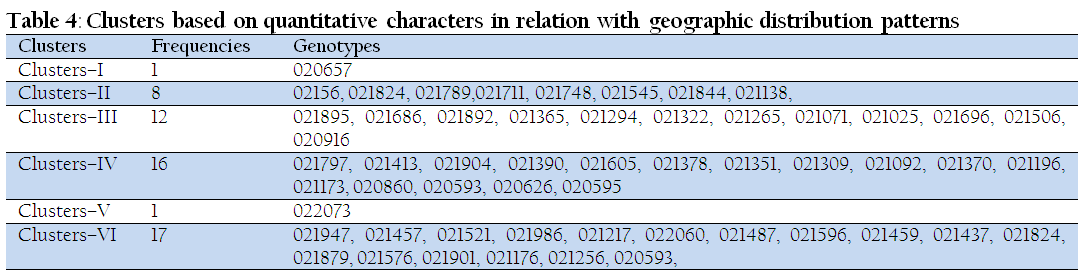
Table 4: Clusters based on quantitative characters in relation with geographic distribution patterns
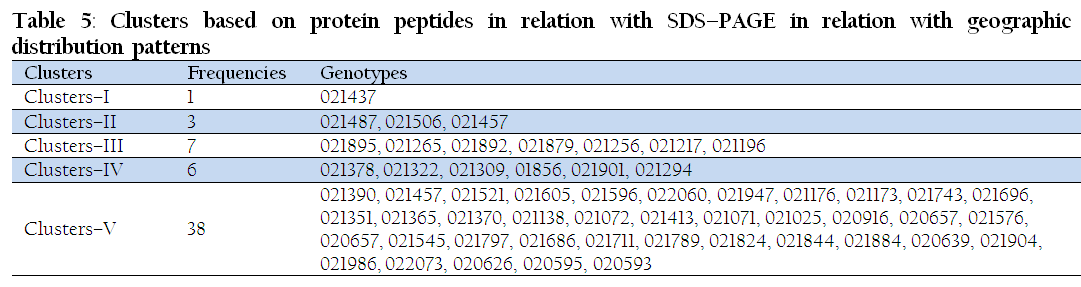
Table 5: Clusters based on protein peptides in relation with SDS–PAGE in relation with geographic distribution patterns
Seed yield was in significant positive correlation with 50% flowering plant height, pod length, biomass and harvest index these results were also observed by (Saha et al., 2001) who suggest that the genotypic and phenotypic correlations of days of flowering, plant height, pods per plant, pod length, grains per pod, straw yield, biological yield and harvest index with grain yield per plant were significant and positive indicating the importance of these character in seed yield improvement. Whereas, 100 seed weight was in negative significant correlation with harvest index. Days to 50% flowering shows high positive significance association with number of branches per plant, number of pods per plant, pod length, total biomass total seed yield, hundred seed weight and harvest index and was negatively associated with plant height and pod width. Grain yield was positively correlated with branches per plant, shelling per cent and harvest index at both phenotypic and genotypic levels (Ananya and Kole, 2004; Abhay et al., 2011).
Harvest index was positively associated with days to 50% flowering which indicated that economic yield is dependent of days to 50% flowerings (Table 3).
Geographical Distribution Patterns Based on Cluster Analysis
Trigonellafoenumgreacum collected from different regions from all provinces of Pakistan (Punjab, Baluchistan, KPK and Sind) analyzed by using cluster analysis (Ananya and Kole 2004), on the basis of geographical distribution patterns. Accessions from Punjab revealed maximum polymorphism accept from Layyah. The lowest degree of polymorphism was observed from Mansehra, Baluchistan, the low level of variability observed might be due to lesser representation of material from these areas. Therefore it is suggested that more expedition may arrange from those regions to capture the maximum variability as shown in (Table 4 and Figure 7)
Genetic Diversity Based on Biochemical (SDS–PAGE) Analysis
SDS–PAGE analysis was conducted in various combinations and it was revealed that 12.25 acrelamide gel concentration, 6 micro litre of simple gave the best resolution. In total 22 protein bands were recorded ranging from 10–220 kd. Many protein subunits of lower molecular weight were also observed but due to inconsistency in reproducibility they were not recorded. Variation observed in density and sharpness of a few bands but this was not taken in consideration. Only polymorphic band were included in consideration in cluster analysis and constructing of dendogram. Total 55 accessions were used to construct dendogram based on SDS–PAGE. On the basis of banding pattern, gel was divided in to three regions. Region 1 has 6 bands more than 80 kd MV. Region 2 has 8 bands ranging from 30–80 kd and region 3 has 7 bands ranging from 10–30 kd. The result obtained after SDS–PAGE showed that the method provided a powerful tool for reliable germplasm discrimination based on genetic differences in seed storage protein comparison. The molecular marker used in this gel was bench marker TM ladder (invetrogen) result shown in (Table 5 and Figure 8).
Genetic diversity on the bases of SDS–PAGE and agronomic characters in the present study indicated the worth in examining the centre of genetic diversity in Trigonellafoenumgreacium (fenugreek) using SDS–PAGE and other biochemical markers. According to (Perry and McIntosh, 1991), differentiation according to geographical regions of origin is useful in substantiating the postulated regions of diversity of gene centers. Further cluster analysis showed that many accessions from the same origins were grouped separately that may be because of frequent exchange of germplasm by the breeders of transport of grain to different markets from where the seed of various origins is disseminated through out the county. (Smith et al., 1995) Linkage cluster and PCA are useful for preservation and utilization of germplasm.
Cluster analysis proved that their validity to establish genetic diversity, and these statistics on the bases of quantitative characters revealed more reliability than SDS–PAGE. No. geographic relationship was found in any case
REFERENCES
Abhay Dashora, Maloo SR, Dashora LK (2011). Variability, correlation and path coefficient analysis in fenugreek (Trigonellafoenum– graecum L.) under water limited conditions. J. Spices Arom Crops. 20 (1): 38 – 42.
Ananya B, Kole PC (2004). Genetic variability, correlation and path analysis in fenugreek (Trigonellafoenumgraecum L.). J. Spices Arom. Crops. 13: 44 – 48.
Balai OP, Singh D, Jain UK (2006). Genetic variation and character association among yield and yield related traits in Fenugreek. Indian J. Agric. Res. 40 (2): 143 – 146.
Balodi B, Rao RR (1991). The genus Trigonella L. (Fabaceae) in the Northwest Himalaya. J. Econ. Ta. But.5: 11 – 16.
Basch E, Ulbricht C, Kuo G, Szapary P, Smith M (2003). Therapeutic applications of fenugreek. Altern. Med. Rev. 8: 20 – 27.
PMid:12611558
Billaud C, Adrian J (2001). Fenugreek composition, nutritional value and Physiological properties. Sci. Aliments, 21: 3 – 26.
http://dx.doi.org/10.3166/sda.21.3-26
Bin–Hafeez B, Haque R, Parvez S, Pandey S, Sayeed I, Raisuddin S (2003). Immunomodulatory effects of fenugreek (Trigonellafoenum–graecumL.) extract in mice. Int. Immunpharmacol. 3: 257 – 265.
http://dx.doi.org/10.1016/S1567-5769(02)00292-8
Budavari S (1996). The merck index: An encyclopedia of chemicals, drugs, and biologicals, 12th ed.
Chantry CJ, Howard CR, Montgomery A, Wight, N. (2004). Use of glactogogues in initiating or augmenting maternal milk supply. The academy of breast feeding medicine.
Cheema NM, Malik MA, Qadir G, Rabbani MA (2010). Characterization of castor bean genotypes under various environments using SDS–PAGE of total seed storage proteins. Pakistan J. Bot. 42 (3):1797 – 1805.
Ghafoor A, Sharif A, Ahmad Z, Zahid MA, Rabbani MA (2002). Genetic relationship in Vigna mango (L.) Hepper and V.radiate (L) R. Wileczek based on morphological traits and SDS–PAGE. Euphytica. 123: 3378 – 382.
http://dx.doi.org/10.1023/A:1015092502466
Jha SS, Ohri D (1996). Phylogenetic relationships of Cajanuscajan (L.) Millsp. (pigeonpea) and its wild realtives based on seed profiles.J. genetic resourses crop evalvation. 43: 275 – 281.
Kailash C, Divakara Sastry EV, Singh D (2000). Genetic variation and character association of seed yield and its component charactersinFenugreek. Agric. Sci. Digest, 20 (2): 93 – 95.
Kole PC, Mishra AK (2006). Pattern of variability and correlation in fenugreek. Inidan. Agric. 50: 93 – 96.
Kole PC, Saha, A. (2013). Correlation co–efficients of component characters with seed yield and their direct effects in path analysis in fenugreek grown under six environments. J.horti and Forestry. 5(1): pp. 17 – 20.
Kurlovich (1998). Species and interspecific diversity of white, blue and yellow lupins.J. plant resources and genetics. 115: 23 – 32.
Laemmli UK (1970). Cleavage of structural proteins during the assembly of the head of bacteriopage T4. 227: 680 – 685.
Masood SA, Ghafoor, Javaid A (2003). Laboratory manual charactirization and evaluation of plant genetic resources. J. plant resource and genetics.23-32
Max B (1992). This and that: the essential pharmacology of herbs and spices. Trends Pharmacol. Sci. 13: 15 – 20.
http://dx.doi.org/10.1016/0165-6147(92)90010-4
Mehrafarin A, Qaderi, A. Rezazadeh, S. Badi, H. N. Noormohammadi, G. and Zand, E. (2010). Bioengineering of important secondary metabolites and metabolic pathways in Fenugreek (Trigonellafoenumgraecum L.). J. Medicinal Pl. 9 (35): 1 – 18.
Mehrafarin A, RezazadehSh, NaghdiBadi H, NoormohammadiGh, Zand E, Qaderi A (2011). A Review on Biology, Cultivation and Biotechnology of Fenugreek (Trigonellafoenum–graecumL.) as a Valuable Medicinal Plant and Multipurpose. J.plant genetics.10 (37): 6 – 24
Mehta, Zaveri PP (1999). Genetic variability and association analysis in F5 generation resulted from 3 selection scheme in cowpea. J.MaharashtraAgri. 23: 238 – 240.
Murphy RW, Sites JW, Buth, DG, Haufler CH (1990). isozyms electrophoresis. In: Hillis Dh, Moritz C [eds], Molecular systematics, 45 – 126.Sinaur Association, Sunderland, MA.
Nakajima K (1994). Biotechnology for crop improvement and production in Japan. Biotechnology applications in agriculture in Asia and Pacific, 87 – 107. Published by Asian Productivety Organization.
Newall CA, Anderson LA, Phillipson JD (1996).J. herbal medicine.
Nisar M, Ghafoor A, Ahmad H, Khan MR, Qureshi AS, Ali H, Aslam M (2008). Evaluation of genetic diversity of pea germplasm through phenotypic trait analysis. Pak. J. Bot. 40(5): 2081 – 2086.
Perry LM (1980). Medicinal plants of East and South East Asia: Attributed properties and uses. Cambridge: MIT Press.
Perry MC, Mcintosh MS (1991). Geographical patterns of variation in the USDA soybean germplasm collections. I. Morphological traits. Crop Science. 31: 1350 – 1355.
http://dx.doi.org/10.2135/cropsci1991.0011183X003100050055x
http://dx.doi.org/10.2135/cropsci1991.0011183X003100050054x
Polhil RM, Raven PH (1981).J.plant pharm
Qureshi SN, Anwar R, Kashif M, Ghafoor A (2009). Evaluation of winter vegetables for Genetic Divergence and Characterization of genotypes. Pak. J. Bot. 41(3): 1117 – 1126.
Rajagopalan MS (2001). Fenugreek savory Medicinal. Supplement industry Executive. 5(6): 43 – 44.
Rajagopolan MS (1998). Fenugreek, what this herb can offer? Naturally, 1:1 – 4.
Rao R, Vaglio. M. Del, Paino. M, Urzo. D Monti.L.,andVaglio, M Del. (1992). Identification of Vignaspp, thruoghspecefic seed storage polypeptides. Euphytica. 62: 39 – 43.
http://dx.doi.org/10.1007/BF00036085
Rewale AP, Birari SP, Apte UB (1996). Genetic divergence in cowpea [Vignaunguiculata(L.) Walp.]. Indian. J. Agric. Res. 30 (2): 73 – 79.
Saha T, Majumdar S, Banerjee NS, Sen SK (2001). J.plant pharm
Sharma TR, Mishra SN (1997). Genetic divergence and character association studies in cowpea. Crop Res. Hissar. 13: 109 – 114.
Smith SE, Guarino L, Conta DM (1995). Morphological and agronomic affinities among Middle Eastern alfalfas accessions from Oman and Yemen. Crop. Sci. 35: 1118 – 1194.
Sultana T, Ghafoor A, Ashraf M (2005). Genetic divergence in lentil germplasm for botanical descriptors in relation with geographic origin.J.Pak Botany.