South Asian Journal of Life Sciences


Research Article

Effect of Protein Rate on the Growth, Feed Efficiency and Composition of Hoplobatrachus Occipitalis (Günther, 1858) Tadpoles’ Carcass in Controlled Medium
Théophile Godome1,2*, Dogbè Clément Adjahouinou1, DS. Juste Vital Vodounnou1, Nahoua Issa Ouattara2, Emile Didier Fiogbe1
1Laboratory of Research on Wetlands, Department of Zoology, Faculty of Sciences and Techniques, University of Abomey-Calavi, BP: 526 Cotonou (Benin); 2Laboratory of Hydrobiology, UFR Biosciences, University Félix Houphouet-Boigny, 22 BP: 582 Abidjan 22, (Ivory Coast).
Abstract | The current study aims at evaluating the effect of experimental feed protein rate on growth and feed utilization in Hoplobatrachus occipitalis tadpoles. Six same-energy feed diets containing crescent protein rates (20, 30, 40, 45, 50 and 60 %) were formulated and tested on Hoplobatrachus occipitalis tadpoles though initial mean weight was 0.380 ± 0.004 g. Each diet was tested in triplicate for 24 days. 55 tadpoles was stocked per pond containing 30L water. Survival rates recorded ranged between 85.454 and 92.727% for all treatments. Growth and feed utilization parameters varied significantly with feed protein rate (P < 0.05). The best growth performances were recorded with 60% protein diet. According to the mathematical model (polynomial regression II) used for analysis of specific growth rate variations in relation to feed protein rate, optimal and maximal protein needs of Hoplobatrachus occipitalis tadpoles are 33 and 51% respectively. The highest protein rate of tadpoles’ carcass was noticed in tadpoles fed on 45% protein diet. The highest rate of lipid and dry matter was observed in tadpoles fed on 50% protein feed. The optimum and maximum protein requirements for better growth of H. occipitalis tadpoles are 38.30% and 54.10%, respectively.
Keywords: Hoplobatrachus occipitalis, Tadpoles, Protein rate, Same-energy feed diet, Survival rates.
Editor | Muhammad Nauman Zahid, Quality Operations Laboratory, University of Veterinary and Animal Sciences, Lahore, Pakistan.
Received | January 02, 2019 Accepted | February 22, 2019; Published | March 10, 2019
*Correspondence | Theophile Godome, Laboratory of Research on Wetlands, Department of Zoology, Faculty of Sciences and Techniques, University of Abomey-Calavi, BP: 526 Cotonou (Benin); Email: [email protected]
Citation | Godome T, Adjahouinou DC, Vodounno (2019). Effect of protein rate on the growth, feed efficiency and composition of Hoplobatrachus occipitalis (Günther, 1858) tadpoles’ carcass in controlled medium. S. Asian J. Life Sci. 7(1): 1-7.
DOI | http://dx.doi.org/10.17582/journal.sajls/2019/7.1.1.7
ISSN | 2311–0589
Copyright © 2019 Godome et al. This is an open access article distributed under the Creative Commons Attribution License, which permits unrestricted use, distribution, and reproduction in any medium, provided the original work is properly cited.
INTRODUCTION
Feeding is the most important trouble encountered in commercial frog rearing. Its implementation depends on the three development stages of frog namely tadpoles, bulbous crowfoot and adult frogs (Cairns, 1967; Hirschfeld, 1970). Tadpole is generally fed on Artemia, boiled egg yolk, boiled fish, rice bran or vapour boiled egg (Prapee et al., 1997). The best feed for bulbous crowfoot are tadpoles, fishes and crayfish (Priddy and Culley, 1971) while the feed of adult frogs is preferably insects (Prapee et al., 1997). However, fish pelleted feed are also good for frog growth (Prapee et al., 1997). Considering the worldwide increasing of frog meat demand and the drastic decrease of natural stock, frog rearing has been initiated these latter years (Crumlish and Inglis, 1999; Somsueb and Boonyaratpalin, 2001; Chardonnet et al., 2002; Miles et al., 2003). According to FAO (2006), the part of worldwide frog trade (all species considered) supplied by aquaculture increased from 3% in 1980 to 15% in 2002. Due to the good taste of their meat like that of chicken and their color, frog consumption spread over many countries (Tokur et al., 2008). Importation of frog thigh was estimated to about 8000 tons in 2001 in the European Union (Negroni, 2003). Concerning the United States, they imported 2.232 tons in 2004 and 2.876 tons in 2005 (NOAA, 2005).
Table 1: Approximate formulation and composition of experimental diets.
| Ingredients | Protein rates in experimental diets (%) | |||||
|
P1 (20%) |
P2 (30%) |
P3 (40%) |
P4 (45%) |
P5 (50%) |
P6 (60%) |
|
|
Casein a |
7 | 10.5 | 21 | 25 | 32 | 44 |
|
Fish meal b |
13 | 21 | 25 | 28 | 28 | 28 |
|
Yeast c |
14 | 16 | 16 | 16 | 16 | 14 |
|
Dextrine d |
25.5 | 20 | 9 | 6 | 4.5 | 2 |
|
Glucose e |
27.5 | 21 | 18.5 | 15 | 9 | 2 |
|
Liver oil f |
3 | 2,5 | 2 | 2 | 2 | 2 |
|
Soya oil g |
3 | 3 | 2.5 | 2 | 2.5 | 2 |
|
Vitamin Premix h |
3 | 2.5 | 2.5 | 2.5 | 2.5 | 2.5 |
|
Mineral Premix i |
3 | 2.5 | 2.5 | 2.5 | 2.5 | 2.5 |
| Caroxylmethylcellulose | 1 | 1 | 1 | 1 | 1 | 1 |
| Diets composition | ||||||
| Dry matters (DM%) | 89.857 | 89.150 | 89.407 | 90.551 | 90.843 | 89.825 |
| Ash (%DM) | 14.841 | 15.574 | 13.686 | 15.410 | 14.749 | 16.054 |
| Crude Protein (%) | 21.321 | 30.105 | 40.308 | 45.142 | 50.249 | 57.884 |
| Crude lipid (%) | 7.406 | 7.7545 | 7.3805 | 7.261 | 7.9215 | 7.698 |
| Crude Energy (MJ/100 g) | 1.653 | 1.676 | 1.651 | 1.642 | 1.644 | 1.616 |
| Protein /Energy (MJ/100 g) | 12.898 | 17.962 | 24.414 | 27.492 | 30.565 |
35.819 |
a 100% Casein complex, Scitec Nutrition (73% crude protein, 2.3% crude fat, 14.7Kj.g-1 gross energy, Miami, USA)
b Ghana farming network Ltd (64% crude protein, 9.6% crude fat, 18.7 Kj.g-1 gross energy, Accra, Ghana)
c Saccharomyces cervisiae, S.I. Lesaffre (56% crude protein, 0% crude fat, 16.72 Kj.g-1 gross energy, France)
d Nestlé HealthCar Nutrition GmbH, D-67574 Osthofen (0.2% crude protein, 0% crude lipid, 16.18 Kj.g-1 gross energy)
e SIGMA-ALDRICH (0% cruds protein, 0% crude lipid, 15.94 Kj.g-1 gross energy, France)
f Setalg, France (0% crude protein, 100.0% crude lipid, 37.00 Kj.g-1 gross energy, France)
g Songhaï center (0% crude protein, 99.9% crude lipid, 37.00 Kj.g-1 gross energy, Benin)
h Vitamin premix contains (g 100 g-1 of premix) : ascorbc acid, 50.0 ; D-calcium pantothenate, 5.0 ; choline chloride, 100.0 ; inositol, 5.0 ; menadione, 2.0 ; niacin, 5.0 ; pyridoxine HCL, 1.0 ; riboflavin, 3.0 ; thiamin HCL, 0.5 ; DL-alpha-tocopherol acetate (250 IU g-1), 8.0 ; vitamin A acetate (20,000 IU g-1), 5.0 ; vitamin micro-mix, 10.0 ; cellulose, 805.5 ; Vitamin micro-mix contains (g.kg-1 of micro-mix) : biotin, 0.5 ; cholecalciferol (1µg = 40 IU), 0.02 ; folic acid, 1.8 ; vitamin B12, 0.02 ; cellulose, 97.66.
i Mineral premix contains (g kg-1 of premix) : calcium phosphate (monobasic) monohydrate, 136.0 ; calcium lactate pentahydrate, 348.49 ; ferrous sulfate heptahydrate, 5.0 ; magnesium sulfate heptahydrate, 132.0 ; potassium phosphate (dibasic), 240.0 ; sodium phosphate (monobasic) monohydrate, 88.0 ; sodium chloride, 45.0 ; aluminium chloride hexahydrate, 0.15 ; potassium iodide, 0.15 ; cupric sulfate pentahydrate, 0.50 ; manganese sulfate monohydrate, 0.70 ; cobalt chloride hexahydrate, 1.0 ; zinc sulfate heptahydrate, 3.0 ; sodium selenite, 0.011.
Nowadays, H. occipitalis is one of reared frogs in Africa countries such as Rwanda, Ivory Coast, and Benin etc. This species is also reared in Philippines and Malaysia due to its quick growth and tenderness of its meat (Tokur et al., 2008). Consequently, it is important to assess nutritional needs of H. occipitalis in order to master feed formulation for its rearing. Domestication and intensive rearing of H. occipitalis must start from providing information on raniculture and frog species diversification all over the world. In intensive larval rearing, feed protein rate is one of factors which influence the survival rate, the well-being and the growth (NRC, 1993), feed ration (Godome et al., 2018a) and stocking density (Schram et al., 2006; Godome et al., 2018b). It is therefore necessary to determine the appropriate feed protein rate on which depend nutrients and energy availability for speeded growth of the animal. Economically, knowing protein needs is essential for shortening larval rearing period because the aim of frog rearing is not getting big tadpoles but the production (Carmona-Osalde et al., 1997). Protein is the most expensive element in aquatic animals feed (Moreira et al., 2008). So, the use of agricultural by-product and vegetal protein genuine is economically and environmentally preferable. According to Oishi et al. (2010), the use of optimal protein for aquatic species prevents high environmental pollution especially in intensive rearing. It is so important to determine protein quantity necessary for rapid growth of H. occipitalis in order to avoid pollution of the rearing medium. It is also fundamental for formulation of feed diet suitable for any development stage of any species reared in captivity. Growth rate has often been used as physiological criterion for nutritional evaluation in many species. Numerous studies showed the importance of protein needs on survival and growth of R. catesbeiana (Chun-xiao et al., 2016; Olvera-Novoa et al., 2007; Prapee et al., 1997; Carmona-Osulde et al., 1997), R.esculanta (Tokur et al., 2008), but published studies explaining nutritional needs of H. occipitalis are almost inexistent nowadays. The current study aims to determine the optimal ration of H. occipitalis tadpoles.
MATERIAL AND METHODS
Formulation and Preparation of Feed Diets
Six isoenergetic experimental diets P1, P2, P3, P4, P5, and P6 were formulated with semi-purified ingredients. Protein rates in these diets are 20, 30, 40, 45, 50 and 60 g / 100 g respectively (Table 1). According to protein needs of tadpoles Rana catesbeiana belonging in the same order as H. occipitalis (Chun-Xiao et al., 2016; Prapee et al., 1997; Olvera-Novoa et al., 2007; Carmona-Osulde et al., 1997). The dry ingredients were crushed in a grinder, weighted, mixed and homogenized manually in a plastic bowl. Then, oil and water were added to obtain a soft paste that was minced (Moulinex HV8) in 0.2 – 0.8 mm diameter spaghettis. After drying in lyophilisator (Eyela Dry Chamber DRC-1N), spaghettis were manually fragmented in small grains and stored at 18 °C.
Origin of Experimental Tadpoles, Rearing Conditions and Feeding
H. occipitalis tadpoles (initial weight = 0.04 ± 0.02 g) used in the current study were obtained from artificial reproduction on the experimentation station of the Laboratory of Research on Wetlands of the University of Abomey-Calavi. Therefore, 72 hours after eggs hatching, tadpoles were transferred in circular ponds. They were fed, for one week, on live preys (zooplankton and nauplii of Artemia salina) which were then progressively substituted by commercial feed (Coppens). Then, in order to accustom Tadpoles to experimental diets, they were fed on a mixture of these diets. Tadpoles were reared like that till reaching about 0.38 g. The experiment was carried out for 24 days in 18 circular ponds containing 30 L water each one. These acclimated tadpoles (0.380 ± 0.004 g) were then distributed in 18 circular ponds containing 30 L water each one with at a stocking density of 55 tadpoles/pond. During the experiment, tadpoles were manually and hourly from 8 am to 6 pm everyday at a ration of 6% tadpoles biomass.
Water quality were monitored by measurement of temperature, dissolved oxygen and pH using. Portable multimeter (Calypso ORCHIDIS SN-ODEOA 2138) at 7:30 am and 4:30 pm. Therefore, Mean values of water temperature, pH and dissolved oxygen in the experimental media were 28.33 ± 0.09 °C, 3.98 ± 0.02 mg.L-1n 7.01 ± 0.01 and respectively. Water were renewed twice per day at 7 am and 17 pm before and after feeding with flow 0.5 L per minute.
Control fishing was done every three days following by emptying and cleaning of ponds. Tadpoles were then counted and biomass was evaluated in each pond in order to adjust feed ration. After 24 days rearing, tadpoles were collected from ponds and weighted individually. Data collected enabled calculation of some parameters such as weight gain (WG), specific growth rate (SGR), survival rate (SR), feed conversion rate (FCR), ingested feed (IF), ingested protein (IP) and protein efficiency ratio (PER) were calculated through the following formulas:
WG (%) = 100 × [final mean weight (g) – initial mean weight (g) / initial mean weight]
SGR (%/D) = 100 x [ln (final mean weight) – ln (initial mean weight)]/experiment duration
SR (%) = 100 x (final number / initial number)
FCR = ingested feed quantity (g) / weight gain (g)
IF = (supplied dry feed – remained dry feed) / tadpoles number
IP (%) = [Protein rate of diet × ingested feed] / 100
PER = weight gain (g) / ingested protein quantity.
At the end of experiment, fifteen bulbous crowfoots were randomly sampled from each pond and sacrificed for chemical analysis. Analysis of dry matter, crude proteins, crude lipids and ash were assessed in experimental feed and bulbous crowfoots carcass according to the method of AOAC (2012).
Data Analysis
Data collected enabled zootechnical parameters calculation. Mean and range were calculated for each parameter. Mean values for each replication were considered as an observation.
The R (version 3.5.0) software was used for comparisons with 5% probability threshold. One way analysis of variance (ANOVA 1) was carried out to compare zootechnical performances of the different treatments. The Student-Newman-Keuls test (SNK test) was carried used pair comparisons of means in order to determine the optimal protein rate and survival rate of H. occipitalis tadpoles. The model of Brett and Grove (1979) was applied to the polynomial regression II between the specific growth rate and protein rate to determine optimal and maximal protein requirements of H. occipitalis tadpoles.
RESULTS
Water Quality
During the experiment, pH and dissolved oxygen of water have not been significantly influenced by the treatments (P > 0.05). In return, temperature values varied significantly among treatments (P < 0.05) (Table 2).
Table 2: Mean values ± standard deviation of pH, temperature and dissolved oxygen (DO) of the differents treatments during the experiment.
| Parameters | P1 (20%) | P2 (30%) | P3 (40%) | P4 (45%) | P5 (50%) | P6 (60) |
| pH | 7.375±0.043a | 7.258±0.080a | 7.258±0.080a | 7.308±0.014a | 7.150±0.156a | 7.158±0.072a |
| T°C | 29.783±0.005a | 29.653±0.105a | 29.436±0.030b | 29.343±0.053b | 29.165±0.133c | 28.866±0.034d |
| DO (mg/L) | 8.366±0.038a | 8.374±0.596a | 7.791±0.920a | 7.766±0.500a | 6.516±1.432a |
7.400±1.047a |
abcd mean values on same line, following by different letters are significantly different (P < 0.05).
Table 3: Growth and nutrients utilization parameters in Hoplobatrachus occipitalis tadpoles fed different protein rate for 24 days.
| Parameters |
P1 |
P2 |
P3 |
P4 |
P5 |
P6 |
| 20% | 30% | 40% | 45% | 50% | 60% | |
| Bi |
20.93 ± 0.234a |
20.436 ± 1.250a |
19.996±0.883a |
19.783 ± 0.872a |
21.203 ± 0.322a |
21.130±0.364a |
| Bf |
31.966±1.799c |
33.660±0.192c |
39.486±0.927b |
39.246±1.221b |
38.616±1.211b |
42.626±1.740a |
| DWG (g/D) |
0.195±0.015d |
0.291±0.035c |
0.411±0.016ab |
0.422±0.026ab |
0.393±0.016b |
0.454±0.017a |
| SGR (%/D) |
1.729±0.124c |
2.415±0.329b |
3.152±0.025a |
3.238±0.210a |
2.930±0.117a |
3.253±0.087a |
| IF |
0.249±0.012d |
0.306±0.011c |
0.391±0.005b |
0.468±0.041a |
0.478±0.026a |
0.507±0.007a |
| IP |
2.425±0.097e |
4.593±0.249d |
7.993±0.038c |
10.404±0.863b |
11.248±0.776b |
14.932±0.433a |
| FCR |
1.117±0.163a |
1.169±0.176a |
1.025±0.016a |
1.187±0.033a |
1.295±0.102a |
1.161±0.063a |
| PER |
4.535±0.612a |
2.893±0.431b |
2.438±0.039b |
1.872±0.053c |
1.550±0.119c |
1.438±0.080c |
| SR (%) |
88.484±1.049b |
90.909±1.818ab |
92.727±1.818a |
89.696±1.049ab |
85.454±1.818c |
89.090±1.818ab |
abcde values on same line and non affected by same letter are significantly different (P < 0.05).
Table 4: composition of Hoplobatrachus occipitalis tadpoles fed on six different protein rates for 24 days.
|
Parameters |
Control |
P1 (20%) |
P2 (30%) |
P3 (40%) |
P4 (45%) |
P5 (50%) |
P6 (60%) |
|
Dry matter |
78,634± 3,126b |
89,857± 0,011a |
89,150± 0,048a |
89,407± 0,009a |
90,551± 0,020a |
90,843± 0,037a |
89,825± 0,047a |
|
Ash |
11,791± 0,010g |
14,841± 0,008d |
15,574± 0,005b |
13,686± 0,014f |
15,410± 0,030c |
14,749± 0,011e |
16,054± 0,014a |
|
Crude lipid |
8,349± 0,901e |
10,734± 0,092bc |
11,414± 0,336b |
10,55± 0,384c |
9,558± 0,284d |
12,396± 0,165a |
9,206± 0,002d |
|
Crude protein |
36,783± 0,592c |
43,491± 0,001b |
43,217± 0,003b |
35,606± 0,003d |
47,327± 0,005a |
44,053± 0,004b |
36,799± 0,004c |
abcdefg values on same line and not affected by same letter are significantly different (P< 0.05).
Survival And Growth Of Tadpoles
Growth parameters, feed utilization and survival rate of H. occipitalis tadpoles are mentioned in Table 3. For the current experiment, survival rate was between 85.454 ± 1.818 and 92.727 ± 1.818%. The highest survival rate was obtained with tadpoles fed on diet P3 (40% protein). However, apart from tadpoles fed on 50% protein diet (P5) presenting the lowest value, any significant difference was not observed (P ˂ 0.05) among treatments. Specific growth rate, final mean weight and protein efficiency ratio were significantly influenced (P ˃ 0.05) by the different diets protein rate. Mean biomasses of tadpoles fed on 40, 45, 50 and 60% protein diets doubled almost after the 24 days. The highest final biomass was obtained with the 60% protein diet (P6) (Figure 1). The best specific growth rate (3.253 ± 0.087 %/D) was also noticed with the diet P6. However, there was no significant difference (P > 0.05) among treatments P3 to P6. The highest mean values of feed conversion rate was obtained in P4 (45% protein) treatment but any significant difference was not observed among feed conversion rates. The same report was done for weight but with significant difference (P > 0.05) among treatments. Protein efficiency ratios were significantly influenced (P ˂ 0.05) by treatments. The highest mean value was obtained in the 20% protein treatment (P1).
Approximate Composition of Tadpoles’ Carcass
The composition of H. occipitalis tadpoles carcass at the end of experiment is mentioned in Table 4. Proteins, lipids, ash and dry matters were significantly affected (P ˂ 0.05) by the protein rates. The carcass of tadpoles fed on diet P4 (45%) presented the highest protein rate though the lowest was recorded in the carcass of tadpoles fed on diet P3 (40%). Lipid value of the carcass of tadpoles fed on diet P5 (50%) was the significantly highest. Generally, dry matter, lipid, protein and ash in the initial sample were lower than those after tadpoles feeding.
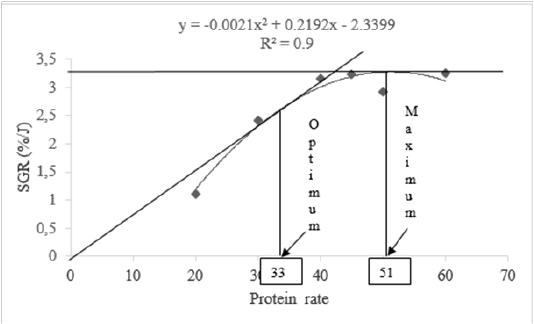
Estimation of Protein Needs
Mean values of specific growth rate and feed conversion rate showed the best feed were P6 (60%) followed successively by P4 (45%), P3 (40%), and P5 (50%). According to Brett and Grove (1979) method expressing relationship between feed protein rates and specific growth rate, optimal and maximal protein needs for a good growth of H. occipitalis tadpoles are respectively 33 % and 51 % (Figure 2).
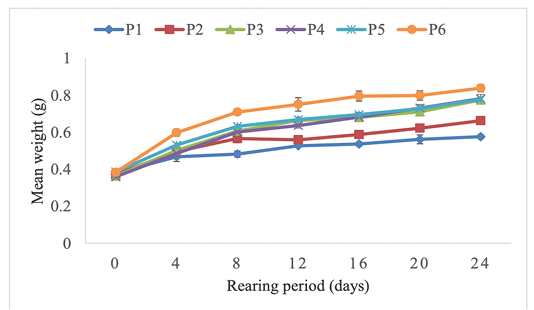
Figure 1: Effect of different feed protein rates on the body weight of Hoplobatrachus occipitalis tadpoles during the experiment.
DISCUSSION
Temperature is the major factor influencing frog growth because it interferes directly with their metabolism (Petersen and Gleeson, 2011). Besides, temperatures recorded during the current study were within the range 15 to 35°C recommended for good growth of tadpoles (Petersen and Gleeson, 2011). Values of pH (7.150 ± 0.156 – 7.375 ± 0.043) and dissolved oxygen (6.516 ± 1.432 – 8.374 ± 0.596 mg/l) obtained during the experiment are in accordance with those recorded by certain authors (Flores-Nava and Vera-Muñoz, 1999; Borges et al., 2014) in Lithobates catesbeianus tadpoles.
After the 24 days feeding experiment, survival rates recorded for treatments varied from 85.454 ± 1.818 to 92.727 ± 1.818 %. These survival rates are higher than those (83.33 ± 0.10 - 90.48 ± 0.11 %) recorded for Calyptocephalella gayi by Pedro et al. (2014) but similar to those obtained by Rungkan, 2015 (75.00 ± 2.36 - 92.22 ± 1.92 %) with R. rugulosa, those of Zhang et al. (2016) with R. catesbeiana and Godome et al. (2018a) H. occipitalis. During the experiment, the highest mortality was observed in tadpoles fed on diet P1 (20%) and P2 (30%). These mortalities seem due to the protein rates of these diets which are lower than the least protein rate (40%) recommended in frogs feed (Carmona-Osalde et al., 1997). Indeed, in predatory species, adaptation to artificial feed affects their survival rate (Durville et al., 2003).
SGR recorded in the current experiment (1.729 ± 0.124%/D and 3.253 ± 0.087 %/D) are different from those recorded for Calyptocephalella gayi (1.02 ± 0.08 %/D, Pedro et al., 2014), tadpoles of Rana rugulosa (2.79 ± 0.19 %/D, Rungkan, 2015) and Rana catesbeiana (1.86 ± 0.02 %/D, Zhang et al., 2016). According to Flores-Nava et al. (1994), the height of tadpoles fed on low protein level varies more than those fed on high protein level. The lowest SGR were obtained for tadpoles fed on P1 diet. This low SGR recorded by P1 could be tied to the low protein rate (20% protein) of this diet since feed protein level affects tadpoles’ growth rate. Indeed, metamorphosis can be achieved unless tadpoles satisfy their protein requirements (Carmona-Osalde et al., 1997). A study carried out by Martinez et al. (1993) with Rana perezi tadpoles showed their development depends on feed nutrients. Insufficient feeding also elongates larval period.
It is important to notice that inadequate feed protein rate leads to growth reduction and weight loss. Therefore the lowest growth obtained by diets 20% and 30% may be due to the fact major part of protein was used for maintenance instead of growth.
Feed conversion rate (FCR) and protein efficiency ratio (PER) can be qualified as excellent feeding and protein utilization indicators in aquaculture. FCR recorded during the current study are lower than those recorded for Rana catesbeiana (Olvera-Novoa et al., 2007; Flores-Nava and Vera-Muñoz, 1999; Gogome et al., 2018a). These low FCR obtained may be due not only to the quality of feed diets but also to experimental conditions such as difference among species, stocking density, protein quality and environmental conditions (Jauncey and Ross, 1982; Al-Hafedh, 1999). In this study PER decreases with the protein levels. These results are close to those reported by Olvera-Novoa et al. (2007) but upper than trends recorded for Rana catesbeiana tadpoles (Carmona-Osalde et al., 1997).
Crude protein rates recorded in tadepoles’ carcass reared in this study are highly lower than those reported by Thirumalai et al. (1977) in frog (70.8%) and Tokur et al. (2008) in R. esculanta tadpoles (58.1%). In contrary, they are largely upper than those recorded in R. catesbeiana tadpoles (17.39 % and 14.61 %) by Zhang et al. (2016) and Olvera-Novoa et al. (2007) respectively. That could be explained by difference among species the rearing conditions and the feed composition. Lipid rate (7.1%) noticed in H. occipitalis tadepoles’carcass is higher than that reported by Thirumalai et al. (1977) in frog carcass which ash rate (22.1%) is though the current. Besides, Rao and Kamasastri (1963) observed highest fat rate (8.4%) lower than our results based on dry weight. This difference can be explained by the fact mentioned studies were carried out on the same species.
According to model of Brett and Grove (1979) used for evaluation of feed protein rate in relation to SGR, the optimal and the maximal protein rates for good growth of H. occipitalis tadpoles are 33% and 51% respectively. This feed protein rate optimal can be useful for optimization of larval rearing period. Prior nutritional studies on Rana catesbeiana tadpoles indicated the best performance was obtained in diet with about 40% protein rate (Carmona-Osalde et al., 1997). Our protein rates recorded are nearby those (20 to 70%) recorded by Culley et al. (1978) or 20 to 50% (Fontanello et al. 1982), either 33 to 40% (Mazzoni and Camevia, 1988). Roughly, protein rate obtained in the current study is a little close (40%) to those reported by Fontanello et al. (1985).
CONCLUSION
The results of this study indicate that the highest daily weight gain (DWG) and specific growth rate (SGR) were obtained by diet containing 60% of protein. In relation of SGR, protein needs of H. occipitalis tadpoles varied from 33 to 51 % representing the optimum and maximum respectively. Higher feed protein rate leads not only to an increase in protein efficiency ratio but also to excess lipid accumulation in H. occipitalis tadpoles’ carcass.
ACKNOWLEDGMENTS
Authors give a thank to the Worldwide Bank through the African Center of Excellence on Climate Change, Biodiversity and Sustainable Agriculture (ACE-CCBSA) for its financial support granted to Théophile GODOME. We also thank Landry ALAPINI, Mahunan Tobias C. AZON and James G. ZANNOU for their contribution.
Conflict of Interest
There is no conflict of interest.
AUTHORS’ CONTRIBUTION
All authors contributed equally in this study and writing of the manuscript.
REFERENCES