
Advances in Animal and Veterinary Sciences


Short Communication

Fecal Hormone Assay and Urinalysis of Pregnant Cattle
Shahir Bin Mokbul1, Tofazzal Md. Rakib2*, Amith Kumar Dash3, Sabuj Kanti Nath3, Dipon Kumar Bhowmik4, Shama Ranjan Barua2, Md. Shafiqul Islam2, Samun Sarker5, Amir Hossan Shaikat6
1Department of Dairy and Poultry Science, Chittagong Veterinary and Animal Sciences University, Khulshi, Chittagong; 2Department of Pathology and Parasitology, Chittagong Veterinary and Animal Sciences University, Khulshi, Chittagong; 3Department of Animal Science and Nutrition, Chittagong Veterinary and Animal Sciences University, Khulshi, Chittagong: 4Paragon Breeder and Hatchery Limited, Savar, Dhaka; 5 Department of Microbiology and Public Health, Chittagong Veterinary and Animal Sciences University, Khulshi, Chittagong; 6Department of Physiology, Biochemistry and Pharmacology, Chittagong Veterinary and Animal Sciences University, Khulshi, Chittagong, Bangladesh.
Abstract | Variation in concentrations of Thyroxin (T4), Thyroid stimulating hormone (TSH) and Follicle stimulating hormone (FSH) shed in feces may help to identify physiological states of animals, but the efficacy of the technique needs to be validated for each species. Therefore, a short term cross sectional study was performed in 120 pregnant cattle for fecal hormonal analysis and urine analysis. For this, Enzyme linked immune sorbent assay (ELISA) technique was used for TSH, T4, and FSH assay and dip strip with microscopic test for urinalysis. Variation of T4, TSH and FSH concentrations in three trimesters of pregnancy was estimated in feces of cattle. Highest T4 concentration was found in third trimester of pregnancy 165.2 ± 53.4ng/ml with TSH (µIU/ml) fluctuation of decreasing trends. TSH was highest in second trimester as 0.5 ±0.4 µIU/ml. There was no significant variation (p>0.05) for fecal T4 and TSH concentration. FSH level (mIU/ml) was sharply decreased (p< 0.01) with the advancement of pregnancy. Urinary pH turns acidic to alkaline in advance stage of pregnancy and specific gravity fluctuated among three trimesters of pregnancy. No significant variation (p>0.05) was found between variables for urine pH and specific gravity. The important identified deposits of urine were crystals, leucocytes, blood, casts, uric acid and calcium phosphate crystal in pregnant cattle. Crystalluria were a frequent finding of routine urine examination of cattle suggesting possible prone to urolithiasis, acute uric acid nephropathy induced by drugs such as sulphadiazine.
Keywords | Fecal hormone, Urinary pH, Specific gravity, Crystalluria, ELISA
Editor | Kuldeep Dhama, Indian Veterinary Research Institute, Uttar Pradesh, India.
Received | January 12, 2016; Accepted | April 20, 2016; Published | April 28, 2016
*Correspondence | Tofazzal Md. Rakib, Chittagong Veterinary and Animal Sciences University, Khulshi, Chittagong, Bangladesh; E-mail: rakibtofazzal367@gmail.com
Citation | Mokbul SB, Rakib TM, Dash AK, Nath SK, Bhowmik DK, Barua SR, Islam MS, Samun S, Shaikat AH (2016). Fecal hormone assay and urinalysis of pregnant cattle. Adv. Anim. Vet. Sci. 4(45): 200-204.
DOI | Http://dx.doi.org/10.14737/journal.aavs/2016/4.4.200.204
ISSN (Online) | 2307-8316; ISSN (Print) | 2309-3331
Copyright © 2016 Mokbul et al. This is an open access article distributed under the Creative Commons Attribution License, which permits unrestricted use, distribution, and reproduction in any medium, provided the original work is properly cited.
Reproductive performance of dairy herds has long been recognized as a major contributor to the overall profitability of dairy operations. Total milk sales, number of culled cows and number of replacement heifers born are among the major sources of income affected by reproductive performance of lactating dairy cows (De Vries, 2004; Meadows et al., 2005). Estrous detection aids (Rorie et al., 2002), hormonal synchronization of estrus, timed artificial insemination (Souza et al., 2008), and computerized record systems are among the technologies most commonly used by modern dairy farms to improve breeding efficiency and fertility (Caraviello et al., 2006).
Early identification of pregnant and nonpregnant cows post breeding improves reproductive efficiency and pregnancy rate in cattle by decreasing the interval between services. Many new and old technologies are available to identify pregnant and nonpregnant animals early post service and can play a key role in an overall reproductive management strategy to rapidly return these animals to the breeding program (Broaddus and de Vries, 2005).
Palpation of the uterine contents rectally 40-45 days after insemination is probably the most commonly used method for pregnancy diagnosis. The main disadvantage of rectal palpation is that it cannot be performed until later in gestation than some other methods. Pregnancy can also be determined by ultrasound or by measuring pregnancy related biochemical markers (Ropstad et al., 1998). Besides that, fecal hormone analysis is now widely used to monitor reproductive hormones in captive and free ranging wild life (Pereira et al., 2006) as well as in laboratory animals (Chelini et al., 2005). Thus this technique appears like an attractive noninvasive, inexpensive, alternative tool that avoids the stress effects related to blood sampling. As estrogens are end products of steroid metabolism, the compounds in plasma and feces are rather similar (Schwarzenberger et al., 1996). In contrast, progesterone is extensively metabolized, and in ungulate species a large number of progestins is present in feces (Palme et al., 1997). Because the immunoassays used to detect excreted steroids were developed for use in human serum, plasma, or urine, it is necessary to test these assays for cross reactivity with the 5α5β-reduced metabolites present in fecal samples of ruminants (Palme et al., 1997). Regarding above background, the present study was conducted to estimate the selected hormone and their level in fecal sample and analyse various urinary constituents of pregnant cattle.
The study was conducted at two dairy farms in Chittagong metropolitan area of Bangladesh. Several types of cow breed were reared (50%, 75% Holstein Friesian (HF), Jersey and several local breed) in face in housing system. A questionnaire was made before collection of sample. 120 cattle of different trimesters were selected from farm record of two-studied farm (60 from each). The pregnant cattle were sub grouped to three trimesters as the method described earlier by (Torell, 2015). Freshly void fecal and mid-stream urine samples were collected from tagged cattle. Sterile vials were used to collect the samples. Samples were then kept in ice box and transported to Physiology laboratory of Chittagong Veterinary and Animal Sciences University (CVASU). Samples were preserved in -20ºC, in Physiology laboratory of CVASU. 0.2 gm fecal sample was weighted out using digital weighing balance and taken to test tube. Then 5.0 ml of 90% ethanol (4.5 ml ethanol and .5 ml distilled water) was added and vortexed briefly. Then boiling was done in hot water bath (90ºC) for 20 minutes and ethanol was added to keep from boiling dry. The volume of extract kept up to preboil level with ethanol and was centrifuged at 1500 rpm for 20 minutes. Extract was poured into a second set of test tubes. To the remaining fecal pellets 90% ethanol was added and vortexed for 30 seconds. It was centrifuged at 1500 rpm for 15 minutes. The first and second extracts were combined and stored in cryovial and was frozen the extract in -20ºC for until analysis. Specific anti-hormone antibodies were coated onto micro-titration wells. Extracted test samples were applied. Hormones (T4, TSH, and FSH) with Horse radish Peroxidase Enzyme (Human®, Germany) were added. It competes with the released fecal hormones for available binding sites on the solid phase. After incubation, the wells were washed with water to remove any unbound hormone or enzyme conjugate. On addition of the Substrate (TMB), a colour develops only on those wells in which enzyme was present. As a result, hormone molecule being “sandwiched” between the solid phase and the enzyme linked antibodies. The reaction was stopped by the addition of dilute Hydrochloric acid and the absorbance was then measured at 450nm in Erba LisaScan IITM. The mean absorbance values were used for each specimen to determine the corresponding concentration of hormone from the standard curve (Wang et al., 2013).
Urine test strip was used (model: Uric 10 CF) for chemical and physical examination of urine. The presence of chemical and physical change of urine by constituents’ material was detected by colour change. Leucocytes, nitrites, urobilinogen, protein, PH, blood, specific gravity, ketone body, bilirubin, and glucose in urine were qualitatively tested from urine. Twelve random urine samples (Two from each trimester i.e 12 from two farms) were transferred to falcon tube and tagged properly. After that those were centrifuged at 3000 rpm for 30 minutes. After centrifugation, supernatant was discarded and sediment was vortexed properly. Then one drop of sediment was taken in a slide and by using cover slip various constituents was identified at 10X, 40X magnification.
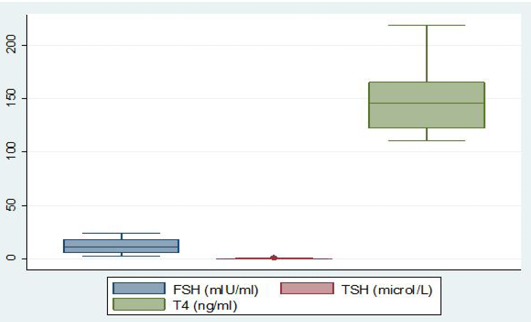
Among the analysed extracted fecal samples (n =120) collected from two dairy farms, the average concentration of T4 was 150.8 ± 32.9 ng/ml. Simultaneously, another two hormones TSH and FSH concentration were 0.3 ± 0.3 mIU/ml and 12.1 ± 7.5 mIU/ml, respectively which have shown in box plot diagram (Figure 1). After grouping the pregnant cattle according to trimester basis fluctuated level of hormone were found (Table 1). The concentration of fecal T4 was highest in 3rd trimester of pregnancy 165.2 ± 53.4 ng/ml. In trimester categories, no significant variation (p>0.05) for fecal T4 concentration was observed. In feces, mean FSH metabolite concentration was 19.9 ± 3.4 mIU/ml of extracted feces at first trimester. It started to decrease in the second trimester of pregnancy reaching 9.4 ± 2.7 mIU/ml of extracted feces and 4.2 ± 1.6 mIU/ml of extracted feces in 3rd trimester. Highly significant difference (p<0.01) was observed among different trimester for fecal FSH concentration. Fecal concentration of TSH started to increase in 2nd trimester to reach a peak value at this time (0.5 ± 0.4 µIU/ml of extracted feces) and then decreased sharply on the subsequent 3rd trimester (0.1±0.14 µIU/ml of extracted feces). There was no significant variation (p>0.05) for fecal TSH concentration.
Table 1: Fecal hormone concentration in different trimester of pregnant cattle
|
Variable |
Categories |
Mean ± SD |
p |
|
T4 (ng/ml) |
1st trimester (n=40) |
131.4 ± 17.6 |
0.35 |
|
2nd trimester (n=40) |
162.3 ± 17.2 |
||
|
3rd trimester (n=40) |
165.2 ± 53.4 |
||
|
FSH (mIU/ml) |
1st trimester (n=40) |
19.9 ± 3.4 |
0.0004* |
|
2nd trimester (n=40) |
9.4 ± 2.7 |
||
|
3rd trimester (n=40) |
4.2 ± 1.6 |
||
|
TSH (µIU/ml) |
1st trimester (n=40) |
0.2 ± 0.2 |
0.29 |
|
2nd trimester (n=40) |
0.5 ±0.4 |
||
|
3rd trimester (n=40) |
0.1± 0.14 |
*Significant
Table 2: Association of specific gravity with corresponding urine PH and blood in urine
|
Specific Gravity |
pH |
Blood |
||
|
Alkaline |
Acidic |
Trace |
Nil |
|
|
≤1.005 (n= 57) |
57 (100%) |
0 (0%) |
0 (0%) |
57 (100%) |
|
≥1.005 (n= 63) |
42 (66.7%) |
21 (33.3%) |
42 (66.7%) |
21 (33.3%) |
|
p-value |
0.448 |
0.488 |
||
One hundred twenty urine samples were tested by dipstick. Level of leucocytes, nitrites, urobilinogen, pH, specific gravity, protein, blood, bilirubin, ketone and glucose was observed. Trace amount (15 Ca CELLS/µl) of leucocytes was found in seven samples (2nd trimester), urobilinogen was found positive in 116 samples (1mg/dl in 97 samples and 4mg/dl found in 19 samples). Here, highest percentage of urobilinogen was found in urine sample of cattle of 3rd trimester of pregnancy. 102 samples revealed the presence of trace amount (1mg/dl) protein in urine. The presence of ketone bodies found in all samples; among them 101 samples have 15 mg/dl and another 19 had 40 mg/dl of urine. Trace amount of glucose (<250 mg/dl) was found in 9 samples in 2nd trimester of pregnancy. We found no significant (P>0.05) association of specific gravity with corresponding urine pH and blood in urine (Table 2). No significant variation (p>0.05) was found between variables for urine PH and specific gravity. Uric acid crystal was found in majority of samples and calcium phosphate crystal was also abundant. Calcium oxalate was present in few samples.
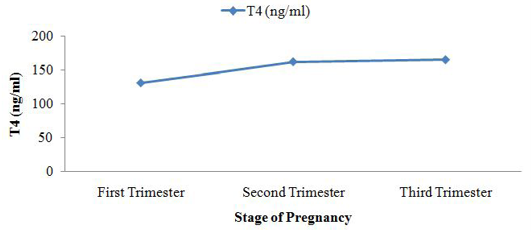
Table 3: pH and specific gravity of urine in three trimesters of pregnant cattle
|
Trimester |
pH (Mean ± SD) |
Specific Gravity (Mean ± SD) |
|
First (n=40) |
5.5 ± 0.7 |
1.01 ± 0.007 |
|
Second (n=40) |
7 ± 1.5 |
1.005 ± 0.002 |
|
Third (n=40) |
7.6 ± 1.7 |
1.007 ± 0.003 |
|
p-value |
0.3 |
0.31 |
The concentration of fecal T4 (ng/ml) was lowest in 1st trimester of cattle pregnancy 131.4 ± 17.6 and peak in 3rd trimester of cattle pregnancy 165.2 ± 53.4. There was no significant variation (p>0.05) for fecal T4 concentration. (Keech et al., 2010) observed fecal T4 concentration in steller sea lion ((Eumetopias jubatus). The average fecal concentration of T4 was 2012 ng/g of feces and peak T4 concentration was 2842 ng/g feces of steller sea lion (Eumetopias jubatus).
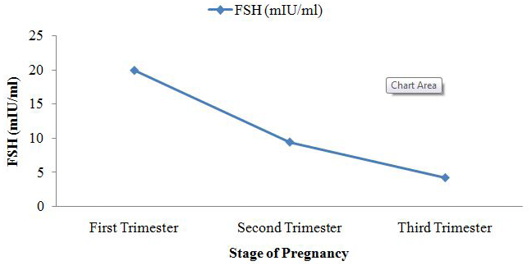
Fluctuating phenomena was seen in fecal TSH (µIU/ml) concentration. It was 0.2 ± 0.2 in 1st trimester and 0.1 ± 0.14 in third trimester but peak level of TSH was seen in 2nd trimester of pregnancy in cattle. Highly significant difference (p<0.01) between variables for fecal FSH concentration was observed. Sangeetha and Rameshkumar (2014) examined the fecal FSH concentration of sheep (Ovis aries). Fecal FSH average concentration in Sheep during pregnancy was 0.81 ± 0.01mIU/ml, highest concentration found during estrus was 3.12 ± 0.02 mIU/ml and lowest concentration during lactation was 0.03 ± 0.01 mIU/ml.
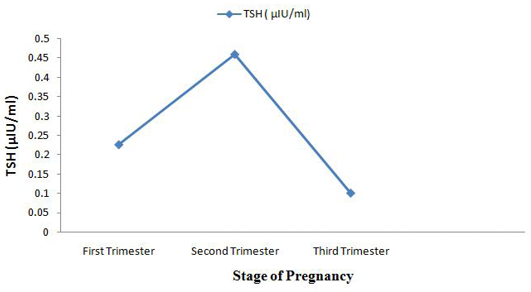
Table 4: Microscopic examination of urine samples
|
Sample No. |
Microscopic Findings (40X) |
Concentration |
|
1A1 |
Amorphous urate crystal |
++ |
|
Uric acid crystals |
+ |
|
|
1A2 |
Calcium phosphate crystal |
++ |
|
Uric acid crystals |
+ |
|
|
1B1 |
Calcium phosphate crystal |
+ |
|
1B2 |
Fatty cast |
+ |
|
2A1 |
Uric acid crystal |
+++ |
|
2A2 |
Fatty cast |
++ |
|
2B1 |
Calcium phosphate |
+ |
|
2B2 |
Fatty cast |
++ |
|
Uric acid crystals |
+ |
|
|
3A1 |
Calcium phosphate crystal |
+++ |
|
Calcium carbonate crystal |
+ |
|
|
3A2 |
Fatty cast |
+ |
|
3B1 |
Amorphous Urates |
+++ |
|
Amorphous phosphates |
+++ |
|
|
Uric acid Crystal |
++ |
|
|
3B2 |
Fatty cast |
+ |
|
Epithelial cells |
+ |
|
|
Calcium oxalate crystals |
+++ |
Specific gravity of cattle urine in 3rd trimester was 1.007 ± 0.003 but in 1st trimester it was 1.01 ± 0.007 and PH turns to acidic to alkaline in advance stage of pregnancy. It was 5.5 ± 0.7 in 1st trimester of pregnancy and 7.6 ± 1.7 in 3rd stage of pregnancy. Mavangira et al. (2010) had shown the urinary pH in normal cattle is usually on the alkaline side and may range from 7.4 to 8.4. Seifi et al. (2004) stated that pH value >8.25 in the 48 hours prior to calving accurately predict that those cows will get clinical milk fever. Kannan and Lawrence (2010) stated that the range of specific gravity of urine in normal cattle is 1.025-1.045 with an average of 1.035 and Braun (2005) also has shown in obstructive urolithiasis it ranges from 1.008 to 1.025. Among thirteen samples twelve samples had shown presence of urobilinogen, in twelve samples; where 1mg/dl in eight samples and 4mg/dl found in two samples. Hohenberger and Kimling (2008) stated that the colour fields of dip strip correspond to the following urobilinogen concentrations: normal (0 - 1), 2, 4, 8, 12 mg/dL or normal (0 - 17). Trace amount (1mg/dl) protein in urine showed by eleven samples. Leendertz et al. (2010) stated that low levels of protein in urine are normal. Small increases in protein in urine usually aren’t a cause for concern. The presence of ketone bodies found in all samples; among them eleven samples has 15 mg/dl and another two had 40 mg/dl of urine. Hohenberger and Kimling (2008) also found the colour fields of strip correspond to the following acetoacetic acid values: 0 (negative), 25 (+), 100 (++) and 300 (+++) mg/dL. Ketones in the urine are caused by an abnormal carbohydrate metabolism. Urine analysis is not often part of a veterinary surgeon’s diagnostic armory but recent advances in interpretation of urinary pH and macromineral content make it an available and interesting investigative tool (Husband, 2010). Maximum samples had shown the presence of calcium phosphate and uric acid crystals in urine. It may be due to, pathological conditions such as urolithiasis, acute uric acid nephropathy, ethylene glycol poisoning, and hypereosinophilic syndrome. Additionally, crystalluria can also be due to drugs such as sulphadiazine (Thamilselvan and Khan, 1997).
By evaluating T4, TSH, FSH, urinalysis (physical, chemical, microscopic) in pregnant cattle we found statistically significant alterations of FSH during three trimesters of cattle. Non-invasive method like hormone analysis and urinalysis may be used as tool for pregnancy diagnosis. Author recommends further research on fecal hormone analysis for monitoring reproductive status of animal as attractive, non invasive, inexpensive alternative tool compare to blood sampling.
Author’s Contribution
All authors contributed equally.
Conflict of interest
There exists no conflict of interest.
ACKNOWLEDGEMENTS
Authors would like to thank teachers and staff of Departmnt of Physiology, Parasitology and Pharmacology, Chittagong Veterinary and Animal Sciences University and farm owners for their support and suggestion throughout the study.
References

