Total Tract Nutrient Retention and Apparent Metabolizable Energy of Different Varieties of Wheat, Maize and Sorghum in Quails


Research Article
Total Tract Nutrient Retention and Apparent Metabolizable Energy of Different Varieties of Wheat, Maize and Sorghum in Quails
Muhammad Sohail1*, Asad Sultan2, Said Sajjad Ali Shah3, Muhammad Sajid1 and Adnan Khan4
1Veterinary Research and Disease Investigation Center Abbottabad Khyber Pakhtunkhwa, Pakistan; 2Department of Poultry Science, The University of Agriculture, Peshawar, Khyber Pakhtunkhwa, Pakistan; 3Research Officer, Veterinary Research Institute, Peshawar; 4Veterinary Officer Livestock and Dairy Development Department Khyber Pakhtunkhwa Pakistan.
Abstract | The present study was conducted to investigate the digestibility of cereal grains like wheat, maize, sorghum and their cultivars in quail birds. A total of 270 quail birds were raised in cages having three main groups, one each for wheat (W), maize (M), sorghum (S) and six subgroups for the collection of fecal samples and further analyses. Nutrient profile, digestibility coefficients, and apparent metabolizable energy were investigated. Fat percentage and metabolizable energy was higher in maize (4.1% and 17.04 MJ/kg). The protein levels in wheat varieties were 12.15 and 11.89% which were more than that of both of corn (8.21 and 8.05% respectively) and sorghum varieties (10.41% and 9.89% respectively). The bioavailability of crude protein was higher in maize followed by wheat and sorghum. The phytic acid contents were found highest in both varieties of sorghum (0.85% and 0.87% respectively) as compared to the wheat varieties (0.78 % and 0.80%) and corn varieties (0.72 % and 0.71 respectively). Retention and digestibility of OM from maize cultivars was higher (0.841 and 0.836 respectively) followed by wheat varieties (0.811 and 0.806 respectively) while the sorghum varieties (0.782 and 0.779 respectively). The digestibility coefficient of crude fat of both the varieties of maize was higher (0.761 and 0.759 respectively) followed by sorghum (0.734 and 0.707 respectively) and wheat varieties (0.671 and 0.653 respectively). The digestibility of ash among cereal grains was significant (P<0.05) for maize (0.612 and 0.609) followed by wheat (0.571 and 0.565) and sorghum (0.541 and 0.557), respectively. The digestibility coefficient of phosphorus among various cereal types in quails was significant (P<0.05) It was highest for maize (0.572-0.569) followed by sorghum (0.538-0.542) and wheat (0.537-0.541). The maize cultivars were more bioavailable from every aspect when compared with wheat and sorghum and wheat cultivars/varieties. It has been assumed that bioavailability of phytate-phosphorus is comparatively higher than other poultry species particularly broilers.
Editor | Muhammad Abubakar, National Veterinary Laboratories, Park Road, Islamabad, Pakistan.
Received | March 22, 2019; Accepted | April 23, 2019; Published | May 03, 2019
*Correspondence | Muhammad Sohail, Research officer Veterinary Research and Disease Investigation Center Abbottabad Khyber Pakhtunkhwa, Pakistan; Email: dr.msohail@ymail.com
Citation | Sohail, M., A. Sultan, S.S.A. Shah, M. Sajid and A. Khan. 2019. Total tract nutrient retention and apparent metabolizable energy of different varieties of wheat, maize and sorghum in quails. Veterinary Sciences: Research and Reviews, 5(2): 33-42.
DOI | http://dx.doi.org/10.17582/journal.vsrr/2019/5.2.33.42
Keywords | Total tract nutrient retention, Apparent metabolizable energy, Wheat, Maize, Sorghum, Quail
Introduction
Poultry is a fast-growing industry in Pakistan (7.5-10% annual growth rate) which contributed 1.4% to the Gross Domestic Product (GDP) and 7.5% and 12.5% value added to Agriculture and Livestock respectively (Agricultural Statistics of Pakistan 2017-18). There is an increasing (4% per annum) demand for poultry meat and eggs (Pakistan Economic Survey 2017-18). Every effort has been made at the scientific, industrial and political level to cope with the emerging challenges of the poultry industry to ensure a safe supply of quality poultry products to the consumers. Apart from the traditional broiler and layer farming new species of poultry has recently been introduced with the claim of more nutritious and health products. The adoption of quails, ducks etc as the business enterprise has still many limitations but scientists are doing their best to cope with all the nutritional and health problems to make possible most economical and efficient farming. More recently the introduction of quails farming in the Khyber Pakhtunkhwa has gained considerable popularity.
Japanese quails are now being used for commercial purposes. They are smaller in size, adapt well to the intensive farming system and possess a distinctive feature of quick growth rate. They attain sexual maturity at an early age while the rate of egg production is also very high. Moreover, they are comparatively more resistant to different diseases. The introduction of Japanese quail farming as an enterprise has opened new doors for investment and food for human consumption. Among the other limitations, understanding of the nutritional requirements and formulation of a balanced diet for quails in our local environment is a big challenge.
The quails require six (water, carbohydrate, protein, fat, vitamins and minerals) important nutrients for their physiological activities. The metabolizable energy of feed directs the intake by the birds. Other factors which affect the intake include age, their physiological status, and the environmental temperature. In temperate regions of the world, the recorded energy requirement of the quails is 2,600 to 3,000 kcal ME/kg of feed required for growth purpose (Altine et al., 2016). Moreover, the requirement in the tropical regions is a bit lower i.e. 2,800 kcal ME/kg to quails at the growing stage while 2,550 kcal ME/kg are required for laying quail birds (Shim, 2006). Nutrient requirement of chicken with different ages is updated frequently through various research institutions like Nutritional Research Committee (NRC) worldwide. However, little is known about the nutritional requirements of quail.
Presently most of the quail farming rely on the diet formulated for broilers that are not according to the requirements of quail birds. Due to this and some other dietary complications, the growth potential of Japanese quails cannot be fully exploited. It is also pertinent to mention that there is always a range in the nutrient composition of cereal grain from different varieties (Ridley et al., 2004). The availability of nutrients from different cereal grains and their varieties is not only dependent on the level of nutrient itself but also the type and level of various anti-nutritional factors, which may have an impact (Butler et al., 1984; Nyamambi et al., 2007). A complete understanding of the nutrient digestibility from different cereal grains and varieties is warranted for economic ration formulation to prevent the losses and to keep our environment safe with reduced losses of nutrients in the effluent.
The current research was formulated to find out the digestible nutrients from different cereal grains and their varieties are same or different by quail birds at day 42. The goals of this study were to determine the nutrient profile of different cereals plus their varieties, evaluation of total tract nutrient retention of different nutrients and assessment of apparent metabolizable energy of different cereals and varieties by quails.
Materials and Methods
Ethical approval
These experiments were approved by ethical committee meetings at The University of Agriculture, Peshawar.
The present experiment was conducted at Faculty of Animal Husbandry and Veterinary Sciences (FAHVS), Department of Poultry Sciences, The University of Agriculture, Peshawar. The trials were performed at University poultry farm while samples were collected and other analyses were done at Animal Nutrition labs of this University and Nuclear Institute for Food and Agriculture, Peshawar.
Experimental animals
Two hundred and seventy (270) Japanese quail birds were purchased from local market and were placed in specialized cages at University poultry farm. The quails were categorized into three groups, and six subgroups (each for a separate variety) i.e. W1, W2, M1, M2, S1 and S2. Each group contained three replicates and each replicate contained fifteen (15) quail birds.
| Group | Subgroup (variety) | Replication | ||
| Wheat | W1 | R1(15) | R2(15) | R3(15) |
| W2 | R1(15) | R2(15) | R3(15) | |
| Maize | M1 | R1(15) | R2(15) | R3(15) |
| M2 | R1(15) | R2(15) | R3(15) | |
| Sorghum | S1 | R1(15) | R2(15) | R3(15) |
| S2 | R1(15) | R2(15) | R3(15) | |
Selection of grains
Frequently available wheat cultivars (Siren, 2010 and Saleem, 2000), maize cultivars (Sarhad Yellow and kissan) and sorghum cultivars (Johar and N.A.R.C--96) were selected for the current study. These cereals were purchased from the Cereal Crop Research Institute Pir Sabaq, Nowshehra. The composition of nutrients of all selected cultivars of three cereals was analysed in the labs of Animal Nutrition Department and results are shown in Table 1. The cereals were ground to a specific particle size and fed to the quail birds. Data was recorded regarding grains offered, refused and faeces collected.
Table 1: Nutrient levels of selected cultivars on basis of dry matter.
| Nutrient | Maize | Wheat | Sorghum | |||
| M-1 | M-2 | W-1 | W-2 | S-1 | S-2 | |
| Dry Matter | 94.56 | 93.86 | 92.06 | 92.09 | 93.05 | 92.85 |
| Organic Matter | 97.02 | 96.62 | 97.57 | 96.47 | 96.67 | 97.87 |
| Protein | 8.21 | 8.05 | 12.15 | 11.89 | 10.41 | 9.89 |
| Fat | 3.8 | 4.1 | 1.8 | 1.6 | 3.4 | 3.7 |
| Crude Fiber | 2.4 | 2.1 | 2.3 | 2.4 | 2.1 | 2.3 |
| Total P | 0.41 | 0.35 | 0.36 | 0.39 | 0.29 | 0.32 |
| Ca | 0.04 | 0.05 | 0.06 | 0.05 | 0.04 | 0.03 |
| Phytate | 0.72 | 0.71 | 0.78 | 0.80 | 0.85 | 0.87 |
| Crude ash | 2.18 | 2.08 | 2.03 | 2.13 | 2.17 | 2.09 |
| Gross energy(Kcal/kg) | 4166 | 4170 | 3917 | 4017 | 3962 | 3892 |
| Gross energy (MJ/kg) | 17.04 | 16.98 | 16.85 | 16.89 | 16.57 | 16.27 |
Sampling and measurements
The daily feed offered, feed intake and feed refused was recorded. A period of adaptation of four days was given. The samples were collected for six days. The collected fresh fecal samples were weighed and placed in plastic bottles. The samples were then pooled and dried in oven for further lab analyses. Likewise, representative samples of cereals used as feed were also taken and stored for further lab analyses.
Lab protocols and chemical analyses
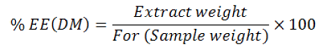
Analysis of dry matter and ash: The assessment of DM and ash content was analysed as follows; pre-weighed and clean crucibles were used in the analysis. One gram of sample weighed (duplicate) in pre-weighed crucibles. Then these samples were dried in oven. The time used to dry samples was 18 hours and the temperature was kept 100 °C. Later on the temperature of the samples was decreased to ambient temperature in desiccator for 30 minutes. The samples were again re-weighed. The percentage of the DM was calculated through formula observed below.
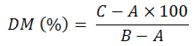
A= empty weight; B= crucible weight + sample weight (before drying); C= crucible weight + weight of sample (after drying).
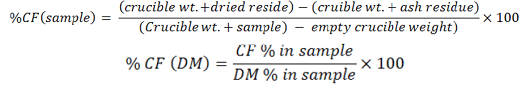
All the samples were burnt in furnace to find out the ash contents. The temperature was kept at 550°C. The time for incineration was six hours. The temperature was then lowered to 200-300°C. The samples were then placed at room temperature for one hour to decrease the temperature and were again weighed. The ash contents were calculated as follows:
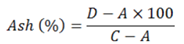
A= empty crucible weight; C= crucible weight+sample weight (after drying); D= crucible weight + ash.
The calculation of organic matter is calculated as follows:

Crude protein
Kjheldal Method was used to determine crude protein value of feed and faeces (AOAC, 2000). The duplicate samples (0.5 gm.) were taken in digestion tubes called as tecater tubes. The concentrated sulphuric acid was used to digest the samples. 5 gram of catalyst viz; potassium sulphate 93% plus copper sulphate 7% along with 10 ml of sulphuric acid were added. 0.1 gram of Acetenalide was used to recover the nitrogen contents. Tecater tubes were continuously turned while preventing froth production. The heated tubes were then cooled to room temperature while present in digestion blocks. 15 ml of distilled H2O was poured into samples containing tubes. About 4-5 ml of NaOH solution was poured slowly to the digested samples to make then alkaline. These samples then were distilled up to 7 minutes. 2% of 10 ml boric acid containing 3-4 drops of methylene red (as indicator) was placed in conical flask to collect produced ammonia. The distilled contents then titrated with reference to 0.5 N of sulphuric acid. A blank was also run containing 15 ml of distilled water and 5 ml of NaOH.
The percent nitrogen was perceived as below:

V1= reading of sample titrated; V2= reading of blank titrated; 14.01= Nitrogen’s atomic weight (N).
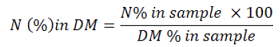
The level of crude protein in the samples of faeces and feed were determined by multiplying of samples nitrogen contents with factor 6.25.
The corrected results were obtained for DM as follows:
Ether Extract (EE)
Soxlet apparatus was used for the analysis of Ether Extract. About 2-4 gram of sample dried in oven was placed in pre dried thimble extractor provided with Whattmann paper and was cotton plugged. The thimble kept under condenser in apparatus while petroleum was evaporated. As soon as the extractor was filled up to the mark, about 150 ml of solvent was poured into receiver flask and was adjoined to it. Water and heat source were continuously on and process of extraction was continuous up to ten hours while the condensation rate was observed 3-4 drops per second after this thimble and extractor were separated. It was made sure that process was haltered before complete drying of the solvent. After it the extracted component was shifted to a clean basin for evaporation. Washings with ether were also done. Water bath was turned on and it was dried completely. The same basin was held in oven for two hours at a temperature of 105 °C. It was cooled while placing it in desiccator for 30 minutes and was re-weighed. Ether extract value was calculated from the formula given below:
Crude fibre
A number of tall beakers were used to process dried feed and faecal sample (1-2 grams). Diluted sulphuric acid was added at boiling stage and continued boiling to 30 minutes. The extraction apparatus of crude fibre was utilised for this purpose. The Buchner funnel was used to filter digested extract while suction pump was used to enhance the process. It was then washed with warm water to make acid free which was indicated by the pink colour produced by 1,1 drop of phenolphthalein and NaOH (N/10). The tall beakers were again used and processed samples shifted to it with addition of 200 ml diluted boiling NaOH poured in it and the digestion was continued for 30 minutes. Then samples were filtered and about 10 ml diluted and hot sulphuric acid was included and the digested samples were washed with warm water to free it from acidity which then shifted to Gouch crucibles and was washed with 10 ml ethanol which were then dried for a duration of two hours at 135 °C. Before ignition of samples in the muffle furnace at a temperature of 600 °C for 30 minutes’ samples were cooled and weighed. Temperature of ignited samples was lowered down by placing it in desiccator for an hour and weighed again.
%CF was obtained through formula given as:
Nitrogn Free Extract (NFE)
When all components were analysed and calculated, the NFE was calculated through formula mentioned below:

Inorganic components analyses
About 300 mg of dried (65 °C/48hour) and ground (0.5mm size) samples of cereal grains, their varieties and faeces collected were taken in to 20 ml tubes calibrated for digestion through 70% Nitric acid (6ml) overnight per sample. A two ml of perchloric acid (70%) was also added to each tube. The tubes were filled up to 20 ml marking. Initially, each of the tube was placed at 85°C up to 45 minutes which was then increased to 110 °C for 120 minutes in Al. digestion block (Equilaab AIM 600, Canada). To evaporate all of the nitric acid, temperature was increased to 160°C. When the digestion process completed, block was cooled down until room temperature was attained then un-ionised water was filled in each tube to graduation mark. The samples were placed to settle and supernatant shifted to 25 ml tubes. Spectrophotometry was performed to measure absorbance level for calculation of Ca and P levels of grains along with faeces.
Phytate analysis
Phytate contents of ingredients and digesta were analysed using the calorimetric method of Haug and Lantzsch (1983). A 60 mg of ingredient and digesta samples were extracted in 20 ml 0.2N HCL for three hours and vortexed. From the extract 1 ml was taken in a test tube and to it 2 ml of ferric solution was added. All the tubes were placed in boiling water for 30 minutes (make sure that tubes are well stoppered first 5 minutes). All the tubes were removed and cooled down to room temperature. These samples were centrifuged for 30 minutes and two ml of supernatant was transferred to another tube to which 3 ml of bipyridine solution was added. Absorbance was measured at 519 nm against distilled using a spectrophotometer (UV-1800, Shimadzu Japan). The values of absorbance obtained from test samples were fitted in the calibration curve model (obtained using standard reference solution with known amount of phytic acid) to calculate phytic acid contents.
Calculation of nutrients digestibility coefficients and apparent metabolizable energy
Nutrient digestibility (%): Nutrient digestibility coefficients were calculated by the difference between the nutrients consumed and voided in faeces by the birds using the following equation.

Where;
A= Quantity of nutrients consumed by the bird; B= Quantity of nutrients voided in faeces.
Apparent metabolizable energy: The AME (MJ /kg DM) contents from different grains and feces were obtained through calculating difference vide total collection formula narrated below:
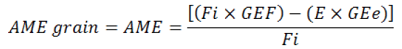
Where;
AME: (kcal/gm); Fi: Feed intake in gm; E: Excreta in gm; GEf: Feed sample Gross Energy (kcal/gm); GEe: Excreta Gross Energy (kcal/gm).
Digestibility and AME estimation
Co-efficient of digestibility: The difference of nutrients consumed and faeces voided was considered as principle for co-efficients calculation. The following was used:
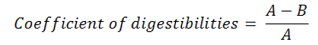
Where as;
A= Amount utilised (nutrients from feed); B= Amount voided (nutrients in faeces).
AME calculation
Data about presence of above parameter in each sample was generated through equation below:

Statistics
The design of the study was Completely Randomized Design (CRD) and the experiment was a factorial experiment (3 x 2) with three factors (wheat, maize, sorghum) and two levels (varieties) of each factor and three replications. The experiment had three groups (wheat, maize, sorghum) and six subgroups (varieties). The data was arranged in Microsoft Excel (2007). Proc-mixed analytic technique was utilised to obtain cereal effect viz. wheat, maize and sorghum (SAS-2000 ANOVA) (Littell et al., 2006).

Where;
Yijkl, response to treatments; µ, total mean; Ci, cereals effect; Vj, variety effect; CVk, variety-cereal effect; €ijk, to measure in-accuracy.
Results and Discussion
Concentration and levels of various nutrients in all selected cultivars of the three kinds of cereal in the current study are shown (Table 1). It is pertinent to mention that the fat percentage in Sarhad white (4.1%) was a bit higher than yellow corn i.e. 3.8 %. However, the gross energy was found higher in yellow corn (17.04 MJ/kg) compared to Sarhad white (16.95 MJ/kg). While compared to other grains the fat was higher in corn (4.1%) and Gross energy (17.04 MJ/kg) than that of sorghum and wheat also. The protein levels in wheat varieties were 12.15 and 11.89% which was more than that of both corn cultivars (8.21 and 8.05% respectively) and sorghum varieties (10.41 and 9.89% respectively). The phytate contents were found highest in both varieties of sorghum (0.85 and 0.87% respectively) as compared to the wheat varieties (0.78 and 0.80% respectively) and corn varieties (0.72 and 0.71% respectively). The values for various nutrients in all cultivars of wheat, maize, and sorghum are within the range specified by NRC (1994).
It is evident from the values presented in Table 2 that the availability of DM to quails was significantly more from maize than wheat and sorghum respectively. The maize cultivars are more digestible than other cereals. Furthermore, it was observed that the interaction among cereals and their varieties is highly insignificant which proves the similarity of DM digestibility among cultivars.
Table 2: Total tract dry matter, Organic matter and Nitrogen retention of selected cultivars of maize, wheat and sorghum by Japanese quails (Coturnex japonica).
| Cereal type | Cereal | Digestibility coefficient | ||
| Dry matter | Organic matter | Nitrogen | ||
| Maize | M-1 |
0.801a ±0.04 |
0.841a± 0.03 |
0.601a±0.04 |
| M-2 |
0.793a±0.03 |
0.836a±0.02 |
0.593a±0.04 |
|
| Wheat | W-1 |
0.771b±0.02 |
0.811b ±0.05 |
0.571b±0.02 |
| W-2 |
0.786b±0.02 |
0.806b±0.03 |
0.562b±0.03 |
|
| Sorghum | S-1 |
0.779b±0.02 |
0.782c± 0.02 |
0.499c±0.03 |
| S-2 |
0.752c±0.03 |
0.779c±0.02 |
0.514c±0.02 |
|
Table 3: Total tract retention of Fat from selected cultivars of maize wheat and sorghum by Japanese quails (Coturnex japonica).
| Cereal type | Cereal | Digestibility coefficient | ||
| Fat | Ash | Fibre | ||
| Maize | M-1 |
0.761a ±0.04 |
0.612a± 0.02 |
0.632a ±0.04 |
| M-2 |
0.759a±0.04 |
0.609a±0.01 |
0.629a±0.02 |
|
| Wheat | W-1 |
0.671c±0.02 |
0.571b ±0.01 |
0.601b ±0.03 |
| W-2 |
0.653c±0.03 |
0.565b±0.02 |
0.595b±0.01 |
|
| Sorghum | S-1 |
0.734b±0.03 |
0.541b ±0.03 |
0.591b±0.02 |
| S-2 |
0.707b±0.02 |
0.557b±0.03 |
0.612b±0.02 |
|
Retention and digestibility of OM from maize cultivars was higher followed by wheat varieties and sorghum varieties as presented in Table 3. Digestibility coefficients of OM among different varieties of cereal grains remained insignificant. However, the values were found significant (p<0.02) for cereal type. It is obvious from numerical data that OM was highly digestible in quail birds. The interaction of cereal type and cereal variety was found insignificant (P>0.05) showing that the variety has a lesser effect on OM digestibility than cereal type.
Digestibility of nitrogen was maximum for maize relative to wheat and sorghum cultivars in quail birds (Table 4). The retention was lowest from sorghum i.e. 0.499. Effect of variety on retention of nitrogen was not significant. However, it was significantly (P<0.05) different when different cereals were brought into consideration. Cereal-cultivar interaction was insignificant (P>0.05).
Table 4: Apparent digestibility of Ca, Phosphorus, AME and Phytate of different cereals and their varieties by Japanese quails (Coturnex japonica).
| Cereal type | Cereal | Digestibility coefficient | |||
| Ca | Phosphorus | AME | Phytate | ||
| Maize | M-1 |
0.612a±0.04 |
0.572a± 0.04 |
14.3a ±0.05 |
0.120a ±0.04 |
| M-2 |
0.603a±0.03 |
0.569a±0.03 |
13.9a±0.05 |
0.118a±0.03 |
|
| Wheat | W-1 |
0.581b±0.02 |
0.541b ±0.06 |
13.2b ±0.03 |
0.108b±0.04 |
| W-2 |
0.576b±0.01 |
0.537b±0.04 |
13.4b ±0.02 |
0.105b± 0.03 |
|
| Sorghum | S-1 |
0.568b±0.02 |
0.538b ±0.05 |
13.3b±0.03 |
0.115c±0.02 |
| S-2 |
0.571b±0.01 |
0.542b±0.03 |
13.1b ±0.04 |
0.113c±0.03 |
|
The coefficient of digestibility for both the varieties of maize was higher (0.761 and 0.759 respectively) followed by sorghum (0.734 and 0.707 respectively) and wheat varieties (0.671 and 0.653 respectively). (Table 3) Digestibility coefficient values among different cereals were significantly different for quail birds. The effect of various cultivars/varieties was not observable, moreover, their interaction was highly insignificant P>0.05.
It is evident from the table below that retention between cereals is significant (P<0.05) in maize cultivars (0.612 and 0.609), while wheat cultivars were second to maize (0.571 and 0.565) and lastly the sorghum cultivars (0.541 and 0.557), correspondingly. Ash digestibility of maize ranged from 0.612 and 0.609, wheat 0.571 and 0.565 and sorghum 0.541 and 0.557among different cereal varieties. The impact of cereal variety on the ash digestibility was very poor P>0.05. The interaction of cereal type and cereal variety was also found insignificant P>0.05 which shows that difference in cereal variety has nothing to do with digestibility coefficients. It’s the cereal type which significantly P<0.05 affects the digestibility coefficients of ash in quail birds.
It was observed that fiber digestion in maize cultivars was highest when compared to wheat and sorghum. The digestibility values were 0.632 and 0.629 for maize varieties, while wheat varieties yield a bit lower (0.601 and 0.595) CF than maize. Interestingly, white sorghum had higher (0.612) CF digestibility than red sorghum and wheat varieties; however, the cumulative effect of cereal varieties was statistically indifferent with P>0.05. The influence of cereal type on fiber digestion was significant P<0.05. However, nonsignificant difference P>0.05 was observed in the interaction of cereal type and their different varieties.
The digestibility coefficient of calcium among different cereals was significantly different in quails. Higher calcium digestibility (0.612-0.603) was recorded for maize as compared to wheat (0.581-0.576) and sorghum, the lowest, (0.568-0.571) in quails. However, this difference was found insignificant. Availability of calcium was highly significant among cereal types. However, the interaction between cereal type and their varieties was insignificant P>0.05.
It was found that retention of phosphorus is highly different between various cereals in quails P<0.05.Digestibility coefficient of phosphorus was highest for maize (0.572-0.569) followed by sorghum (0.538-0.542) and wheat (0.537-0.541). Digestibility of phosphorus varied numerically among various cereal varieties however it was found insignificant.
It is clear from the data that values observed are highly significant for maize (14.3-13.9 MJ/kg) compared to wheat (13.2-13.4) and sorghum (13.1-13.3) among quails. The value of AME for maize was higher i.e. 13.1-13.4 MJ/kg. The value for wheat is 12.5-12.8 MJ/kg. Similarly, the value for sorghum cultivars is 12.1-12.7MJ/ kg. Retention values show that there is no difference in varieties. Likewise, the variety-cereal impact was also not significant P>0.05. However, the AME value of different cereals was found highly significant P<0.05 in quail birds.
Results revealed that the digestibility of phytate is higher in maize as compared to wheat and sorghum. The effect of cereal was highly significant P<0.05 however the effect of variety shows a tendency towards significance (P value close to 0.05). Moreover, the interaction of cereal type is highly insignificant P>0.05. It is worth to mention that phytate phosphorus from maize and sorghum are more digestible in quails.
All the compositions of cereals under usage were observed in the range of NRC, 1994. It is pertinent to mention that nutrients from maize cultivars were more bio-available to quail birds when compared to wheat and sorghum in the present investigation. Choc et al., 2006 have observed that the value of AME for wheat is 12.2 MJ/Kg which is also comparable to the current study. The Fat was more digestible from sorghum than from wheat, however, other nutrients were more bio-available from wheat. Moreover, the nutrients from maize are more bio-available than wheat and maize cultivars/varieties (Nadeem et al., 2005) which is comparable to the observation of the current study.
Reports show that the presence of some anti-nutritional compounds in wheat halter availability of different nutrients. In connection to this, the low availability of energy from wheat is a result of non-starch polysaccharides. Increase in viscosity of digesta is also caused by high levels of NSPs which alters fat digestion (Hoai et al., 2011).
Gheeisari et al. (2003) evaluated the nutrient makeup of wheat and documented that it contains 3270kcal per kg of energy. He also furnished nutritional information and reported that wheat possesses about 7.8 % of moisture, 12 % CP, 202% fat and 3.5 % fiber. These findings are comparable to this work. However, in the present study, no significant difference was found in the digestibility coefficient of AME between both the varieties of wheat.
More than 70 % of the maize produced is proportioned in poultry formulations due to its superior nutritive parameters. The structure of maize granules is highly appreciated by digestive enzymes so maximum nutrients can easily be obtained from maize. Moreover, maize has no or less anti-nutritional factors which also a supporting comment for higher digestibility in maize.
Sorghum; a drought resistant cereal crop; however, have the capability of growth-supporting multiple environmental circumstances as compared to wheat and maize. It is the fifth most important crop around the globe in production (Mwithigaa and Sifuana, 2006). It is famous for its lower cost and comparable nutritive value and documented as the best replacement for maize. Moreover, its energy values are also somewhat similar to maize (Ali et al., 2009).
Selle et al. (2010) highlighted the consequences of sorghum usage in broiler feeding. Such diets resulted in improper growth performance of the broiler birds. He also enforced the idea that if we process the grains, it will improve performance however; this quality is also related to the texture of grains used. As a matter of fact, the vulnerability of sorghum to steam heat, the nutrient utilization can be improved through proper heat treatment and inclusion of protease enzymes.
Cultivars of sorghum having higher nutritional parameters can be best alternatives to maize as a source of energy (Oriia et al., 1995). When broilers were raised on maize, they showed superior results than birds raised on sorghum grain (Mohmmad et al., 2015). Presence of kafirin is a detrimental factor in low protein and other nutrients digestibility. As a result of lower proteins, digestibility from sorghum lowers its feeding value up to 5% when matched with maize (Roonney and Pfligfelder, 1998). Presence of a lower quantity of fat and starch in sorghum endosperm causes a lower release of energy from it which ultimately results in a lower digestibility (Weurding et al., 2001).
Sultan et al. (2014) observed the chemical profile of sorghum showing 12.5 % of crude protein and up to 37 % of fat. The fat and protein contents are in line and comparable to the results rose from the current study.
The digestibility of Ca and P can be altered by various nutritional and exogenous factors. The values rose by Ravindran and Thomas (2010) justify the results of the current investigation viz. 0.45 in Ca and 0.50 in P. Method of sample analysis and site of sample collection are detrimental factors in measuring of differences between digestibility and retention. The use of exogenous phytase has considerably increased the bio-availability of Calcium and Phosphorus (Selle and Ravindran, 2007).
Conclusions and Recommendations
The maize cultivars were more bio-available from every aspect when compared with wheat and sorghum and wheat cultivars/varieties. It has been assumed that bioavailability of phytate-phosphorus is comparatively higher than other poultry species particularly broilers.
Acknowledgments
We highly acknowledge The Department of Animal Nutrition and Department of Soil Sciences of The University of Agriculture Peshawar for providing their labs for sample analyses. Also acknowledge Center of Animal Nutrition, Livestock Research and Dairy Development Department Khyber Pakhtunkhwa and Nuclear Institute for Food and Agriculture Peshawar for providing their lab facilities without which it was an indispensable work.
Author’s Contribution
MS and AS designed the study. MS collected materials and conducted trials. Moreover, MS analyzed samples, done lab work. MS and AS analyzed data. SSAS, MS, and AK participated in tabulation and write up of the manuscript. All authors read the final manuscript and approved.
References
Ali, I., J.P. Fontenot and V.G. Allen. 2009. Palatability and dry matter intake by sheep fed corn stover treated with different nitrogen sources. Pak. Vet. J. 29: 199-201.
Altine, S., M.N. Sabo, N. Muhammad, A. Abubakar and L.A. Saulawa. 2016. Basic nutrient requirements of the domestic quails under tropical conditions: Rev. World Sci. News. 49: 223-235.
Annison, G. and M. Choct. 1991. Anti-nutritive activities of cereal non-starch polysaccharides in broiler diets and strategies minimizing their effects. World Poult. Sci. J. 47: 232-242. https://doi.org/10.1079/WPS19910019
Butler, L.G., D.G. Reidl, D.G. Lebryk, H.J. Blytt. 1984. Interactions of proteins with sorghum tannin; mechanism, specificity and significance. J. Am. Oil Chem. Soc. 61: 916–920. https://doi.org/10.1007/BF02542166
Pakistan Eonomic Survey. 2017-2018. Ministry of national food security and research GoP, Islamabad. p. 29.
Gheisari, A., R. Bahadoran and S.S. Tadayonfar. 2003. Determination of chemical composition and suitable levels of wheat feed screening and macaroni wastes in broiler chick diets. JWSS. 7(2): 161-170.
Gikuru, M. and M.M. Sifuna. 2006. Effect of moisture content on the physical properties of three varieties of sorghum seeds. J. Food Eng. 75: 480-486. https://doi.org/10.1016/j.jfoodeng.2005.04.053
Haug, W. and Lantzsch, H.J. 1983. Sensitive method for the rapid determination of phytic acid in cereals and cereals products. J. Sci. Food Agric. 34: 1423-1426. https://doi.org/10.1002/jsfa.2740341217.
Hoai, H.T., L.V. Kinh, T.Q. Viet, P.V. Sy, N.V. Hop, D.K. Oanh and N.T. Yen. 2011. Determination of the metabolizable energy content of common feedstuffs in meat-type growing ducks. Anim. Feed Sci. Tech. 170: 126–129. https://doi.org/10.1016/j.anifeedsci.2011.07.015
Mwithiga, G., and Sifuna, M. M. 2006. Effect of moisture content on the physical properties of three varieties of sorghum seeds. J. Food Eng. 75(4): 480–486. https://doi.org/10.1016/j.jfoodeng.2005.04.053
Nadeem, M.A., A.H. Gilani, A.G. Khan and M.U. Nisa. 2005. True metabolizable energy values of poultry feedstuffs in Pakistan. Int. J. Agric. Biol. 7: 990-994.
National research council. 1994. National academy press, Washington, D.C. 9th Revised edition. p. 234.
Nyamambi, B., L.R. Ndlovu, Y. Naik and D. Kock. 2007. Intestinal growth and function of broiler chicks fed sorghum based diets differing in condensed tannin levels. S. Afr. J. Anim. Sci. 37 (3) 203-2014. https://doi.org/10.4314/sajas.v37i3.4092
Oria, B., P. Maria, R. Hamaker and J.M. Shull. 1995. Resistance of sorghum. Alpha beta and gamma. Kafirins to pepsin digestion. J. Agric. Food Chem. 43: 2148–215. https://doi.org/10.1021/jf00056a036
Ridley, P.W., R.D. Shillito, I. Coats, H.Y. Steiner, M. Shawgo, A. Phillips, P. Dussold and L. Kurtyka. 2004. Development of the international life sciences institute crop composition database. J. Food Compos. Anal. 17: 423–438. https://doi.org/10.1016/j.jfca.2004.03.006
Rooney’s, L.W. and R.L. Pflugfelder’s. 1986. Factors affecting starch digestibility with special emphasis on sorghum and corn. J. Anim. Sci. 63: 1607-23. https://doi.org/10.2527/jas1986.6351607x
Selle, P.H., D.J. Cadogan, X. Li and W.L. Bryden. 2010. Implications of sorghum in broiler chicken nutrition. Anim. Feed Sci. Technol. 156(3-4): 57–74. https://doi.org/10.1016/j.anifeedsci.2010.01.004
Selle, P.H., V. Ravindren, G. Ravindren and W.L. Bryden. 2007. Effects of dietary lysine and microbial phytase on growth performance and nutrient utilisation of broiler chickens. Asian-Aust. J. Anim. Sci. 20: 1100–1107. https://doi.org/10.5713/ajas.2007.1100
Shim, K.F. 2006. The nutrition and management of Japanese (Coturnix) quail
in the tropics. http://www.shaywood.com/quail/coturn1.htm (march 5, 2013).
Sultan, A., U. Rizwan, S. Khan, M.T. Khan, H. Khan and I.U. Zaman. 2014. Nutrient digestibility values and apparent metabolizable energy of corn, wheat and sorghum by pheasants (Phasianus colchicus). Pak. Vet. J. 34: 479-483.
Thomas, D.V. and V. Ravindran. 2010. Mineral retention in young broiler chicks fed diets based on wheat, sorghum or maize. Asian-Aust. J. Anim. Sci. 23(1): 68 –73. https://doi.org/10.5713/ajas.2010.90129
Weurding, R. E., Veldman, A., Veen, W. A. G., van der Aar, P. J., and Verstegen, M. W. A. 2001. Starch Digestion Rate in the Small Intestine of Broiler Chickens Differs among Feedstuffs. J. Nutri. 131(9): 2329–2335. https://doi.org/10.1093/jn/131.9.2329
To share on other social networks, click on any share button. What are these?