
The Decision to Participate in High Value Marketing Channels: An Analysis of Smallholder Farmers in Pakistani Citrus Industry


Research Article
The Decision to Participate in High Value Marketing Channels: An Analysis of Smallholder Farmers in Pakistani Citrus Industry
Asif Yaseen1, Muhammad Israr2*, Allah Bux Khan1, Ahsan Javed3, Nafees Ahmad4 and Zia Ullah5
1Department of Commerce, Bahauddin Zakariya University, Multan, Pakistan; 2The University of Agriculture, Peshawar, AMKC, Mardan, Pakistan; 3Noon Business School, University of Sargodha, Pakistan; 4Department of Economics, University of Malakand, Pakistan; 5Department of Tourism and Hospatility Managemnt, AWKU Mardan, Pakistan.
Abstract | The purpose of this research is twofold. First, analyzing smallholder famers’ selection of high value marketing channels to boost self-sufficiency in the Pakistani Citrus industry, and second, to identify the issues of greater importance pertaining to famers’ selection of high value market channels in the Pakistani citrus industry. The study employed survey technique to collect data from 300 citrus farmers in Punjab, and multinomial treatments effects were used to analyze the data. The results indicated though participation in traditional marketing channels (with intermediaries) is still profitable, high value marketing channels appeared more attractive alternative, having been shown to offer increased net income to smallholder citrus growers. Findings showed the importance of production experience and know-how of quality issues are the significant determinants of farmers’ reliance on high value marketing channels. To this end, policy makers need to give due consideration to certain exogenous factors such as price expectation, delay of payment, trust in buyer, price fluctuation, and provision of farm services.
Received | August 03, 2019; Accepted | January 08, 2020; Published | February 01, 2020
*Correspondence | Muhammad Israr, The University of Agriculture, Peshawar, AMKC, Mardan, Pakistan; Email: misrar@aup.edu.pk
Citation | Yaseen, A., M. Israr, A.B. Khan, A. Javed, N. Ahmad and Z. Ullah. 2020. The decision to participate in high value marketing channels: an analysis of smallholder farmers in Pakistani citrus industry. Sarhad Journal of Agriculture, 36(1): 198-209.
DOI | http://dx.doi.org/10.17582/journal.sja/2020/36.1.198.209
Keywords | Pakistani citrus industry, Growers, Processor-oriented marketing channel, Contractors-oriented marketing channel, Multinomial treatment effects
Introduction
In recent past, smallholder farmers are interested to participate in direct markets alternatives of High-Value Agricultural (hereafter HVA) products (Gogh and Aramyan, 2014). HVA products include cereals, horticultural produce, milk, meat, and eggs etc. Continuing population and consumption growth of HVA commodities highlight the need for developing direct market channels thereby providing opportunities for smallholders to participate in these alternative direct markets. Therefore, the growth of HVA commodities recommended the ominous need for strong linkages between all agri-food supply chain actors; from farmers to processors and all other intermediaries to the end users, i.e., consumers (Gulati et al., 2007).
The challenges to pro-smallholder market participation in direct market alternatives are more pronounced in developing countries including Pakistan. The challenges include coordination of economic activities between primary producers and consumers in the agri-food supply chain, the growth plan of HVA commodities and the development of institutions for vertical coordination in the agri-food supply chain. To overcome the challenges, there is a need for strong vertical linkages between farmers and other stakeholders in the agri-food supply chains. But in most of the cases, smallholders are incapable of encountering the modern supply chain (MSC) demands and measures with respect to food quality and safety and the challenges are compounded by the incidence of non-commercial motives of farmers.
Paradoxically, empirical horticultural produce research devoted to the study of participation of stallholder farmers in the direct market alternatives remains scanty. The limitations faced by smallholders caused the exclusion of smallholders from the modern agri-food supply chains from the profitable niche markets because of the quality production and safety regulations required by different Modern Supply Chains to meet the global demand (Heijden and Vink, 2013; Rao and Qaim, 2011; Schuster and Maertens, 2013; Swamy and Dharani, 2016). Conversely, Barrett et al. (2012), Minten et al. (2009), Birthal et al. (2017) and Montalbano et al. (2018) described the successful cases for smallholder’s inclusion in the MSC with the help of innovative institutional roles such as contract farming.
Several consideration such as financing, production and market strategy become important when choosing the appropriate market channels to sell the produce. In Pakistan, there is a disappointing effect of development interventions which proved less consonant with the ways in which rural farmers, 90 percent of which make their living at subsistence level and in some cases at a commercial level to earn higher profits (Naseer et al., 2016). The agricultural marketing system of Pakistan is dominant with the traditional marketing system where commission agents (Aarthi) and other market intermediaries interact with growers ranging from the input suppliers to the end customers (Haq et al., 2013). This traditional marketing system of agri-food products and the commercialization by smallholders have some negative impacts that resulted in the market reduction, and smallholders comprise with middlemen, small retailer, the street vendor, and wholesaler at rural level (Chen et al., 2015a; Chen et al., 2015b).
Against this backdrop, the objective of the study was to analyze the income differentials between the citrus growers in Pakistan, selling through traditional and high value marketing channels. Producers. Currently, in Pakistan, the citrus supply chain studies are limited to the marketing margins, citrus supply chain constraints analysis, factors impeding the supply chain development, and post-harvest losses in citrus production (Siddique et al., 2018). Therefore, in this study, the theoretical prediction of marketing channels choice were tested using multinomial logit modelling. To fill such type gaps, this approach was also narrated by Reardon et al. (2009) in the case of P.R. China. Similarly, the study aimed to analyze the determinants of participation in the modern supply chain by the Pakistani citrus growers for their inclusiveness and efficiency.
Pakistan is the 13th largest producer of citrus (FAO, 2018), and citrus is the leading fruit in term of production, i.e., 2.36 million tons is produced from an area of 206.6 thousand hectares (Memon, 2017; Naseer et al., 2018). In Pakistan, mandarin (local name is Kinnow) is produced about 90.6 percent of the total citrus growing area (GOP, 2018c). The application of modern techniques at all stages of production and the post-harvest phase could not only add value to the fruit to attract premium price but also increase export volume to earn foreign exchange (Memon, 2017). The citrus market in Pakistan is broadly segmented in traditional or informal and modern or formal supply chains (Siddique, 2015). The traditional supply chains (TSC) include direct sales as village retailers, sales to local intermediaries and sales at traditional fruit and vegetable markets. The modern supply chains (MSC) include the sales to the traders or contractors and local processors or juice manufacturing factories, from where it is processed in different juices or exported after waxing and processing by increasing its shelf life.
The remainder of the paper is organized as follows. After presenting the background and objective of the study, the following section gives an overview of the methodology including data collection and analytical framework. The methodology section is followed by reporting and discussing the results of multinomial logit regression. The last section provides concluding remarks and policy recommendations.
Materials and Methods
The study was carried out in the Punjab Province of Pakistan that can be traced from the study area map in Figure 1. Punjab is the largest province in terms of population and second largest in term of the area (Naseer et al., 2016; GOP, 2018d). Punjab’s share in agricultural GDP is also the highest among all other provinces (GOP, 2018b). Similarly, Punjab is the largest producer of mandarin, i.e., more than 98 percent of mandarin is produced in the province (Memon, 2017). During 2017-18, total production of citrus in Punjab was 2.12 million tons out of which 1.12 million tons, i.e., about 53 percent only came from Sargodha district out of 37 districts of Punjab (GOP, 2018a). Therefore, district Sargodha was purposely chosen for this study.
Sampling procedure
A multistage sampling technique for better representation of the study area as shown in Figure 2. In the first stage, district Sargodha was purposely selected due to the most significant district in terms of production, in the second stage three Tehsils, i.e., Bhalwal, Kotmomin and Sargodha were randomly selected. In the third stage, ten villages from each tehsil were randomly the chosen, and in the final stage at least 10 respondents from each village were interviewed through a well-structured questionnaire. Thus, the study used a sample size of 300 respondents including a mix of traditional and modern supply chain participants representing all farm size categories of the small, medium, and large.
Profitability analysis
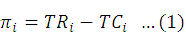
Cost and revenue theories suggested the following formula to calculate the profit (Mankiw, 2014; McConnell and Brue, 2005).
Where;
πi denoted the profit in mandarin farmers participating in the ith supply chain, TRi represented the total revenue and TCi represented the total cost incurred by the farmers participating in that chain, which was calculated as following:

Where;
TFC and TVC represented the total variable and fixed costs, respectively. And the total revenue was calculated as:

Where;
Q is the total sale of the mandarin product and P is the respective price of the mandarin. Following the Mehdi et al. (2016), study did not use the fixed cost incurred in the production of the mandarin, e.g., the machinery purchased by the farmer, cost incurred in the establishment of the mandarin orchard including land, time, and plantation etc. which were covered overtime and remain constant for traditional and modern supply chain participants. The total variable cost was divided into four major portions which are the pre-harvest cost, post-harvest cost, logistic cost, and the opportunity cost of the farmer. These were described as follow:

Where;
PRHC was the pre-harvest costs and the POHC was the post-harvest costs, logistics costs incurred by growers was denoted by LOGC and the working capital defined as the opportunity costs were denoted by WCOC. These costs were derived as follow:

Where;
PLC denoted ploughing cost, IRC represented the irrigation cost, FRC and FYM represented cost of fertilizer and farmyard manure, PSC represented the pesticides/chemical cost, PRC denoted the pruning practices cost, and LBC represented the labor cost.
Post-harvest costs are calculated depending upon the practices undertaken by the citrus farmers participating in different supply chains. Detailed components of these activities are illustrated below.

Where;
HPC represented the cost of harvesting and pruning, GRC denoted the grading cost of citrus, WAC represented the washing and waxing cost if any, PKC and PMC represented the packaging labor cost and packaging material cost respectively.
After these, all calculations the benefit-cost ratio of the farmers participating in different supply chains were calculated by the following formula.

In this way, the efficiency indicators like profitability, yield, and price were also categorized across different supply chains. Further, the analysis would be enhanced to characterize and map the citrus supply chain.
Multinomial treatment effects model
Field surveys showed that mandarin producers sell their produce to the pre-mature contractors; village retailers, vendors or consumers; middlemen or commission agents; fruit and vegetable markets; processors, factories or exporters. The impact of the farmer’s choice of the supply chain on their efficiency and performance was assessed by using the following form of the linear regression model:

Here Yi represents the profit of mandarin producers. Profit or the yield is considered as the important indicators of efficiency in supply chain studies (Birthal et al., 2017). In Equation 9, Xi is a set of independent variables used in the study, i.e., farmer’s and locational characteristics and Ti (i = 1 to 5) is the supply chain to which farmer is associated. The first three channels (T1 to T3) categorized in TSC and the last two channels (T4 and T5) categorized in MSC. Farmer’s choice of participation in a particular supply chain may be based on several unobservable characteristics, i.e., a partnership with other farmer’s group or self-selection of the supply chain may be influenced due to the skills of the supply chain management affecting farmer’s choice and efficiency. These unobservable characteristics caused the biased results of our estimate, i.e., α ’s would be biased. To capture this bias study followed Deb and Trivedi (2006a), Deb and Trivedi (2006b) and Birthal et al. (2017) and used multinomial treatment effects model in which multinomial choice selection equation was estimated in the first stage. The predicted values of the first stage was used as regressors in the second stage outcome equation. The advantage of multinomial over the ordinary least square is the explicitly model farmer’s choice of a supply chain.
Model specification
Each farmer i participates in the one supply chain (treatment) from a set of five choices, which typically includes a control group, implying a multinomial choice model. Let EV*ij denotes the indirect utility that farmers would obtain by selecting jth treatment, j = 0, 1, 2, …, J and

Where;
zi denotes the exogenous covariate with associated parameters αj and ηij, which are independently and indirectly distributed error terms. Also, EV*ij includes latent factors lij that incorporates unobserved characteristics common to farmers j’s treatment choice and outcome. The lij are assumed to be independent of ηij. Without loss of generality, let j = 0 denotes the control group and EV*i0 = 0. Let di be binary variables representing the observed treatment choice and di = (di1, di2,…. dij), and let li = (li1, li2,…. lij). Then the probability of treatment can be represented as:

Where;
g is an appropriate multinomial probability distribution. Specifically, it was assumed that g has a mixed multinomial logit (MMNL) structure, and is defined as;

The outcome (profit) is a count variable, i.e., yi= 0, yi=0, 1, 2,…..N. The expected outcome equation is formulated as;
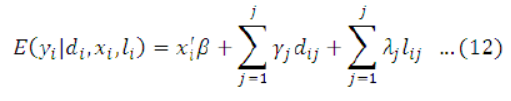
Where;
xi is a set of exogenous covariates with associated parameter vectors β and yj denoting the treatment effects relative to the control. E (yi ǀ di, xi, li) is a function of the each of the latent factors lij; i.e., the outcome (profit) is affected by unobserved characteristics that also effect selection into treatment (participation in the supply chain). When λj, the factor loading parameter is positive, the treatment and outcome positively correlated through unobserved characteristics, i.e., there is a positive selection and vice versa, with γ and λ the associated parameter vectors respectively. It assumes that f is the negative binomial-2 density,
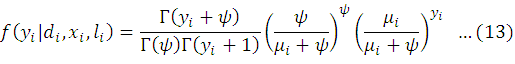
Where;

and
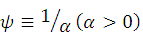
are the overdispersion parameters.
As the standard multinomial logit model, the parameters in the MMNL are identified only up to the scale. Therefore, normalization for the scale of the latent factors without loss of generality is required. It assumes δj =1 for each j but allow the researcher to change this constant. Also, although the model is identified when zi= xi, including some variables in zi that are not included in xi is usually preferable, identification via exclusion restrictions is the preferred approach. (Deb and Trivedi, 2006a; b).
For identification, the study used the distance of village farmer from the fruit and vegetable market and the location dummies as instruments in the selection equation. In both equations, i.e., selection and outcome, the study used the orchard size and total land size as the indicators of the scale of mandarin production which also capture the farmer’s endowments of resources in the choice of supply chain participation. A list of several other variables, including personal characteristics, e.g., age, education, information, awareness, etc., and household characteristics such as family size, total family income, labor availability, etc. used as independent variables.
Results and Discussion
Descriptive statistics of the important variables that potentially influence farmer’s choice of supply chain participation and subsequently the mandarin yield and profit are presented in Table 1. In general, the farmers associated with the modern supply chains (i.e., processors and contractors) have larger farm size, a higher level of education, higher mandarin orchard size, having more employed labor and near to the processing areas.
At the upstream of a supply chain product yield, profits and output prices are considered as the important indicators of supply chain efficiency. Yield represents the production efficiency indicator while profit and prices represent the economic and marketing efficiency indicators (Birthal et al., 2017). A comparison of these indicators associated with different supply chain participation was made in Table 2. Profit margins are estimated by deducting the per unit cost of production from the per unit revenues of the mandarin production. The average mandarin yield of 558.6 maund (40 kg) per ha is estimated of the farmers that were associated with the processors. It is also evident from the Table 2 that difference in mandarin yield across different farm size categories is very little, suggesting that mandarin yield is invariant to the scale of production perhaps due to little difference in the management practices. Similar results were also described by Birthal et al. (2017). But some studies found inverse productivity to size relationship in a similar type of studies (Sharma, 2015).
Table 1: Descriptive statistics of the variables used in the model.
| Variables | Mean | Std. Dev. | Min | Max |
| Small Farmers (< 5 ha) = 1, 0 otherwise | 0.327 | 0.470 | 0 | 1 |
| Medium farmers (5 to 10 ha) = 1, 0 otherwise | 0.410 | 0.493 | 0 | 1 |
| Large farmers (> 10) = 1, 0 | 0.263 | 0.441 | 0 | 1 |
| Farmer’s education (years) | 8.027 | 3.742 | 0 | 18 |
| Family size (No.) | 9.760 | 3.505 | 4 | 25 |
| Mandarin area (ha) | 4.966 | 2.082 | 0.80 | 12.14 |
| Main occupation (farming) = 1, 0 otherwise | 0.640 | 0.481 | 0 | 1 |
| Permanent farm worker (Yes) = 1, 0 otherwise | 0.420 | 0.494 | 0 | 1 |
| Extension information (Yes) = 1, 0 otherwise | 0.523 | 0.500 | 0 | 1 |
| Distance from the market (Km) | 13.020 | 4.299 | 2 | 23 |
| Agri Finance (Yes) = 1, 0 otherwise | 0.393 | 0.489 | 0 | 1 |
| Participation (1= modern, 0 = traditional) | 0.586 | 0.475 | 0 | 1 |
| Local consumers = 1, 0 otherwise | 0.040 | 0.196 | 0 | 1 |
| Local middlemen = 1, 0 otherwise | 0.193 | 0.396 | 0 | 1 |
| Fruits and vegetable markets = 1, 0 otherwise | 0.180 | 0.385 | 0 | 1 |
| Contractor = 1, 0 otherwise | 0.543 | 0.499 | 0 | 1 |
| Processors = 1, 0 otherwise | 0.043 | 0.204 | 0 | 1 |
| Sargodha = 1, 0 otherwise | 0.333 | 0.472 | 0 | 1 |
| Bhalwal = 1, 0 otherwise | 0.333 | 0.472 | 0 | 1 |
| Kotmomin = 1, 0 otherwise | 0.333 | 0.472 | 0 | 1 |
Table 2: Efficiency indicators at the upstream of the mandarin.
| Retailers/ Consumers | Middlemen/ beopari | Fand V markets | Contractors | Processors | Total | |
| Mandarin yield across the different supply chain and farm size (40 kg/hectares/season) | ||||||
| Farm Size | ||||||
| Small | 461.1 | 444.6 | 485.8 | 465.3 | 555.8 | 464.5 |
| (37.7) | (71.9) | (79.4) | (67.4) | (109.8) | (74.7) | |
| Medium | 515.6 | 456.0 | 497.4 | 478.0 | 559.9 | 476.9 |
| (68.2) | (74.8) | (72.5) | (68.9) | (57.8) | (72.7) | |
| Large | 494.0 | 422.8 | 533.1 | 491.4 | 558.8 | 496.7 |
| (55.5) | (69.1) | (64.6) | (70.9) | (73.3) | ||
| Total | 500.2 | 444.6 | 505.4 | 480.5 | 558.6 | 489.7 |
| (61.8) | (69.9) | (75.2) | (67.2) | (68.2) | (73.3) | |
| Sale price across different supply chains (USD/40 kg) | ||||||
| Small | 8.69 | 8.62 | 8.59 | 8.61 | 8.63 | 8.60 |
| (0.21) | (0.19) | (0.30) | (0.25) | (0.24 | (0.24) | |
| Medium | 8.53 | 8.54 | 8.57 | 8.70 | 8.54 | 8.61 |
| (0.14) | (0.34) | (0.51) | (0.81) | (0.15) | (0.65) | |
| Large | 8.52 | 8.56 | 8.74 | 8.63 | 9.00 | 8.64 |
| (0.33) | (0.30 | (0.27 | (0.50) | (0.31) | ||
| Total | 8.54 | 8.55 | 8.61 | 8.59 | 8.78 | 8.62 |
| (0.16) | (0.29) | (0.38) | (0.55) | (0.36) | (0.46) | |
| Profit margin across different supply chains (USD/hectares) | ||||||
| Small | 1342 | 1244 | 1427 | 1396 | 1748 | 1383.0 |
| (648.2) | (497.4) | (678.1) | (629.6) | (1313.7) | (686.4) | |
| Medium | 1959 | 1843 | 1912 | 1931 | 2224 | 1914.4 |
| (850.1) | (758.4) | (739.3) | (655.8) | (489.5) | (707.5) | |
| Large | 2098 | 1554 | 2586 | 2258 | 2960 | 2143.6 |
| (466.1) | (586.8) | (693.2) | (702.4) | (720.6) | ||
| Total | 1,679.1 | 1,467.6 | 1,761.4 | 2,320.4 | 2,601.0 | 2197 |
| (746.1) | (618.9) | (698.8) | (657.5) | (741.2) | (702.6) | |
Note: calculations were made at 1 USD = 123.15 PKR | figures in parentheses are standard errors.
The second part of Table 2 represents the mandarin sale price across different supply chains. The average price received across all supply chain within all farm size categories was 8.64 USD per mounds. If we talk about the different farm size categories, it is evident from Table 2 that large farmers receive the highest price as compared with small and medium farmers. Across different supply chains, farmers associated with the processors receive the highest prices. An interesting result in price table was seen as small farmers associated with the direct sale receive a high price than the average price. This supports the theory of lesser market intermediary with lesser marketing margins (Pokhrel and Thapa, 2007; Fournier, 2018; Arinloye et al., 2012).
By looking at the overall price table, there is a little variation ranging from the 8.52 to 8.70 USD which shows the trade competitiveness of the mandarin market. It supports the basic microeconomic theory of pure competition “there is a minimum variation in the prices when there is the presence of a large number of buyers and sellers in the market” (Friedman, 2017). The third portion of Table 2 presented the profit margins calculated extensively the farm survey across different supply chains. It is evident from the results that the modern supply chain gets more profit. In the traditional segment, small farmers sell directly in the villages earn more profits. However, across farm size categories large farmers get more profit.
Table 3 shows the economic analysis of the mandarin farmers according to their participation in the five different supply chains. The lowest per unit was seen in contractor’s category because farmer’s involvement is very less, and they know they have made a pre-mature contract with the contractor. The highest per unit mandarin yield was seen by the farmers who are associated with the processors for the sale of their produce. The reason behind this the association of large farmers with the processors. There were only 4% of farmers who were linked with the processors, and they have better management practices than the other farmers. Similarly, the highest prices get by the farmers who are associated with the processors followed by the farmers associated with fruit and vegetable markets, contractors, middlemen, and direct sale to retailers/consumers. The results of the benefit-cost ratio show that the farmers who are associated with the middlemen get a minimum return, i.e., 45 cents over 1 dollar of cost incurred. Highest returns were seen by the farmers who have associated with processors 1 dollar over 1 dollar of cost incurred.
Table 4 shows the results of the selection equation of the multinomial treatment effect model. These results are interpreted relative to the scale of processors that is considered as the base category in the model. The coefficient of village distance from the market in the nearest city is positive and significant in all supply chains, which implies a relatively higher probability to participate in these supply chains as compared with the processor’s category. It is also possible that if the processing industries are near to the farmers, they are more likely to participate in this category and vice versa. And the high competition there creates competition in the agribusiness processing industries offering better prices for the farmers. These results are consistent with the Birthal et al. (2017) in the milk value chain study and also justifies the price theory (Friedman, 2017).
The coefficient of farm size dummies is negative indicating the higher probability for large farmers to be associated with the processor category in the modern supply chain. The small farmer coefficient in case of direct sales to the village consumers, vendor or village retailer, is positive that means small farmers are more likely to associate with the informal supply chain. Further, the coefficient of the mandarin area (orchard size) is negative though only significant in contractor’s category. However, it suggests a higher probability of for large orchard size for mandarin fruits being associated with the modern supply chains the processor or contractor category. Hired labor is also an important indicator of farmers’ resource endowment, and the finding of the study suggest that mandarin farmers who have not to hire any labor are more likely to associate with the traditional supply chains and vice versa. These findings revealed that the resource-rich farmers are more likely to associate with the modern supply chains and the resource-poor farmers with the traditional supply chains. It can also be interpreted that modern supply chain buyers prefer to deal with the resource-rich farmers and the traditional sector buyers with the resource-poor farmers. These results are consistent with Slamet et al. (2017) and Birthal et al. (2017).
The regression coefficient of the farmer who has farming as the main occupation is negative and significant with TSCs, i.e., local middlemen and F
Table 3: Benefit cost analysis of mandarin according supply chain participation.
| Activity [unit] | Retailers/Consumers | Middlemen/ Beopari | Fand V markets | Contractors | Processors |
| Y [40kg/ha] | 500.4 | 444.8 | 505.6 | 480.5 | 558.8 |
| P [USD/40kg] | 8.54 | 8.55 | 8.61 | 8.59 | 8.78 |
| TR [USD] | 4,275.3 | 3,802.0 | 4,352.7 | 4,127.5 | 4,906.5 |
| GM [USD] | 2,566.6 | 2,319.6 | 2,596.8 | 3,150.9 | 3,477.3 |
| NM [USD] | 1,679.1 | 1,467.6 | 1,761.4 | 2,320.4 | 2,601.0 |
| (BCR) | 1.65 | 1.45 | 1.68 | 1.98 | 2.00 |
Table 4: Results of the selection equation of multinomial treatment effect model.
| Retailers/Consumers | Middlemen/Beopari | FandV markets | Contractors | |
| Farm size dummies (omitted = large) | ||||
| Small (≥ 5 ha) = 1, 0 otherwise | 0.0141 | -0.6116* | -0.5739 | -0.4681 |
| (2.1413) | (1.4177) | (1.5319) | (1.3546) | |
| Medium (5 to 10 ha) = 1, 0 otherwise | -0.0706 | 0.2657 | 0.0358 | -0.1532 |
| (1.705) | (0.9822) | (1.0725) | (0.9285) | |
| Farmer’s education (years) | 0.6353* | 0.0288 | 0.3826* | 0.2562* |
| (0.6177) | (0.2567) | (0.3372) | (0.2437) | |
| Farmer’s education squared | -0.0561** | -0.0032 | -0.0221* | -0.0149 |
| (0.0420) | (0.0163) | (0.0208) | (0.0154) | |
| Family size (No.) | 0.086 | 0.1149 | 0.0048 | 0.3226* |
| (0.6286) | (0.4167) | (0.4539) | (0.3862) | |
| Family size squared | -0.006 | -0.0003 | -0.0006 | -0.0076 |
| (0.0257) | (0.0162) | (0.0177) | (0.0146) | |
| Mandarin area (ha) | -1.0579 | -0.2672 | -0.7548 | -0.1754* |
| (2.2582) | (0.7752) | (0.9703) | (0.7621) | |
| Mandarin area squared | 0.2683* | 0.0289 | 0.0849* | 0.0194 |
| (0.2498) | (0.0578) | (0.0775) | (0.0579) | |
| Main occupation (farming) = 1, 0 otherwise | 0.1924 | -1.1137** | -0.8445 | 0.7741** |
| (1.3863) | (0.913) | (1.1021) | (0.8657) | |
| Permanent farm worker (Yes) = 1, 0 otherwise | -1.4974* | -1.2011* | 0.8992 | 1.5693** |
| (1.4622) | (1.052) | (1.2613) | (0.9958) | |
| Extension information (Yes) = 1, 0 otherwise | 0.1565 | -0.0616* | 0.0901 | 0.2138 |
| (0.9286) | (0.6629) | (0.739) | (0.6302) | |
| Agri Finance (Yes) = 1, 0 otherwise | -0.4450 | -0.0125 | 0.2361 | 0.2563 |
| (0.4442) | (0.3212) | (0.1122) | (1.2691) | |
| Distance from the market (Km) | 0.0358* (0.1060) | 0.0549** | 0.0009*** | 0.0401* |
| (0.0776) | (0.0871) | (0.0733) | ||
| Location dummies (omitted Kotmomin) | ||||
| Sargodha = 1, 0 otherwise | -1.0939 | 1.5662*** | 2.6167 | 1.7756*** |
| (2.343) | (0.7599) | (1.105) | (0.8455) | |
| Bhalwal = 1, 0 otherwise | -1.3595*** | -1.0656* | -1.19246 | -2.2001 |
| (1.067) | (1.067) | (31.067) | (1.067) | |
| Constant term | -4.203 | 1.7783** | 1.6283* | -0.4749*** |
| (6.983) | (4.0222) | (4.6932) | (3.8056) | |
Note: Base category: processors Standard errors are written in parentheses; ***, ** and * represents the level of significance at 1, 5, and 10 percent respectively.
Table 5: Second stage equation of multinomial treatment effects model.
| Independent variables | Ln (Profit) |
| Choice of supply chain = multinomial (omitted = processors) | |
| Local consumers = 1, 0 otherwise | -0.2659** (0.1351) |
| Local middlemen = 1, 0 otherwise | -0.4495*** (0.1015) |
| Fruits and vegetable markets = 1, 0 otherwise | -0.1855* (0.1103) |
| Contractor = 1, 0 otherwise | -0.1367 (0.0968) |
| Farm size dummies (omitted = large) | |
| Small (≥ 5 ha) = 1, 0 otherwise | -0.0265 (0.0545) |
| Medium (5 to 10 ha) = 1, 0 otherwise | -0.1295** (0.0753) |
| Farmer’s education (years) | 0.0197* (0.0179) |
| Farmer’s education squared | -0.0009 (0.0010) |
| Family size (No.) | 0.0153 (0.0231) |
| Family size squared | -0.0005 (0.0009) |
| Mandarin area (ha) | 0.0242** (0.0463) |
| Mandarin area squared | -0.0004 (0.0037) |
| Main occupation (farming) = 1, 0 otherwise | 0.0964* (0.0566) |
| Permanent farm worker (Yes) = 1, 0 otherwise | 0.0342 (0.0626) |
| Extension information (Yes) = 1, 0 otherwise | 0.0831** (0.03833) |
| Agri Finance (Yes) = 1, 0 otherwise | 0.0307 (0.0390) |
| Ln (sigma) | 0.7965* (0.2192) |
| Lambda (local consumers) | 0.0821 (0.2131) |
| Lambda (local middlemen) | -0.0231* (0.0985) |
| Lambda (fruit and vegetable market) | -0.0953** (0.0236) |
| Lambda (contactors) | 0.1417* (0.0698) |
|
Chi2 |
217.40*** |
Note: Base category: processors standard errors are written in parentheses; ***, ** and * represents the level of significance at 1, 5, and 10 percent respectively.
and V market; and positive and significant with MSC contractors. But it is also positive not significant in the case of local consumers which means farmers who are associated with the local consumers might have another source of income and farming may not be there the main source of income. The coefficient of extension information is only significant and negative in case of farmer associated with the local middlemen category, which means farmers who did not have access to the extension information are more likely to be associated with the TSCs. It can be interpreted as the extension information play an important role for the farmer to be associated with the MSCs. Furthermore, the coefficient of education is negative across all supply chains representing a lower probability to participate in these supply chains relative to the processors that are the MSC. These results are consistent with the Sahara et al. (2015) and Slamet et al. (2017) who used treatment effect model to estimate farmer’s income in which both selection and outcome equations are estimated simultaneously. Their results showed that the age of the respondent, education level, irrigated land with several other variables have a statistically significant impact on the farmers’ participation in supermarket channels or MSCs.
Table 5 showed the effects of supply chains on farmers’ profit. The Inverse Mills’ Ratio is negative and significant in the case of supply chains in the category of local middlemen and fruit and vegetable markets. This indicated that the mandarin profit would have been biased downward without controlling for the selection bias. Study results showed no significant difference in mandarin profit of those associated with local consumers, local middlemen, and fruit and vegetable markets. However, the farmers associated with the contractor supply chain realize more profit. These results are consistent with our descriptive results where the farmer who sells their products to the processor or contractors earn more profit relative to the others. Gupta and Roy (2012) and Birthal et al. (2017) also found similar results from a comparison of the efficiency of milk value chains. Furthermore, with a significant positive coefficient of independent variable showed that the mandarin profit is found to be increased with large farmer’s category, higher education level, greater mandarin orchard, with main farming as the main occupation, and having access to extension information. Some other variables have a positive impact on mandarin profit but not found significant in our model, i.e., family size, permanent workers, and agricultural finance.
Conclusions and Recommendations
The perspective on marketing channel choice offers key insights through which income differential when participating in high value marketing channels can be understood. Unlike previous studies that provides descriptive marketing margins of agricultural produce, the objective of the study was to analyze the income differential more rigorously relating to marketing channels (traditional/modern). The MNL results unveiled some unique insights into citrus marketing strategy by showing clear differences in income earned when participating in wet markets or high value market channels respectively. Findings revealed that farmers who were selling their produce to the processors and contractors, were better off in terms of the profitability irrespective of their decisions to the specific marketing channel. The major policy implication is to develop the institutional environment through which participation in high value marketing channels can thrive. Dynamic incentives in the form of higher profitability offers an appropriate mean for promoting the scope of food safety and quality production requirements. The custodian of the horticulture produce policy will have to devise the platforms such as walking the chain, field days to facilitate the farmers getting expertise and know-how of food safety and quality production issues. Moreover, extension programs need to facilitate the emergence of training programs through recording and printing booklets on how to participate in high value marketing channels.
Novelty Statement
The research shows that how participation of citrus farmers in high value marketing channels (without intermediaries) in comparison with traditional marketing channels can maximize their returns. Policy level considerations are suggested to foster the farmers’ participation in high value marketing channels.
Author’s Contribution
Asif Yaseen: Conceptualized the study, developed the framework, wrote the paper.
Muhammad Israr: Conceptualized the study, developed the framework, write-up of the paper.
Allah Bakhsh: Literature review and developed the questionnaire.
Ahsan Javaid: Completed data collection.
Nafees Ahmad: Completed data analysis.
Zia Ullah: Proof reading.
References
Arinloye, A.A.D.D., J.L.F. Hagelaar, A.R. Linnemann, S. Pascucci, O. Coulibaly, S.W.F. Omta and T. van Boekel. 2012. Multi-governance choices by small holder farmers in the pineapple supply chain in Benin: An application of transaction cost theory. Afr. J. Bus. Manage., 38(6): 10320-10331.
Artle, R. and S. Berglund. 1959. A note on manufacturers’ choice of distribution channels. Manage. Sci., 5(4): 460-471. https://doi.org/10.1287/mnsc.5.4.460
Barrett, C.B., M.E. Bachke, M.F. Bellemare, H.C. Michelson, S. Narayanan and T.F. Walker. 2012. Smallholder participation in contract farming: comparative evidence from five countries. World Dev., 40(4): 715-730. https://doi.org/10.1016/j.worlddev.2011.09.006
Birthal, P.S., R. Chand, P.K. Joshi, R. Saxena, P. Rajkhowa, M.T. Khan and K.R. Chaudhary. 2017. Formal versus informal: Efficiency, inclusiveness and financing of dairy value chains in Indian Punjab. J. Rural Stud., 54: 288-303. https://doi.org/10.1007/978-981-10-5957-5_4
Blandon, J., S. Henson and T. Islam. 2009. Marketing preferences of small-scale farmers in the context of new agri-food systems: a stated choice model. Agribus. An Int. J., 25(2): 251-267. https://doi.org/10.1002/agr.20195
Chaudry, M.S. 2004. Opportunities and constraints in the production, marketing and export of citrus in Punjab. Fac. Agric. Econ. Rural Soc., Univ. Agric. Faisalabad, Pakistan.
Chen, K.Z., P.K. Joshi, E. Cheng and P.S. Birthal. 2015a. Innovations in financing of agri-food value chains in China and India: Lessons and policies for inclusive financing. China Agric. Econ. Rev., 7(4): 616-640. https://doi.org/10.1108/CAER-02-2015-0016
Chen, K.Z., T.A. Reardon and D. Hu. 2015b. Linking smallholders with rapidly transforming markets. Modernizing Smallholder Agric. Value Chain Dev. China.
Coughlan, A.T., E. Anderson, L. Stern and A.I. El-Ansary. 2001. Marketing channels. Upper Saddle River, NJ: Prentice Hall.
Deb, P., and P.K. Trivedi. 2006a. Maximum simulated likelihood estimation of a negative binomial regression model with multinomial endogenous treatment. Stata J., 6(2): 246-255. https://doi.org/10.1177/1536867X0600600206
Deb, P. and P.K. Trivedi. 2006b. Specification and simulated likelihood estimation of a non-normal treatment-outcome model with selection: Application to health care utilization. Econ. J., 9(2): 307-331. https://doi.org/10.1111/j.1368-423X.2006.00187.x
FAO. 2018. Statistical bulletin of crops in: Food and Agriculture Orgnizations (FAO), U. N. (ed.). Rome, Italy.
Fournier, A.J. 2018. Direct-selling farming and urban externalities: What impact on product quality and market size? Reg. Sci. Urban Econ., 70: 97-111. https://doi.org/10.1016/j.regsciurbeco.2018.03.001
Friedman, M. 2017. Price theory. Abingdon, U. K., Routledge. https://doi.org/10.4324/9781315127378
Gelaw, F., S. Speelman and G. Van Huylenbroeck. 2016. Farmers’ marketing preferences in local coffee markets: Evidence from a choice experiment in Ethiopia. Food Policy. 61: 92-102. https://doi.org/10.1016/j.foodpol.2016.02.006
Gogh, J.V. and L. Aramyan. 2014. Reducing postharves food losses in developing economies by using a Network of Excellence as an intervention tool. IFAMA.
GoP. 2018a. Agriculture marketing and information system (AMIS). Lahore, Pakistan Government of Punjab, Pakistan.
GoP. 2018b. Economic survey of Pakistan 2017-18. Islamabad, Pakistan: Minist. Finance, GoP.
GoP. 2018c. Final crop estimates data book. Lahore, Pakistan directorate of agriculture, crop reporting service, Punjab.
GoP. 2018d. Population census 2017. Islamabad, Pakistan. Pakistan bureau of statistics, GoP.
Gulati, A., N. Minot, C. Delgado and S. Bora. 2007. Growth in high-value agriculture in Asia and the emergence of vertical links with farmers. Global supply chains: standards and the poor: how the globalization of food systems and standards affects rural development and poverty. pp. 98-108.
Gupta, K., and D. Roy. 2012. Gains from coordination in milkfed dairy in Punjab. J. Agribus. Dev. Emerg. Econ., 2(2): 92-114. https://doi.org/10.1108/20440831211272571
Haq, A., A. Aslam, A.A. Chaudhry, A. Naseer, K. Muhammad, K. Mushtaq and M.S. Farooqi. 2013. Who is the ‘arthi’: Understanding the commission agent’s role in the agriculture supply chain. Int. Growth Centre (IGC) Working Paper.
Heijden, T.V.D. and N. Vink. 2013. Good for whom? Supermarkets and small farmers in South Africa – a critical review of current approaches to increasing access to modern markets. Agrekon. 52(1): 68-86. https://doi.org/10.1080/03031853.2013.778466
Mankiw, N.G., 2014. Principles of macroeconomics. Cengage Learning.
Mcconnell, C.R. and S.L. Brue. 2005. Economics. New York, USA, McGraw Hill Book Co.
Mehdi, M., B. Ahmad, A. Yaseen, A. Adeel and N. Sayyed. 2016. A comparative study of traditional versus best practices mango value chain. Pak. J. Agric. Sci. 53(3): 733-742. https://doi.org/10.21162/PAKJAS/16.5084
Memon, N.A. 2017. Citrus fruit (Kino). Exclusive on Kino. Pak. Food J., 29-31.
Minten, B., L. Randrianarison and J.F. Swinnen. 2009. Global retail chains and poor farmers: Evidence from Madagascar. World Dev. 37(11): 1728-1741. https://doi.org/10.1016/j.worlddev.2008.08.024
Montalbano, P., R. Pietrelli and L. Salvatici. 2018. Participation in the market chain and food security: The case of the Ugandan maize farmers. Food Policy, 76: 81-98.
Naseer, M.a.U.R., M. Ashfaq, M. Abid, A. Razzaq and S. Hassan. 2016. Current Status and Key Trends in Agricultural Land Holding and Distribution in Punjab, Pakistan: Implications for Food Security. J. Agric. Stud. 4(4): 14-27. https://doi.org/10.5296/jas.v4i4.9670
Naseer, M.a.U.R., M. Ashfaq, S. Hassan, S.A. Adil and A. Ariyawardana. 2018. Outlook on the global trade competitiveness of Pakistan’s mandarin industry: An application of revealed symmetric comparative advantage framework. Outlook Agric. 48: 1-9. https://doi.org/10.1177/0030727018817788
Pokhrel, D.M. and G.B. Thapa. 2007. Are marketing intermediaries exploiting mountain farmers in Nepal? A study based on market price, marketing margin and income distribution analyses. Agric. Syst. 94(2):151-164. https://doi.org/10.1016/j.agsy.2006.08.004
Poole, N., A.W. Seini and V. Heh. 2000. Improving agri-food marketing in developing economies: contractual vegetable markets in Ghana. Dev. Pract., 13(5): 551-557. https://doi.org/10.1080/0961452032000166483
Rao, E.J. and M. Qaim. 2011. Supermarkets, farm household income, and poverty: insights from Kenya. World Dev. 39(5): 784-796. https://doi.org/10.1016/j.worlddev.2010.09.005
Reardon, T., C.B. Barrett, J.A. Berdegué and J.F. Swinnen. 2009. Agri-food industry transformation and small farmers in developing countries. World Dev. 37(11): 1717-1727. https://doi.org/10.1016/j.worlddev.2008.08.023
Sahara, S., N. Minot, R. Stringer and W.J. Umberger. 2015. Determinants and Effects of Small Chilli Farmers’ Participation in Supermarket Channels in Indonesia. Bull. Indones. Econ. Stud. 51(3): 445-460. https://doi.org/10.1080/00074918.2015.1110851
Schuster, M. and M. Maertens. 2013. Do private standards create exclusive supply chains? New evidence from the Peruvian asparagus export sector. Food Policy. 43: 291-305. https://doi.org/10.1016/j.foodpol.2013.10.004
Shah, N., Khan, M., Khan, N., Idrees, M. and Haq, I. 2010. Profit margins in citrus fruit business in Haripur district of NWFP, Pakistan. Sarhad J. Agric., 26(1): 135-140.
Sharif, M., U. Farooq, W. Malik and M. Bashir. 2005. Citrus Marketing in Punjab: Constraints and Potential for Improvement. Pak. Dev. Rev., pp. 673-694. https://doi.org/10.30541/v44i4IIpp.673-694
Sharma, V.P., 2015. Determinants of Small Milk Producers’ Participation in Organized Dairy Value Chains: Evidence from India. Agric. Econ. Res. Rev. 28(2): 247-261. https://doi.org/10.5958/0974-0279.2016.00004.5
Siddique, M.I., 2015. Factors affecting marketing channel choice decisions in citrus supply chain Ph.D. Agribus., Massey Univ., Palmerston North, New Zealand.
Siddique, M.I., E. Garnevska and N.E. Marr. 2018. J. Agribus. Dev. Emerg. Econ. 8(3): 426-453. https://doi.org/10.1108/JADEE-03-2016-0014
Slamet, A.S., A. Nakayasu and M. Ichikawa. 2017. Small-Scale vegetable farmers’ participation in modern retail market channels in indonesia: The determinants of and effects on their income. Agric. 7(11): 1-16. https://doi.org/10.3390/agriculture7020011
Suzuki, A., Jarvis, L.S. and R.J. Sexton. 2011. Partial vertical integration, risk shifting, and product rejection in the high-value export supply chain: The Ghana pineapple sector. World Development, 39(9): 1611-1623. https://doi.org/10.1016/j.worlddev.2011.02.007
Swamy, V. and M. Dharani. 2016. Analyzing the agricultural value chain financing: approaches and tools in India. Agric. Fin. Rev. 76(2): 211-232. https://doi.org/10.1108/AFR-11-2015-0051
Teddlie, C., and F. Yu. 2007. Mixed methods sampling: A typology with examples. J. Mixed Method. Res., 1(1): 77-100. https://doi.org/10.1177/1558689806292430
Van Tilburg, A., and H.D. van Schalkwyk. 2012. Strategies to improve smallholders’ market access. In Unlocking markets to smallholders (pp. 35-58). Wageningen Acad. Publ., Wageningen. https://doi.org/10.3920/978-90-8686-168-2_2
Zúñiga-Arias, G., and R. Ruben. 2007. Determinants of market outlet choice for mango producers in Costa Rica. Tropical food chains, 49-67. Governance regimes for quality management. Wageningen, Netherlands: Wageningen Acad. Publ. pp. 49–67.
To share on other social networks, click on any share button. What are these?

