
Statistical Assessment of Trend Analysis on Production of Wheat Crop over India


Research Article
Statistical Assessment of Trend Analysis on Production of Wheat Crop over India
Abstract | Wheat (Triticum aestivum L.) is the basic required and stable food of every household from centuries. It has an important place in the world as it possesses high potential in nutrition point of view, gives good health, covers food security, etc. All the researchers are very much enthusiastic to know the growth and decline rates of trends in wheat production because of its high benefits. The main objectives of this study are to examine the change point and trend analysis for wheat production on the basis of time and spatial scale of major wheat producing states of India. This study has considered various prominent non-parametric methods i.e. Pettitt’s, Standard normal homogeneity (SNH) and Buishand’s range tests. The core purpose of these three techniques is to capture the mutation point in time series data connected to wheat production during the period 1980-2016. Consequently, Sen’s slope estimator has been used to measure the magnitude of the trend for wheat production and their significances examined through Mann Kendall (M-K) test. The analysis provided a clear idea about the trends of wheat production over India. The results exhibit that all the states showed the raising trends. The notable observation is that the trend of Madhya Pradesh got highest Sen’s slope estimator (i.e. 1541.999/year) in the second segmentation period. At present, the production of wheat is highly improved in Madhya Pradesh compared to other states from 2008. However, the production of wheat has been decreased in Uttar Pradesh compared to previous years but it holds the leading position in wheat production still in the country.
Received | September 22, 2019; Accepted | December 19, 2019; Published | February 01, 2020
*Correspondence | Kalpana Polisetty, Division of Mathematics, Department of S and H, Vignan’s Foundation for Science, Technology and Research, Vadlamudi 522 213, Guntur, Andhra Pradesh, India; Email: [email protected]
Citation | Polisetty, K. and K.K. Paidipati. 2019. Statistical assessment of trend analysis on production of wheat crop over India. Sarhad Journal of Agriculture, 36(1): 178-184.
DOI | http://dx.doi.org/10.17582/journal.sja/2020/36.1.178.184
Keywords | Wheat crop, Change point, Trend analysis, Non-Parametric methods, India
Introduction
There are many agricultural productions which enhance the food strength of the individual. One among them is wheat which has its own impact on the human body. Wheat is the cheapest sources of major nutrients and ensuring food and nutrition security to the majority population of the nation. Wheat is the important staple food crop and cultivating mainly during Rabi season. Wheat was first grown in the “Karacadag Mountains” in South Eastern part of Turkey, it was generally called as Einkorn (T. monococcum) and is generally described as a diploid containing two sets of chromosomes. It is the largest produced agriculture product in the world with high proteins and calories. In the world’s wheat production, India stood second-largest producer after China. It occupies globally highest acreage of 220 million hectares with production of 763 million tonnes nearly. Whereas in India, the cultivation of area for wheat is increased up to 30.54 million hectors and production followed raising trend i.e., 94.57 million tonnes. India exporting wheat from decades to neighbouring parts of the country like South Asia, the Middle East and Eastern Africa. Now, India is between being a net exporter of wheat in some years and a net importer in others.
Over the past 10 years, global human wheat consumption has increased 90 MMT, while feed wheat usage has increased 16 MMT. Wheat is mainly utilized in the form of food such as bread, chapatti, porridge, flour, suji etc. The powerful health benefits of wheat includes its ability to control obesity, boost energy and boosts digestion, prevent asthma, inhibit type 2 diabetes, gallstones, improve metabolism, etc. Global food security is one of the major concerns in the era of twenty first century. Cereals play a vital role to compensate the current food security demands of mounting population worldwide and act as the source of nutrition and calorie intake. It is well known fact that usage and requirement of wheat is raising day by day due to which has good nutrients.
Several studies related to regression techniques considered to study the growth rates and trends on the basis of the harvested area, production and productivity of wheat in worldwide (Karim et al., 2005; Saleem et al., 2014; Tahir, 2014; Ankita, 2017; Ajay and Sisodia, 2018; Awdhesh et al., 2018) and also studied variability of wheat production by Cuddy-Della Valle index (Saleem et al., 2018). The Box-Jenkins methodology frequently adapted to build best model and forecast for wheat production time series data (Choudhury and Jones, 2014; Amin et al., 2014; Ramesh, 2015; Muhammad et al., 2016; Patowary et al., 2017; Jai et al., 2017). Leilah and Al-Khateeb (2005) considered various statistical procedures to know the association between the yield and it related components in the case of drought conditions.
Understanding the fluctuations in wheat production is very essential for developing countries like India. It is required to enhance the level of wheat production in the face of the rapid growth of population and declining production of wheat. There is a need to determine monotonic trends of production and it helps to know the current situation of wheat production. A new attempt has been initiated to study the trend and change of wheat over India. In order to identify change point for study data, the powerful the non-parametric techniques such as Pettitt’s, SNH and Buishand’s range tests have been employed. Whereas the trends ratio measured through Sen’s slope estimator and their significances tested with M-K test.
Materials and Methods
Uttar Pradesh, Haryana, Punjab and Madhya Pradesh consider as the best four leading wheat producing states in India. The data is collected from RBI website annual reports as secondary sources. Yearly data is collected for wheat production of major states of India from 1980 to 2016.
Tests for capture change point
The change point analysis tries to detect where significant change takes place in time series data and it is a fundamental tool in time series analysis. Many researchers have applied different non-parametric statistical methods to detect change points in the time series (Chen and Gupta, 2001; Gallagher et al., 2012; Mohammad et al., 2014; Jaiswal et al., 2015; Kalpana and Kiran, 2019). The details of change point methods are given below sections.
Pettitt’s test: This test was introduced first by Pettitt in the early 1979’s. It is extensively adapted to examine the abrupt changes data (Verstraeten, 2006; Zhang and Lu, 2009; Dhorde and Zarenistanak, 2013). The test statistic is defined as:
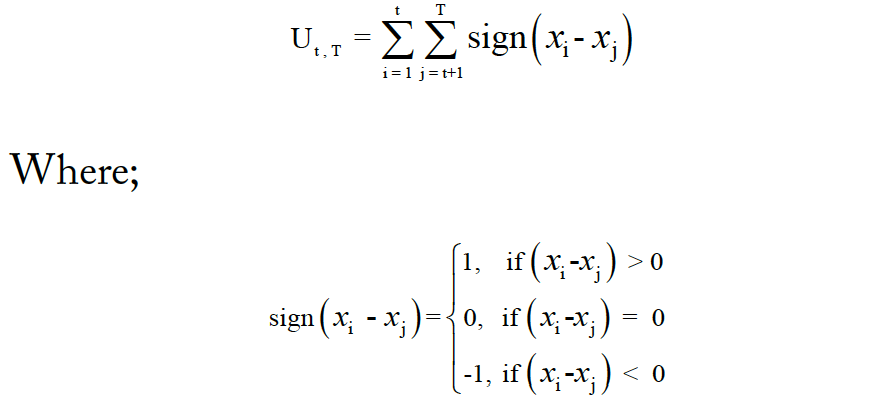
Then consider, KT= max ǀUt, Tǀ and the significance of KT is approximated for p= 2exp (-6K2T/ T3+T2) ≤ 0.05
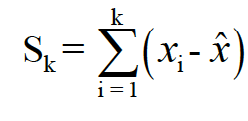
Buishand’s range test: The Buishand’s Range test is named as Buishand test from 1982, and its test statistic calculated by Rb = maxSk – minSk / σ
Where;
Here, ‘p’ value is considered with a Monte Carlo simulation by ‘m’ replicates.
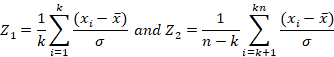
SNH test: The another popular test is SNH and its test statistic is denoted by Tk and it is defined as follows:
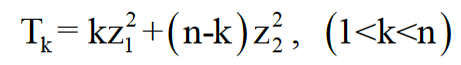
Where;
In the SNH test, the critical value is T= max Tk and p-value is considered with a Monte Carlo simulation by m replicates.
Trend analysis
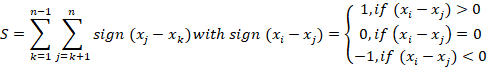
Generally, the magnitude of trend is measured in terms of ratio, this ratio can give an idea about trend i.e., either falling or rising or remaining relatively constant. With the help of ratio, it is possible to detect the poor or good signs of management. The non-parametric tests are simple and appropriate for non-normally distributed data. The M-K test plays a vital role to find out the significant nature of monotonic trends for time series data (Tabari et al., 2014; Mohammad et al., 2014; Jaiswal et al., 2015; Gavrilov et al., 2016; Khalili et al., 2015). The test statistic of M-K test is.
The Mean and Variance of S are E(s)=0 and
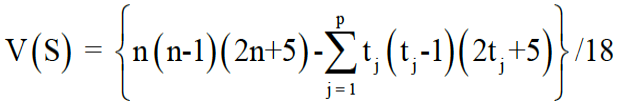
Where;
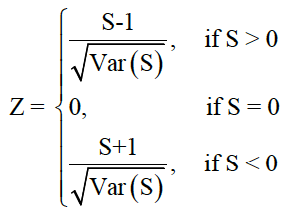
‘p’ is the number of tied groups in the data set, ‘tj’ group, n is the number of data points in the time series. For n >10, the standardized statistic for the M-K test is:
The sign of ‘S’ value represents an increase or decrease trends of time series. If ‘S’ value has positive sign, it indicates an increasing trend otherwise it indicates decreasing trend.
Sen’s slope estimator: Sen’s slope estimator is an adequate tool to determine the magnitude of the rend in time series related data (Guo and Xia, 2014; Talaee, 2014; Thenmozhi and Kottiswaran, 2016). In this technique, the slopes (Ti) of all data pairs are computed by:
Ti = Yj – Yk/ J-K for i=1, 2, ……, N
Where;
yj and yk are data values at time j and k (j > k) respectively. The median of these N values of Ti is Sen’s slope estimator which has been noted below:
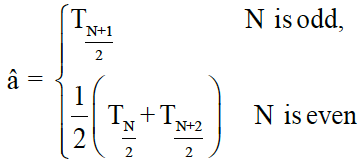
The sign of β value represents upward or downward trends of time series. If β value has positive sign, it indicates the upward trend otherwise the downward trend.
Results and Discussion
The known fact is that Uttar Pradesh takes first place in wheat production over India. From Table 1 it is definitely acceptable. The maximum wheat production is 30301.942 thousand tonnes in Uttar Pradesh and minimum production is 3143.500 thousand tonnes in Madhya Pradesh are observed. Moreover, the states Uttar Pradesh and Madhya Pradesh are identified as highest and lowest wheat producers on averagely during 1980-2016.
Table 1: Descriptive statistics for wheat production in thousand tonnes.
| States | Minimum | Maximum | Mean | S.D. |
| Uttar Pradesh | 12749.000 | 30301.942 | 22558.487 | 5043.859 |
| Punjab | 7677.000 | 17620.000 | 13491.247 | 2632.104 |
| Haryana | 3492.000 | 12685.660 | 8163.407 | 2641.211 |
| Madhya Pradesh | 3143.500 | 17939.300 | 7272.507 | 3703.940 |
The current study, at the outset, the non-parametric tests Pettitt’s, SNH and Buishand’s range tests have been used to capture the change point for year wise wheat production from 1980-2016. The results of the change point are given in Table 2. and Figure 1. The results exhibit all the states captured significant change points in different time periods i.e.
Table 2: Change point analysis of wheat production.
| Sub-divisions/Regions | Annual Rainfall | |||||
| Pettitt's Test | Buishand’s Test | SNH test | ||||
| p- Value | Change point | p -Value | Change point | p -Value | Change point | |
| Uttar Pradesh | 0.0001 |
1995* |
0.0001 |
1995* |
0.0001 |
1993* |
| Punjab | 0.0001 |
1997* |
0.0001 |
1997* |
0.0001 |
1992* |
| Haryana | 0.0001 |
1997* |
0.0001 |
1997* |
0.0001 |
1997* |
| Madhya Pradesh | 0.0001 |
2008* |
0.0001 |
2008* |
0.0001 |
2010* |
*Indicates the change points are significant at 1% level.
Uttar Pradesh at 1995, Madhya Pradesh at 2008, Punjab at 1997 and Haryana at 1997. Moreover, the change point (1995) is being initially detected in Uttar Pradesh and at the end identified as 2008 in Madhya Pradesh.
In the next phase, with the help of detected significant change point, the whole-time series (1980-2016) is split into two sub-time series. Here, the two sub-time series are represented like first sub-time series (before mutation point) and second sub-time series (after mutation point). The captured change point of major states plays a vital role to analyse the monotonic trends of wheat production data. In order to analyse the trends of wheat production, the non-parametric M-K test is applied to analyse the significant monotonic trends of annually in sub-time series as well as whole-time series. Additionally, the Sen’s slope estimator have been studied to measure the magnitude of monotonic trends and these results are presented in Table 3 and Figure 2.
From Table 3 and Figure 2 results, a notable point is observed that all states followed raising trends for wheat production in segmentation year wise. The identified all trends are statistically significant at 95% confidence by M-K test. From the Sen’s slope estimator analysis, it is observed that statistically significant highest growth i.e. 595.392/year at Uttar Pradesh and lowest growth i.e. 148.775/year at Madhya Pradesh in the first sub-time series respectively. According to India’s agriculture history of Madhya Pradesh, the present scenario of wheat area is highly improved around 18.75% and production is identified as 16.32 million tonnes compares to previous years. This surge production of wheat began in the year 2008 in Madhya Pradesh. The growth makes the state as one of the best outperformed wheat producing state in the country from the year 2008. The unprecedented changes taken in Madhya Pradesh due to expansion of cultivation of area, adoption of high-yielding varieties, enterprise of the farmers themselves etc. Whereas in Uttar Pradesh, the production wheat has been decreased nearly 1.4 million tonnes in the last decade and however still the state of Uttar Pradesh hold the leading wheat producer in the country (Sendhil et al., 2019). From the trend analysis on the basis of second sub-time series (see Table 3), the significant average growth rates of maximum and minimum trends are 1541.999/year and 304.797/year followed by Madhya Pradesh and Uttar Pradesh. The whole-time series results shown the highest upward and lowest upward significant trend are captured in the states of Uttar Pradesh (471.003/year) and Punjab (231.021/year). So, Madhya Pradesh showing the highest trend ratio compared to Uttar Pradesh in second sub-time series. From the above analysis and discussion, it is clear that the Sen’s slope estimator analysis has given an accurate results to the researchers.
Table 3: M-K test and Sen’s slope estimator results for wheat production.
| States | Segmentation year | Kendall's tau | p-value | Sen's slope |
| Uttar Pradesh | 1980-1995 | 0.883 | 0.0001 | 595.392 |
| 1996-2016 | 0.505 | 0.0015 | 304.797 | |
| 1980-2016 | 0.820 | 0.0001 | 471.003 | |
| Punjab | 1980-1997 | 0.908 | 0.0001 | 327.000 |
| 1998-2016 | 0.509 | 0.0026 | 117.682 | |
| 1980-2016 | 0.853 | 0.0001 | 231.021 | |
| Haryana | 1980-1997 | 0.908 | 0.0001 | 260.909 |
| 1998-2016 | 0.614 | 0.0003 | 176.200 | |
| 1980-2016 | 0.880 | 0.0001 | 238.853 | |
| Madhya Pradesh | 1980-2008 | 0.581 | 0.0001 | 148.775 |
| 2009-2016 | 0.857 | 0.0044 | 1541.999 | |
| 1980-2016 | 0.727 | 0.0001 | 252.088 |
Moreover, the magnitude of the trend on the average is declined in second sub-time series compared to the first sub-time series in all states (except Madhya Pradesh). The statistical analysis showed that wheat production is positively declined during the second sub-time series. However, at present, the population is growing continuously whereas the production of wheat is failed to meet the necessities of the utilization of wheat in India. It is clear that the low production of wheat creates dangerous problems on food security and also on the Indian economy.
Conclusions and Recommendations
The current study emphasizes on variability and long-term trends of wheat production of major wheat producing states over India. In this study, various nonparametric methods are adapted to examine the abrupt change point followed by trend analysis. The change point analysis captured significant change points from 1995 to 2005 and changes caused by various factors such as climatic conditions, the rapid growth of industrialization, commercial activities of human beings, etc. The trend analysis results revealed that all the states show the upward trend and it indicates that on average the production of wheat is improved over India. The important observation from the trend analysis is the magnitude of trends for all states are declined in second sub-time series except Madhya Pradesh. The highest growth and lowest growth rates of wheat production are identified as 1541.999/year in Madhya Pradesh and 117.682/year in Panjab.
Novelty Statement
A new attempt i.e., change point detection has been considered in trend analysis for wheat production. In trend analysis, the most adequate tool such as Sen’s slope estimator was used to measure the magnitude of the trend for wheat production.
Author’s Contribution
Kalpana Polisetty: Designed the study with suitable objectives, performed statistical analysis and completed manuscript write up
Kiran Kumar Paidipati: Involved in data collection and preparation of data.
References
Ajay, K.G. and B.V.S. Sisodia. 2018. Analysis of trends and growth rate of wheat crop and forecast of its production in Uttar Pradesh. J. Pharmacogn. Phytochem., 7(5): 3306-3310.
Amin, M., M. Amanullah and A. Akbar. 2014. Time series modeling for forecasting wheat production of Pakistan. J. Anim. Plant Sci., 24(5): 1444-1451.
Ankita, Y. 2017. Rice and wheat cultivation in Haryana: A spatial temporal analysis. Int. J. Res. Appl. Sci. Eng. Technol., 5: 2645-2653.
Awdhesh, K., K. Mahesh and S. Abhinandan. 2018. Trend analysis of wheat yield in Bihar. J. Pharmacogn. Phytochem., 7(4): 3016-3019.
Chen, J. and A. Gupta. 2001. On change point detection and estimation. Commun. Stat. Simul. Comput., 30(3): 665–697. https://doi.org/10.1081/SAC-100105085
Choudhury, A. and J. Jones. 2014. Crop yield prediction using time series models. J. Econ. Econ. Educ. Res., 15(3): 53-68.
Dhorde, A.G. and M. Zarenistanak. 2013. Three-way approach to test data homogeneity: an analysis of temperature and precipitation series over southwestern Islamic republic of Iran. J. Indian Geophys. Union, 17(3): 233–242.
Gallagher, C., R. Lund and M. Robbins. 2012. Change point detection in climate time series with long-term trends. J. Climatol., 26: 4994–5006. https://doi.org/10.1175/JCLI-D-12-00704.1
Gavrilov, M.B., T. Ivana, B.M. Slobodan, U. Miroslava and P. Predrag. 2016. Analysis of annual and seasonal temperature trends using the mann-kendall test in Vojvodina, Serbia. Quart. J. Hung. Meteorol. Ser. 120: 183–198.
Guo, L. and Z. Xia. 2014. Temperature and precipitation long-term trends and variations in the Ili-Balkhash basin. Theor. Appl. Climatol., 115: 219–229. https://doi.org/10.1007/s00704-013-0883-3
Jai, S.T., P. Pushpa and C. Vijayalakshmi. 2017. Stochastic time series analysis for wheat (Triticum aestivum) production in India. Int. J. Pure Appl. Math., 113: 111 – 119.
Jaiswal, R.K., A.K. Lohani and H.L. Tiwari. 2015. Statistical analysis for change detection and trend assessment in climatological parameters. Environ. Processes, 2(4): 729-749. https://doi.org/10.1007/s40710-015-0105-3
Kalpana, P., K. Madhavi, M. Venkateswaran and K.P. Kiran. 2019. A Research on change point and trend scrutiny with reference to Castor in India, Int. J. Eng. Adv. Tech. 9: 240-244.
Karim, R., A. Awal and M. Akhter. 2005. Forecasting of wheat production in Bangladesh. J. Agric. Soc. Sci., 1: 120–122.
Khalili, K., M.N. Tahoudi, R. Mirabbasi and F. Ahmadi. 2015. Investigation of spatial and temporal variability of precipitation in Iran over the last half century. Stochastic Environ. Res. Risk Assess., 30: 1–17. https://doi.org/10.1007/s00477-015-1095-4
Leilah, A.A. and S.A. Al-Khateeb. 2005. Statistical analysis of wheat yield under drought conditions. J. Arid Environ., 61(3): 483-496. https://doi.org/10.1016/j.jaridenv.2004.10.011
Mohammad, Z., G.D. Amit and R.H. Kripalani. 2014. Trend analysis and change point detection of annual and seasonal precipitation and temperature series over southwest Iran. J. Earth Syst. Sci., 123: 281-295. https://doi.org/10.1007/s12040-013-0395-7
Muhammad, I.C.H., T.J. Muhammad, A. Asad and R. Qaisar. 2016. Forecasting of wheat production: a comparative study of Pakistan and India. Int. J. Adv. Res., 4(12): 698-709. https://doi.org/10.21474/IJAR01/2449
Patowary, A.N., P.C. Bhuyan, M.P. Dutta, J. Hazarika and P.J. Hazarika. 2017. Development of a Time Series Model to Forecast Wheat Production in India. Environ. Ecol., 35: 3313-3318.
Ramesh, D., P. Soumen, S.R. Vatluri and B. Banjul. 2015. Time series modeling for trend analysis and forecasting wheat production of India. Int. J. Agric., Environ. Biotechnol., 8(2): 303-308. https://doi.org/10.5958/2230-732X.2015.00037.6
Saleem, A., A.S. Nisar, H. Abdul, F. Arshad and M.M. Asif. 2014. Growth and trend in area, production and yield of major crops of Khyber Pakhtunkhwa, Pakistan. Asian J. Agric. Rural Dev., 4(2): 149-155.
Saleem. A., M.M. Asif, A.M. Zubair, Z. Saleem and R. Irum. 2018. Trends and variability of wheat crop in Pakistan. Asian J. Agric. Rural Dev., 8(2): 153-159.
Sendhil, R., K.T.M. Kiran and P.S. Gyanendra. 2019. Recent advances in grain crops research, Intech open.
Tabari, H., A. AghaKouchak and P. Willems. 2014. A perturbation approach for assessing trends in precipitation extremes across Iran. J. Hydrol., 519: 1420–1427. https://doi.org/10.1016/j.jhydrol.2014.09.019
Tahir, H.M. 2014. Trend analysis of productivity of some selected cereal crops in Nigeria: 1983-2008. Res. Humanit. Soc. Sci., 4: 110-116.
Talaee, P.H. 2014. Iranian rainfall series analysis by means on nonparametric tests. Theor. Appl. Climatol., 116: 597–60s7. https://doi.org/10.1007/s00704-013-0981-2
Thenmozhi, M. and S.V. Kottiswaran. 2016. Analysis of rainfall trend using mann-kendall test and the Sen’s slope estimator in Udumalpet of Tirupur district in Tamil Nadu. Int. J. Agric. Sci. Res., 6(2): 2321-0087.
Verstraeten, G., J. Poesen, G. Demarée and C. Salles. 2006. Long-term (105 years) variability in rain erosivity as derived from 10-min rainfall depth data for Ukkel (Brussels, Belgium): implications for assessing soil erosion rates. J. Geophys. Res. Atmos., 111: 1–11. https://doi.org/10.1029/2006JD007169
Zhang, S. and X.X. Lu. 2009. Hydrological responses to precipitation variation and diverse human activities in a mountainous tributary of the lower Xijiang, China. Catena 77: 130–142. https://doi.org/10.1016/j.catena.2008.09.001
To share on other social networks, click on any share button. What are these?


