

Remote Sensing Assessment of Marine Primary Productivity and Fishery Resources in the Daya Bay, China


Remote Sensing Assessment of Marine Primary Productivity and Fishery Resources in the Daya Bay, China
Jing Yu1*, Jiangmei Mao1,2 and Dongliang Wang1,3
1South China Sea Fisheries Research Institute, Chinese Academy of Fishery Sciences; Guangdong Provincial Key Laboratory of Fishery Ecology and Environment; China Scientific Observing and Experimental Station of South China Sea Fishery Resources and Environment, Ministry of Agriculture and Rural Affairs; Guangzhou 510300, PR China
2Nanjing Agricultural University, Academy of Science; Plant Phenomics Research Centre, Nanjing 210095, PR China
3College of Marine Science, Shanghai Ocean University, Shanghai 201306, PR China
ABSTRACT
Marine primary productivity (PP) is closely related with fishery resources. This study benefited a lot by providing the reference for the use of remote sensing data to inverse PP and then to assess fishery resources in typical offshore fishery waters. The paper adopted the inversion analysis of the primary productivity (PP) in the Daya Bay, China applying the vertical generalized production model (VGPM) with ocean color and sea surface temperature (SST) provided by MODIS-Aqua. On the basis of modified VGPM model, fishery resources in the Daya Bay were evaluated according to the Tait model, Cushing model, and trophic dynamics model. Results showed that the seasonal variation of PP was obvious in the bay, the average PP reached the highest in summer (1595.60 mg C·m-2·d-1) and the second in autumn (1274.67 mg C·m-2·d-1). The space distribution of PP decreased gradually from nearshore (greater than 1000 mg C·m-2·d-1) to offshore and outside (800~1000 mg C·m-2·d-1) of the bay. As one of the most significant influencing factors to PP, chlorophyll a (Chl-a) showed similar characteristics of spatiotemporal distribution. Comparing results of different estimation models, it was found that density of fishery resources assessed by Cushing model matched well with the in-situ investigation data of fishery resources. Marine primary productivity and fishery resources in the Daya Bay were mainly influenced by Chl-a distribution, cage culture and petrochemical sewage (Liu, 2011).
Article Information
Received 25 March 2020
Revised 5 November 2020
Accepted 31 December 2020
Available online 04 June 2021
Authors’ Contribution
JY designed the study, guided the entire article macroscopically and review articles. JM performed experimental work and analyzed the data. DW assisted in experiment and image processing.
Key words
Primary productivity, VGPM, Fishery resources, Daya Bay, China
DOI: https://dx.doi.org/10.17582/journal.pjz/20200325060334
* Corresponding author: [email protected]
0030-9923/2021/0004-1481 $ 9.00/0
Copyright 2021 Zoological Society of Pakistan
INTRODUCTION
Marine primary productivity (PP) is closely related with fishery resources (Pikitch et al., 2004; Chassot et al., 2010). An accurate marine PP estimation model can directly provide decision-making support for fishery production and marine management, which is of great significance for resource management, carbon cycle and global climate change research. The vertical generalized production model (VGPM) was applied to the inverse analysis of marine PP (Ye et al., 2015) and its main parameters could be obtained from satellite remote sensing, included sea surface temperature (SST) and ocean color (Pikitch et al., 2004), the latter include chlorophyll a concentration (Chl-a), diffuse attenuation coefficient Kd (490), Photosynthetically Active Radiation (PAR), and Euphotic Zone Depth (Zeu). Therefore, it had strong adaptability and has been widely applied to the study of marine PP.In the north of the South China Sea (SCS), fitting analysis of satellite remote sensing and surveyed data, researchers revealed the seasonal variation characteristics of PP (Tang et al., 2007) and the main factors of PP temporal and spatial variation (Hao et al., 2011). In coastal waters of the SCS, VGMP model was also successfully applied to the spatial and temporal distribution analysis of net primary productivity in the sea area of Shenzhen (Zhang et al., 2017) and the analysis of PP seasonal variation in the Pearl River estuary (Ye et al., 2015).
The assessment of fishery resources based on marine primary productivity is to estimate the amount of life matter produced by fishery organisms in a certain period of time through the energy flow of the ecosystem, which is of great significance for monitoring the ecological functions of sea areas and guiding fishery production (Wang et al., 2005). In the middle sea area of northern Pacific Ocean, the seasonal variation of autumn cohort of squid Ommastrephes bartramii is closely related to the net primary productivity (Ichii et al., 2011). In the Daya Bay, potential fishery production capacity estimated by PP revealed the mechanisms for maintaining the biodiversity in representative gulfs and structural and functional diversity of the ecosystems (Song et al., 2012). Some models such as nutrient dynamics and Cushing model based on marine PP are also applicable in exploring the reason of fishery resource declining and the changing trend of the resources (Lu, 2006).
Daya Bay is located in the northeast SCS, a semi-closed bay surrounded by land on three sides, with zigzag shorelines, diverse habitats and rich biological resources, which is a representative offshore fishery area in the SCS (Wang et al., 2006). Taking the Daya Bay as the study area, this paper adopted the inverse analysis of the marine PP based on the marine remote sensing, analyzed the spatiotemporal variation, evaluated the fishery production of the Daya Bay, explored the methods of evaluating the fishery resources in the typical fishery areas near the SCS based on the satellite remote sensing, which provided a reference for the assessment and management of offshore fishery resources in the SCS.
MATERIALS AND METHODS
Research area
The survey of fishery resources and ecological environment was conducted according to the station location, in May 2015 (spring), August (summer), September (Autumn) and January (winter) (Fig. 1).
Data from satellite remote sensing
The data was from level 2 product in MODIS-AQUA NASA (https://oceancolor.gsfc.nasa.gov/). The spatial resolution is 1Km, temporal resolution is day, and the time period is from 2013 to 2016. The satellite remote sensing data were extracted with the help of SEADAS 7.3(NASA Goddard Space Flight Center, USA), MatLAB 9.0 (MathWorks, USA) and ArcGIS 9.3 (Environmental Systems Research Institute, USA) was applied for the visual processing.
Survey data
The data of fishery resources and environment were from the fishery resource and ecological environment survey of the Daya Bay carried out by South China Sea Fisheries Research Institute during May 2015 (spring), August (summer), September (autumn) and January (winter). The survey methods were referred from GB17378-2007 and GBT12763.6-2007 (Standardization Administration, 2007a, b). The details are listed in Table I. Bottom trawler was used for the survey, with the total power 254Kw, total weight of 108t, equipping with ROYALRV-680GP GPS system and JKC Radar, trawling once for each station, averaging 0.25 h each time at 2.5 knots.
Table I. Survey season, station, species and category.
|
Season survey |
Number of station |
Species of catch |
Survey category |
|
spring |
10 |
Fish |
Number of species, Catch (Kg) |
|
Crustaceans |
|||
|
Cephalopods |
|||
|
summer |
17 |
Fish |
Number of species, Catch (Kg), Catch numbers (ind) |
|
Shrimps |
|||
|
Crabs |
|||
|
Squilla |
|||
|
Cephalopods |
|||
|
autumn |
10 |
Fish |
Number of species, Catch (Kg) |
|
Crustaceans |
|||
|
Cephalopods |
|||
|
winter |
17 |
Fish |
Number of species, Catch (Kg), Catch numbers (ind) |
|
Shrimps |
|||
|
Crabs |
|||
|
Squilla |
|||
|
Cephalopods |
Estimation of primary productivity
Inversion of marine primary productivity based on VGPM model (Kameda and Joji, 2005):

where, PPeu represents primary productivity in euphotic layer (mg C·m-2·d-1), PoptB represents maximum rate of carbon sequestration in water column (mg C·mg·Chl-a-1·h-1), E0 represents photosynthetically active radiation in sea surface PAR (mol quanta·m-2·d-1), acquired from the OC product in MODIS-Aqua; Zeu represents depth of euphotic layer (m), Copt represents Chl-a content (Chlorophyll a, Chl-a, mg·m-3) of the water column Popt where the maximum rate of carbon sequestration is,acquired from the OC product in MODIS-AQUA; Dirr represents the Photoperiod (h), acquired from Shenzhen Government OBSERVATORY (http://www.szmb.gov.cn/twt/). Maximum rate of carbon sequestration in water column (PoptB) (Liu et al., 2012):

Depth of euphotic layer (Zeu) (Tang et al., 2007):
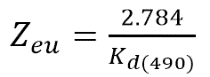 ...(3)
Chlorophyll fitting
The regression analysis of Chlorophyll a concentration in the filed survey and Chl-a extracted by MODIS-Aqua in the same period showed good fitting effect, R2 = 0.92 (Fig. 2).
Fisheries resources assessment
Tait model (Luo, 1993)
The efficiency μ is 0.015 when the primary productivity of coastal waters is transformed into the tertiary organisms (fishery resource) (Lu et al., 2002; Wang et al., 2005). Estimation formula of fishery yield in the Daya Bay was estimated by the following formula.

Where, YT represents fishery production (t), μ represents biotransformation efficiency, t represents conversion coefficient, S represents sea area (km2), PPeu (mg C·m-2·d-1) represents primary productivity.
Cushing model (Cushing, 1971)
The carbon emission of the tertiary organism is equal to the half of the 1% primary carbon production and 10% secondary carbon production.
Estimation formula of fishery yield in the Daya Bay was based on Cushing model:
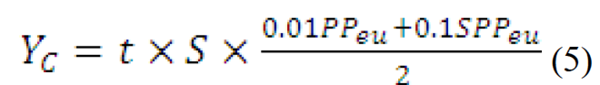
Where, Yc represents fishery production (t), t represents conversion coefficient, S represents sea area (km2), PPeu (mg C·m-2·d-1) represents primary productivity (primary carbon production), SPPeu (mg C·m-2·d-1) represents secondary productivity (secondary carbon production).
Trophic dynamics model (Fei, 1980)
The food energy flow theory was applied to estimate fishery production in Daya Bay.
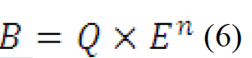
where, B represents fishery production(t), Q represents Phytoplankton production (mg C·m-2·d-1), E represents ecological efficiency, n represents biotrophic level.
According to Tait, Cushing and trophic dynamics model, the fishery resource density in the Daya Bay area is calculated.
Stock density acquired by in-situ survey
Stock density by trawling survey is expressed as resource density, referring to sea area sweeping method (Ding, 1980; Guan et al., 2013).
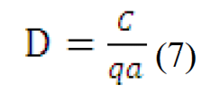
Where, D, resource density (kg/km2); C, fishery production per hour by trawling (kg/net•h); a, sampling area per hour by net (km2/net•h); q, net capture rate (0.5).
RESULTS
Seasonal distribution of PP, Chl-a and SST
In terms of seasonal distribution, PP of the Daya Bay reached the highest in summer, took the second place in spring and autumn, and reached the lowest in winter. The spatial distribution of PP showed that high value of PP was mainly in the coastal and northern waters within the bay (>1000mg C·m-2·d-1), the low value mainly appeared in the estuary (<900 mg C·m-2·d-1). The seasonal distribution of Chl-a was similar with that of PP, which reached the highest in summer, took the second place in autumn and winter and reached the lowest in spring. The spatial distribution of Chl-a showed that the value in the inner bay was higher than that in the outside bay (Fig. 3). High value of Chl-a (above 9 mg·m-3) was mainly in the north of the Daya Bay and the low value in the middle and mouth of the Daya Bay. The SST value was the highest in the summer, the second in autumn and spring, the lowest in winter. The spatial distribution of SST within the bay was even.
Fisheries resources assessment
Marine primary productivity was used to assess the fishery resources and further evaluate fishery resource density, with the help of Cushing, Tait and trophic dynamics model. Results showed that the fishery resource density evaluated by Cushing model was the closest to the fishery resource density surveyed in-situ. The fishery resources achieved the highest in summer, which matched with the seasonal distribution of fishery resource density obtained by in-situ survey. Tait and trophic dynamics model followed (Fig. 4).
DISCUSSION
Seasonal variation of fishery resources
Fishery resources mainly included fishes, crustaceans and cephalopods in daya bay. seasonal variation of catch rate was different significantly, showing the characteristic of highest in summer, then in autumn, winter and spring orderly, while fishes were captured the most, then cephalopods and crustaceans orderly in all seasons. catch rate of fishes ranked first, with few cephalopods were captured and almost zero crustaceans especially in summer. Seasonal variation of number of species of fishery resources appeared that the value is highest in spring and lowest in summer, with autumn ranked second. Comparing catchability with number of species, value of catchability was lowest, but the highest number of species in spring, showing the opposite trend exactly in summer and similar tendency between autumn and winter. Catchability of cephalopod is stronger than that of crustacea, while number of crustacea was higher than cephalopod except summer. Fish were the most important component ecological types of all seasons in Daya Bay (Fig. 2).
Spatiotemporal variation of primary productivity in the Daya Bay
The spatiotemporal distribution of PP was affected by Chl-a in the Daya Bay, showing the same tendency with that of Chl-a, and the two presented a significant positive correlation (Le et al., 2013). The results showed that the value of the PP was the highest in summer, the second in autumn and winter. High value of PP appeared in the north of the Daya Bay, consistent with the Liu’s research (Liu et al., 2012), probably connected with the rich nutrition and high phytoplankton utilization efficiency (Qiu et al., 2005). Additionally, due to the effect of seasonal thermocline (Yin et al., 2006), the northernly marine current clustered the nutrition into the north of the bay, with the nutrition supply outside the bay, resulting the highest Chl-a value in summer, relatively lower Chl-a in other seasons (Lu, 1990; Qiu et al., 2005). The value of the Chl-a in the inner bay and nearshore was higher than that in the outside bay and off-shore. It might be affected by the cage culture, thermal emission (Yu et al., 2010) from nuclear power plant and petrochemical sewage (Wang et al., 2011) and human activities (Wu and Wang, 2007). Daya Bay was affected by human activities included thermal plume from nuclear power stations (Yu et al., 2010), cage culture in the Aotou waters in the bay (Liang et al., 2017), and etc., partly resulted to higher Chl-a near shore in summer and autumn than that in the offshore. Moreover, petrochemical sewage has threatened the health of marine ecosystem seriously. The seasonal distribution of PP in the Daya Bay was positively correlated with the fishery resources density. In summer, higher PP brought higher fishery production, providing sufficient bait source for fishery organisms. In autumn, the amount of fishery resources decreased due to the increase of fishing intensity (Yu et al., 2017a) after summer fishing moratorium (Mao et al., 2017).
Fishery resource assessment based on remote sensing in the Daya Bay
In this paper, fishery resource density evaluated by Cushing model fitted best with the fishery resource density surveyed in situ, where Tait model and trophic dynamics model differed greatly from the fishery production investigated in situ, thus the latter two models are not applicable to assess the fishery production in Daya Bay (Fig. 5). It is likely that the key parameter of fishery resources estimated by Cushing model is organic carbon content of resource organisms, which is close to the carbon content of fishery resources in the study sea area. In South Fujian-Taiwan shoal, the deviation between the fishery resources estimated by Cushing model and the fishery resources investigated in situ was only 5.44% (Xiao, 2003); off the coast of Fujian, relative error was about 5% between the fishery production estimated by Cushing model and that surveyed in situ (Li and Lu, 2008). The research have shown that the fishery resource density estimated by Tait model is more suitable for Daya Bay than Cushing model (Song et al., 2012), This is because the average conversion efficiency of primary productivity to secondary productivity is 30%, However, A large proportion of this is caused by jellyfish plankton, which is difficult to transfer C to higher trophic levels, which seriously affects the estimation of resource density (Song et al., 2009), This phenomenon of the latter cannot be expressed in the model, which results in the deviation of fishery resources density caused by the high average ecological efficiency of Cushing model. In this study, the ecological efficiency of 0.15 was selected in the calculation of secondary productivity. Although it may lead to underestimate of secondary productivity in Daya Bay, it can avoid the impact of jellyfish plankton on fishery resources assessment to a certain extent. The results also show that the Cushing model used in this paper has a good effect on the assessment of fishery resources. The accuracy of trophic dynamics model eva is mainly controlled by the parameter n of fishery resources nutrition level. If it is not set properly, it will lead to a large deviation between the assessment results and the real situation. In the evaluation results in the 1990s, Wang et al. (2005) believed that the fishery resources had undergone structural changes at that time. Therefore, the trophic level was taken as 2.5, and good results were achieved. However, in recent years, due to the increase of offshore fishing intensity, the fishery resources in Daya Bay have shown a trend of miniaturization and low value (Wang et al., 2010). In this study, the trophic dynamics model shows that it overestimates fishery resources, which is probably due to the further reduction of the trophic level of fishery resources. In the future, the study on the assessment of fishery resources in Daya Bay should focus on the different ecological efficiency among different trophic levels, and the parameters in Cushing model should be modified to adapt to the local specific population structure.
The seasonal distribution characteristics of fishery resource density evaluated by Cushing model based on primary productivity is basically consistent with actual survey results. In summer, resource density surveyed was slightly higher than the evaluation results of Cushing model, and in autumn, winter and spring, the resource density surveyed was slightly lower than the evaluation results of Cushing model. This was related to the selective use of biological resources by human activities. In summer, summer fishing moratorium allowed the fishery organisms to recover in the coastal waters of South China Sea (Yu et al., 2018). In autumn, after the summer fishing moratorium, the resource density of in situ survey was slightly lower than that of Cushing model because of the increasing fishing intensity. The influence of human factors was not taken into account in Cushing model. In Egong Bay, a typical offshore fishing waters in the South China Sea, the ecosystem communities were stable during the summer fishing moratorium, however, the ecosystem communities in autumn was unstable due to the increasing fishing intensity (Yu et al., 2017b). In spring, young populations of Trachurus japonicus and Parargyrops edita occupying the Daya Bay probably reduced the actual catch (Wang et al., 2010), resulting in the lower fishery resource density by in-situ investigation than the estimated fishery resource density by Cushing model.
Sustainable development of fishery resources
Taking season as time scale, fishery resource density evaluated by Cushing model was higher than fishery resource density by investigation except summer. On one hand, ecological environment was under great pressure in the Daya Bay due to the excessive disturbance of human beings. The environment that fishery organisms depend on for survival was deteriorating, the interaction between biological community and ecological environment led to the decrease of biological community diversity. The research showed that difference of benthic animal productivity was closely related to the influence of human activities in the Daya Bay. Fishery resources have an obvious trend of miniaturization and low value (Du et al., 2008, 2009). On another hand, overfishing was another important factor in the decline of fisheries in the Daya Bay which has been overexploited, updated and replenished slowly. Therefore, it is necessary to take measures to protect fishery resources, control fishing boats strictly and advocate pelagic fishing. There are abundant cephalopod fishery resources in waters of the continental shelf of the South China Sea, providing feasibility for the development of pelagic fishery (Li et al., 2016). Fishing moratorium should be extended appropriately to protect spawning groups and young fishes, recovery time of fishery resources should be sufficient. The types of fishing moratorium should be expanded to increase the types of fishery resources (Yu et al., 2017a). Construction of marine ranching restored the habitat to some extent, and played a positive role in the conservations and proliferation of fishery resources. (Wang et al., 2019). Value-added release of different niche species should be carried out and spatial heterogeneity of fishery communities should be fully taken into account and the release of one-way species should be transferred to the value-added release based on ecosystem balance (Li et al., 2011; Yu et al., 2015), aiming to maintain ecosystem balance while expanding the types of fishing moratorium.
CONCLUSIONS
This study analyzed spatiotemporal distribution of the primary productivity and fishery resource density in the Daya Bay, according to the data from remote sensing and survey information on fishery resource. The research showed that fishery resource density estimated by Cushing model fitted well with the survey results. The temporal and spatial distribution of primary productivity and fishery resources is related with Chl-a, cage culture and nuclear power plant thermal emission, petrochemical emissions and other factors. In this study, only OC, SST and other ecological environmental factors obtained by satellite remote sensing were chosen. Marine current, plankton, proliferation were considered as important factors, which may have influence on primary productivity and fishery resources, aiming to analyze the distribution of primary productivity and fishery resources accurately in the Daya Bay.
ACKNOWLEDGEMENTs
This study was supported by the National Key R and D Program of China (2018YFD0900901); the Natural Science Foundation of Guangdong Province, China (2018A030313120), the Central Public-interest Scientific Institution Basal Research Fund, CAFS, China (2018HY-ZD0104).
Statement of conflict of interest
The authors have declared no conflict of interest.
REFERENCES
Chassot, E., Sylvain, B., Nicholas, K.D., Frédéric, K.D., Reg, W., Didier, G. and Olivier, P.L., 2010. Global marine primary production constrains fisheries catches. Ecol. Lett., 13: 495-505. https://doi.org/10.1111/j.1461-0248.2010.01443.x
Cushing, D.H., 1971. Upwelling and the production of fish. Adv. Mar. Biol., 9: 255-334. https://doi.org/10.1016/S0065-2881(08)60344-2
Ding, YQ., 1980. Principles and applications of mathematical ecology of insect populations. Science Press, China.
Du, F.Y., Wang, X.H, Li C.H. and Jia, X.P., 2008. Variation characteristic of macrobenthos productivity in Daya Bay of South China Sea. Chin. J. appl. Ecol., 19: 873-880.
Du, F.Y., Wang, X.H., Li, C.H., Zhang, H.H. and Jia. X.P., 2009. Macrobenthic community structure in Daya Bay , South China Sea. Acta Ecol. Sin., 29: 1091-1098.
Fei, H.N., 1980. Characteristics of aquatic resources and suggestions for strengthening management. China Fish., 3: 4-5.
Guan, W.J., Tian, S.Q., Zhu, J.F. and Chen, X.J., 2013. A review of fisheries stock assessment models. J. Fish. Sci. China, 5: 1112-1120. https://doi.org/10.3724/SP.J.1118.2013.01112
Hao, Q., Ning, X.R., Cai, Y.M., Liu, C.G. and Le, F.F., 2011. The physical-biological oceanography coupling characteristics of primary production in the northern South China sea and the influences on carbon fixation. Acta J. Mar. Sci., 29: 46-57.
Ichii, T., Mahapatra, K., Sakai, M., Wakabayashi, T., Okamura, H., Igarashi, H., Inagake, D. and Okada, Y., 2011. Changes in abundance of the neon flying squid ommastrephes bartramii in relation to climate change in the central North Pacific Ocean. Mar. Ecol. Prog. Ser., 441: 151-164. https://doi.org/10.3354/meps09365
Kameda, T. and Joji, I., 2005. Size fractionated primary production estimated by a two-phytoplankton community model applicable to ocean color remote sensing. J. Oceanogr., 61: 663-672. https://doi.org/10.1007/s10872-005-0074-7
Le, C., Hu, C., English, D., Cannizzaro, J., Chen, Z., Feng, L., Boler, R. and Kovach, C., 2013. Towards a long-term chlorophyll-a data record in a turbid estuary using MODIS observations. Prog. Oceanogr., 109: 90-103. http://doi.org/10.1016/j.pocean.2012.10.002
Li, B., Chen, G.B., Guo, Y., Chen, Z.Z., Zhang, J., and Wang. D.X., 2016. Hydroacoustic assessment of spatial-temporal distribution and biomass of fishery resources in the central South China Sea. S. Chin. Fish. Sci, 12: 28-37.
Li, T., Zhang, X.M., Zhang, P.D. and Huang, G.Q., 2011. Seasonal variation on community structure of fishery resources in the coastal waters of southern Shandong Peninsular. Period. Ocean Univ. China, 41: 41-50.
Li, X.D. and Lu. Z.B., 2008. The productivity of fishery resources and the maximum sustained yield in Fujian coastal water. J. Xiamen. Univ. (Nat. Sci.), 47: 142-147. (In Chinese).
Liang, Q.Y., Qi, Z.H., Gong, X.Y., Han, T.T., Shi, R.J., Zhang, W.B., Gu, Y.G. and Huang, H.H., 2017. Impact of deep-water net cage fish farming in Daya Bay,southern China on environment. S. China Fish. Sci., 13: 25-32. https://doi.org/10.3969/j.issn.2095-0780.2017.05.004
Liu, H.X., Huang, L.M., Song, X.Y., and Zhong, Y., 2012. Using primary productivity as an index of coastal eutrophication: A case study in Daya Bay. Water Environ. J., 26: 235-240. https://doi.org/10.1111/j.1747-6593.2011.00281.x
Lu, Z.B., 2006. The production of fishery resources and the maximum sustained yield in the Min-zhong fishery in Taiwan Strait. S. China Fish. Sci., 2: 6-14.
Lu, Z.B., Dai, Q.S., and Yan Y.M., 2002. Productivity and maximum sustainable yield of fishery resources in Taiwan strait and its adjacent waters. J. Fish. Sci. China, 9: 28-32.
Lu, Z.K., 1990. Resources and environment of Daya Bay. Mar. Sci., 14: 38.
Luo, B.Z., 1993. Marine ecology. Adv. Earth Sci., 5: 94-96.
Mao, J.M., Yuan, H.R., Yu, J., Chen, P.M. and Hu, Q.W., 2017. GLM-Based analysis on seasonal variation of fishery resources in Dapeng Bay, China. J. Geosci. environ. Prot., 5: 32-45. https://doi.org/10.4236/gep.2017.510004
Pikitch, E.K, Santora, C., Babcock, E.A., Bakun, A., Bonfil, R., Conover, D.O., Dayton, P., Doukakis, P., Fluharty, D., Heneman, B., Houde, E.D., Link, J.P., Livingston, A., Mangel, M., McAllister, M.K., Pope J. and Sainsbury, K.J., 2004. Ecosystem-based fishery manageme. Science, 305: 346-347. https://doi.org/10.1126/science.1098222
Qiu, Y.W., Wang, Z.D., and Zhu. L.S., 2005. Variation trend ofnutrient and chlorophyll contents and their effects on ecological environment in Daya Bay. J. Oceanogr. Taiwan Strait., 24: 131-139.
Song, X, Huang, L, Zhang, J, Huang, H., Li, T, Su, Q., 2009. Harmful algal bloom (HABs) in Daya Bay: An in situ study based on Primary production and environmental impacts. Mar. Pollut. Bull., 58: 1310–1318. https://doi.org/10.1016/j.marpolbul.2009.04.030
Song, X.Y., Wang, S.F., Li, K.Z., Huang, L.M., Tan, Y.H., Huang, X. P. and Liu, H.X., 2012. Basic biological production and potential fishery production in Daya Bay. Ecol. Sci., 31: 13-17.
Standardization Administration, 2007. The specifications for marine monitoring: General rules. GB17378-2007. Beijing. Stand. Press China, 2007: 4-5.
Standardization Administration. 2007. The specification for marine survey: Marine biological survey (GBT12763.6-2007). Beijing Stand. Press China, 2007: 56-58.
Tang, S.L., Chen, C.Q., Zhan, H.G., Xu, D.Z., and Liu, D.Z., 2007. Retrieval of euphotic layer depth of South China Sea by remote sensing. J. trop. Oceanogr., 26: 9-15.
Wang, X.H., Du, F.Y., Qiu, Y.S., Li, C.H., Sun, D.R. and Jia, X.P., 2010. Various of fish species diversity asemble age and abundances in Daya Bay in 1980-2007. China J. appl. Ecol., 21: 235-242.
Wang, Y.F., Hu, Q.W., Yu J., Chen P.M. and Shu, L.M., 2019. Effect assessment of fishery resources proliferation in Zhelin Bay marine ranching in eastern Guangdong. S. China Fish. Sci., 15: 12-19.
Wang, Y., Lou, Z., Sun, C., Wu, M. and Han, S., 2006. Multivariate statistical analysis of water quality and phytoplankton characteristics in Daya Bay, China, from 1999 to 2002. Oceanologia, 48: 193-211.
Wang, Z.H., Li, C.H. and Jia. X.P., 2005. The fishery production from the north part of the South China Sea using the primary production method. Mar. Fish. Res., 26: 9-15.
Wang, Z.H., Mu, D.H., Li, Y.F., Yu, C. and Zhang, Y.Y., 2011. Recent eutrophication and human disturbance in Daya Bay, the South China Sea: Dinoflagellate cyst and geochemical evidence. Estuar. Coast. Shelf. Sci., 92: 403-414. http://doi.org/10.1016/j.ecss.2011.01.015
Wu, M.L. and Wang, Y.S., 2007. Using chemometrics to evaluate anthropogenic effects in Daya Bay, China. Estuar. Coast. Shelf. Sci., 72:732-742. http://doi.org/10.1016/j.ecss.2006.11.032
Xiao, F.S., 2003. Fishery resource capacity in ecosystem of Minnan-Taiwan shoal fishing ground. J. Oceanogr. Taiwan. , 22: 449-456.
Ye, H., Chen, C., Sun, Z., Tang, S., Song, X., Yang, C., Tian, L. and Liu, F., 2015. Estimation of the primary productivity in pearl river estuary using MODIS data. Estuar. Coast., 38: 506-518. https://doi.org/10.1007/s12237-014-9830-5
Yin, J.P., Wang, Y.S., Xu, J.R., Sun C.C. and Zhang F.Q., 2006. Seasonal thermocline in the Daya Bay and its influence on the environmental factors of seawater. Mar. Sci. Bull., 25: 3-10.
Yu, J., Chen P.M., Tang, D.L. and Qin, C.X., 2015. Ecological effects of artificial reefs in Daya Bay of China observed from satellite and in situ measurements. Adv. Space Res., 55: 2315-2324. https://doi.org/10.1016/j.asr.2015.02.001
Yu, J., Tang, D.L., Yao, L.J., Chen, P.M., Jia, X.P. and Li, C.H., 2010. Long-term water temperature variations in Daya Bay, China using satellite and in situ observations. Terr. Atmos. Ocean Sci., 21: 393-399. https://doi.org/10.3319/TAO.2009.05.26.01(Oc)
Yu, J., Hu, Q.W., Yuan, H.R., Tong, F., Chen, P.M. and Mao, J.M., 2017a. Effects assessment of summer fishing moratorium in Daya Bay in the Northern South China Sea. J. Geosci. Environ. Prot., 5: 96-108. https://doi.org/10.4236/gep.2017.57010
Yu, J., Mao, J.M., Yuan, H.R., Feng, X., Chen, P.M. and Hu, Q.W., 2017b. Seasonal variation of fishery resources in Egong Bay, Shenzhen. J. South. Agric., 48: 1106-1112.
Yu, J., Hu, Q.W., Yuan, H.R. and Chen, P.M., 2018. Effect assessment of summer fishing moratorium in Daya Bay based on remote sensing data. S. China Fish. Sci., 14: 1-9.
Zhang, Y.N, Ghen, J.S., Wang, J.J, Han, Y. and Lin, Y., 2017. remote sensing inversion for net primary productivity and its spatial-temporal variability in Shenzhen coastal waters. J. appl. Oceanogr., 36: 311-318.
To share on other social networks, click on any share button. What are these?


