
Proximate Analysis of Grass Carp (Ctenopharyngodon idella) from Southern Punjab, Pakistan


Research Article
Proximate Analysis of Grass Carp (Ctenopharyngodon idella) from Southern Punjab, Pakistan
Muhammad Khalid1,2 and Muhammad Naeem2*
1Department of Zoology, Govt. Emerson College Multan, Pakistan; 2Institute of Pure and Applied Biology, Bahauddin Zakariya University, Multan, Pakistan.
Abstract | Proximate analysis implies percent composition of moisture, protein, lipids and carbohydrates. The purpose of this study was to affirm the proximate composition and nutritious status of Ctenopharyngodon idella. Standardized methods were used to determine the proximate composition of 72 samples. On wet weight basis, mean percentage for water was 80.76 %, ash 3.40 %, 4.31 % for fat and 11.53 % for protein in C. idella. Percent water contents showed inverse relationship with % protein (dry and wet body weight), % ash and % organic contents (wet body weight). Wet body weight (W) showed negative correlation (P < 0.001) with percent water, percent fat (dry and wet body weight) and positive correlation with percent protein, ash (wet and dry weight). Total length (TL) showed positive correlation with water, fat, ash, protein and organic content (dry and wet body weight). Condition factor (K) was found significantly correlated (P < 0.05) only with % water and % ash. Multiple correlation among W, TL, K and different body content showed significant correlations. Results indicated that Grass Carp is a rich source of protein (58.35%) in dry body weight, additionally, the pioneer reference to the proximate analysis for this species from farming system of southern Punjab, Pakistan is provided.
Received | Febraury 09, 2018; Accepted | July 20, 2018; Published | August 27, 2018
*Correspondence | Muhammad Naeem, Institute of Pure and Applied Biology, Bahauddin Zakariya University Multan, Pakistan; Email:
dr_naeembzu@yahoo.com
Citation | Khalid, M. and M. Naeem. 2018. Proximate analysis of grass carp (Ctenopharyngodon idella) from Southern Punjab, Pakistan. Sarhad Journal of Agriculture, 34(3): 632-639.
DOI | http://dx.doi.org/10.17582/journal.sja/2018/34.3.632.639
Keywords | Body composition, Farmed Fish, Condition factor, Lipids, Ash, Protein
Introduction
The learning of proximate composition of fish is of foremost significance to assess its feeding status and physiological condition (Chandrashekhar et al., 2004). Fishes are the least expensive wellspring of essential nutrients. Proximate composition of fishes can be influenced by numerous variables, including species, ecological conditions, fish size, protein level in provided diet as well as rate of feeding (Ogata and Shearer, 2000). Precise forecast of proximate composition of economically valuable of cultured fishes at specific body weight of fish could lessen food waste, enhance efficiency enhance the profit abilities. Few have endeavored to anticipate the body composition from live body weight (Naeem et al., 2016).
The estimation of some proximate profiles (protein substance, carbohydrates with low lipids, and high moisture content, percentage ash) is frequently important to guarantee that they meet the prerequisites of nourishment directions and business particulars (Waterman, 2000). Variations in chemical composition among various species might be ascribed to fish feed composition, feeding types with its rate of feeding habitat of fish, sex, age, size, genetic attributes and season (Abdullahi, 2001; Ajah, 2009).
Ctenopharyngodon idella (Grass carp) is one of the major carp which is usually devoured in Pakistan. Due to its meats good quality and its taste that’s Grass carp got the attention of fish culturist’s throughout the world for culture purpose (FAO, 2007). The aim of present study to know about the value of moisture, ash, protein, organic contents, lipids and their variations with change in fish size and condition factor, to help fish processors, marketers and nutritionists in choosing most suitable species having optimum protein level for human use.
Materials and Methods
A total of 72 samples of farmed Grass carp (Ctenopharyngodon idella) having different sizes ranging from 67.00 to 722.00 cm total length and 19.00 to 240.00 g body weight were randomly got from Alrahem Fish hatchery, Muzaffargarh 30o 124401, N 71o 234098E for proximate composition analysis by using cast net and were shifted to laboratory, concerned with fish research purpose in Institute, then all samples were dried by using paper towel.
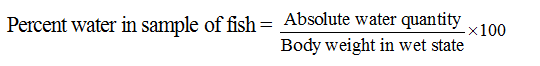
Wet body weight and total length each sample was taken by the help of digital electrical balance MP-3000 Chyo, Japan closest to 0.01 gram and wooden measuring board closest to 0.01 cm. For the assessment of water mass in each fish sample, whose wet weight and total length was already measured were put in already weighted foil of aluminum plates for the purpose of drying till no change in weight was seen in electrically operated oven named as Memmert, west Germany at the temperature of 60−70 oC. When there was no change in weight seen further then dry weight noted finally.
With the help of accompanying equations, the total water and percent water in each fish sample was found.

For further studies, every dry mass was smashed with the help of pestle, mortar till formation of powder of dry body of fish. It was further homogenized by using electric blender of Moulinex company France, model LM207041.
For finding of ash in each sample fish, 0.50 g sample was putted in china crucible which is already weighted. The clay crucible having sample was placed to ash in Muffle furnace (Bamford) at the temperature of 450−500 oC around 24 hours, then cooled at 50 oC in oven. (Gallenkamp, England) and weighted again to find contents of ash in taken fish dry mass for the purpose of ashing. Amount of ash and percent ash in both wet and dry mass basis was calculated.

![]()

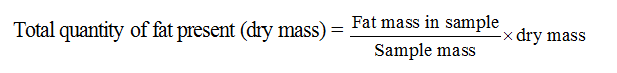
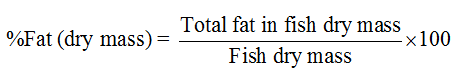
Fat contents were found with the help of dry extraction strategy by taking mixture in 1:2 proportion of methyl alcohol and chloroform by utilizing dry tissue (Cui and Wootton, 1988; Salam and Davies, 1994). One gram dry tissue in powdered form was poured and mixed in mixture of 10 ml volume by stirring with the help of glass rod. It was followed by the removal of supernatant into well washed dried and already weighted little bottles. For the evaporation of solvent these already weighted little bottles were kept on incubator (Memmert ® 8540) at the temperature range from 40 oC to 50 oC till dry state leaving behind lipid mass. With the help of electronic balance weight of lipid mass was find out to close 0.001 g. By using the given formulas total contents of fats were found out (in the dry and wet weight) of the fish along with percentage of fats in all the samples.

By using difference technique gross available quantity of protein was measured from dry mass, of other constituents ash, fat, water mass (Dawson and Grimm, 1980).
![]()
![]()
Carbohydrates don’t frame a noteworthy part of fish and consequently are for the most part disregarded due to its very small extent. (Salam et al., 1994; Salam and Davies, 1994). Various variables like TL, along with condition factor (K) have linked with differences in various body constituents. Multiple regression were applied to know interconnections among these variables.

W indicates wet body weight Y for various body constituents while X for total length, body weight or condition factor (K). a, b1, b2 are known as constants.
Statistical analysis
Theoretically and graphically statistical analysis including mean, Standard error, range, regression, correlation, t-distribution, multiple regression, plotting of data, were carried out by statistical packages, SPSS, MINI-TAB and MS-EXCEL program followed by ZAR (1996).
Results and Discussion
The mean percent and standard deviations of for water were 80.76 ± 4.40 for water, 3.40 percent ± 0.98 for ash (wet weight), 17.76 percent ± 3.46 for ash (dry body weight), 4.31 percent ± 1.48, 23.89 percent ± 10.14 for fat (wet body weight and dry body weight) and 11.53 percent ± 4.18 for protein (wet body weight) 58.35 percent ± 10.49 protein content (dry body weight) (Table 1). The relationships of % water against other body constituents (in wet and dry weight) were highly significant (P<0.001) except with %fat (wet weight), % organic contents (dry weight) which were non significant. Percent water has inverse relation with protein (wet and dry body weight), ash (wet weight), organic contents (wet body weight). % water showed positive correlation to fat, ash (dry weight) (Table 2).
Table 1: Mean along with range different components of Ctenopharyngodon Idella.
| Body components |
X̅ ± S |
R = Xm− Xo |
| Water content (%) | 80.76±4.40 | 73.30 to 9.21 |
| Ash content (%Wet weight) | 3.40±0.98 | 1.34 to 5.91 |
| Ash content (%dry weight) | 17.76±3.46 | 8.99 to 25.01 |
| Fat content (%wet weight) | 4.31±1.48 | 1.39 to 7.52 |
| Fat content (% dry weight) | 23.89±10.14 | 5.99 to 45.00 |
| Protein contents (%wet weight) | 11.53±4.18 | 5.21 to 19.56 |
| Protein contents (%dry weight) | 58.35±10.49 | 35.00 to 76.00 |
X̅: mean; S: Standard error; R: Range.
Highly significant relationships (P < 0.001) were observed between body weight to all other body constituents with r-value ranging from 0.737 to 0.998. Body weight showed negative correlation with percent water, percent fat (wet and dry state) and organic contents (wet wt.). Positive correlation (P<0.001) was found between body weight with protein and ash (wet weight and dry weight), indicated in Table 3. Total length showed highly positive relationships (P<0.001) to water, fat, ash, and protein part (dry and wet weight) with r-value ranging 0.731 to 0.973 (Table 4).
The condition factor value was found 1.20 ± 0.09 (Mean ± S.D) in the present study. Condition factor showed negative correlation with % organic contents, % protein, % fat, % ash while it has positive correlation with % water. Condition factor had least significant relationships (P < 0.05) with percent water (r=0.235), percent organic contents (r=0.263) while non significant relations (P>0.05) with percent fat, percent protein and percent ash were observed (Table 5).
Percent water along with protein, organic content and fat showed highly significant intercorrelation to body weight (wet) along with condition factor (Table 6). Same relationships were observed between body constituents versus wet body weight and total length; wet body weight & condition factor (Table 7,8).
Results of the present study indicated that the major constituent of Grass carp (Ctenopharyngondon idella) body is water, 80.76 ± 4.40 (Mean, ± SD) and range was 73.30 to 89.21, in percentage. The literature has revealed approximately similar value of water in C. idella and other fresh water species. Percentage value of water was reported 78.79 ± 1.89 in C. idella by Ammanullah and Bhatti (1999), 78.16 for Amblypharngodon mola by Chakraborty (2015), 80.80 for cultured Orechromus niloticus by Job et al. (2015) and 77.82 for farmed O. mykiss collected from Trout hatchery, Murree by Naeem et al. (2016). In our study the value of ash in percent dry weight was found 17.76 ± 3.46 with the range 8.99 to 25.01. In another study, its value was 1.24 to 1.48 in fresh water Tilapia, O. niloticus (Olopade et al., 2016) and 12.77 ± 3.29 in Oncorhynchus mykiss (Naeem et al., 2016). This difference is due to different habitats and species. The value and range of ash in percent wet weight was 3.40 ± 0.98 and 1.34 to 5.91 in present study. The value of ash (Percent wet weight) was recorded in brackish water for T. alulunga, O. unicolor, E. affinis were 3.27, 2.00, 3.27 respectively by Aberoumand (2014). In carnivorous Channa punctatus its value was reported 2.01 ± 0.13 (Chakrabotry, 2015). The variation in value may be due to their feeding status.
Table 2: The comparison of relationship between % of body constituent and of % content of water of C. idella (n:72).
| Relationships | r | y−intercept | Regression coefficient (b) |
S X̅ (b) |
Calculated value of t− statistics when b = 0 |
|
% Water (x) %Fat wet weight (y) |
0.180 n.s
|
-0.578
|
0.061
|
0.040
|
1.525ns
|
|
% Water (x) %Fat dry weight (y) |
0.648***
|
-96.503
|
1.491
|
0.210
|
7.1***
|
|
% Water (x) %Protein wet weight (y) |
0.939***
|
83.506
|
-0.891
|
0.039
|
-22.84***
|
|
% Water (x) %Protein dry weight(y) |
0.648***
|
-96.503
|
1.491
|
0.210
|
7.1***
|
|
%Water (x) %Ash wet weight (y) |
0.761***
|
17.072
|
-0.169
|
0.017
|
-9.941***
|
|
% Water (x) %Ash dry weight (y) |
0.648***
|
-96.503
|
1.491
|
0.210
|
7.1***
|
|
% Water (x) % Organic contents wet weight (y) |
0.985***
|
82.928
|
-0.831
|
0.017
|
-48.882***
|
|
% Water (x) % Organic contents dry weight (y) |
0.105 ns
|
88.923
|
-0.083
|
0.093
|
-0.892***
|
Table 3: The comparison of relation between body weight (Wet, taken in grams), body ingredients (wet weight, taken in grams) of C. idella (n: 72).
| Interconnection | r | y−intercept | Regression coefficient (b) |
S X̅ (b) |
Calculated value of t− statistics when b = 1 |
|
Body weight (x) Water content (y) |
0.998***
|
7.253
|
0.764
|
0.006
|
-165.903***
|
|
Log body weight (x) Log water content (y) |
0.994***
|
-0.010
|
0.963
|
0.013
|
-75.9601***
|
|
Body weight (x) Fat content (y) |
0.776***
|
2.766
|
0.027
|
0.003
|
-333.306***
|
|
Log body weight, g (x) Log fat content (y) |
0.737***
|
-1.042
|
0.844
|
0.092
|
-10.0256***
|
|
Body weight (x) Protein content (y) |
0.950***
|
-8.075
|
0.163
|
0.006
|
-166.504***
|
|
Log body weight (x) Log protein content (y) |
0.862***
|
-1.591
|
1.276
|
0.090
|
-9.83511***
|
|
Body weight (x) Ash content (y) |
0.960***
|
-1.944
|
0.045
|
0.002
|
-499.955***
|
|
Log body weight (x) Log ash content (y) |
0.897***
|
-1.912
|
1.189
|
0.070
|
-13.0967***
|
|
Body weight (x) Organic contents (y) |
0.973***
|
-5.309
|
0.191
|
0.005
|
-199.809***
|
|
Log body weight (x) Log organic contents (y) |
0.925***
|
-1.185
|
1.165
|
0.057
|
-16.3789***
|
Percent water showed significant and negative correlation with percent ash (%wet weight) as reported by Naeem and Ishtiaq (2011). The value of fat in present study was found 4.3 ± 1.48, with a range from 1.39 to 7.52 in percent wet weight. In another study its value in percent wet weight was recored as 3.46 in
Table 4: The comparison of relation between total length (TL, taken in centimeter) and various body ingredients (taken in grams) of C. idella (n: 72).
| Relationships | r | y−intercept | Regression coefficient (b) |
S X̅ (b) |
Calculated value of t− statistics when b = 3 |
|
Total length (x) Water (y) |
0.971*** |
-412.807
|
23.080
|
0.684
|
18.694*** |
|
Log total length (x) Log water content (y) |
0.973*** |
-1.795
|
2.840
|
0.080
|
-34.66***
|
|
Total length (x) Fat content (y) |
0.797*** |
-13.522
|
0.877
|
0.079
|
-37.09***
|
|
Log total length (x) Log fat content (y) |
0.731*** |
-2.648
|
2.518
|
0.281
|
-8.158***
|
|
Total length (x) Protein content (y) |
0.931***
|
-98.886
|
4.975
|
4.975
|
4.371***
|
|
Log total length (x) Log protein content (y) |
0.871***
|
-4.122
|
3.882
|
0.262
|
-7.568***
|
|
Total length (x) Ash content (y) |
0.924***
|
-26.537
|
1.357
|
0.067
|
-43.419***
|
|
Log total length (x) Log ash content (y) |
0.889***
|
-4.178
|
3.551
|
0.218
|
-10.210***
|
|
Total length (x) Organic contents (y) |
0.960***
|
-112.407
|
5.853
|
0.204
|
-8.852***
|
|
Log total length (x) Log organic contents (y) |
0.931***
|
-3.481
|
3.534
|
0.165
|
-14.64***
|
Table 5: Population variables: condition factor contrary to percent constituents of fish body (wet weight) in C. idella(n: 72).
| Relationships | r | y−intercept | Regression coefficient (b) |
S X̅ (b) |
Calculated value of t− statistics b = 0 |
|
Condition factor (x) % Water (y) |
0.235*
|
68.922
|
9.900
|
4.885
|
2.026*
|
|
Condition factor (x) % Fat (y) |
0.056ns
|
5.256
|
-0.790
|
1.692
|
-0.466ns
|
|
Condition factor (x) % Protein (y) |
0.214ns |
21.741
|
-8.542
|
4.659
|
-1.83ns
|
|
Condition factor (x) % Ash (y) |
0.061ns
|
4.081
|
-0.568
|
1.116
|
-0.508ns
|
|
Condition factor (x) % Organic contents (y) |
0.263*
|
26.997
|
-9.332
|
4.089
|
-2.282**
|
Table 6: Multiple regression link of percent water, fat, protein, as well as ash to condition factor, body weight in C. idella.
| Interrelationship | r | a |
b̂ı± S.E (b̂ı) |
b̂2± S.E (b̂2) |
r2 |
|
% Water = a+b1W+b2 K |
.389*** | 70.368 |
-0.009±0.003 |
10.368±4.668 |
0.151 |
|
%Fat = a+b1W+b2K |
.239* | 5.622 |
-0.002±0.001 |
-0.672±1.659 |
0.057 |
|
%Protein = a+b1W+b2 K |
.399*** | 20.245 |
0.009±0.003 |
-9.026±4.408 |
0.159 |
|
%Ash = a+b1W+b2K |
.310** | 3.764 |
0.002±0.0007 |
-0.671±1.071 |
0.096 |
Salmo trutta (Mustafa and Dikel, 2015) and 4.32 ± 0.16 in Bagrus domak (Teame et al., 2016). The mean value, range of fat in percent dry body weight was 23.9 ± 10.14 and 5.99 to 45.00, respectively. Previous studies also show its value in Hypothalmicthys molitrix 19.109 ± 3.66 (Sanaullah and Ahmad, 2014) and 22.79 ± 5.93 in O. mykiss (Naeem et al., 2016). Tenyang et al. (2016) reported the values of fat content in Mullet, Carp and Cat fish in Megalake 18.8 ± 0.89, 21.76 ± 0.70 and 30.34 ± 2.16, respectively. This variation may be due to variation in habitat and species. Percent water has non significant relation (P > 0.05) with percent fat (wet body weight) and highly significant correlation with percent fat (dry weight). The same trend was also reported by Naeem et al. (2013).
Table 7: Multiple regression link of percent water, fat, as well as protein and ash to body weight, total length of C. idella.
| Interrelationship | r | a |
b̂ı±S.E (b̂ı) |
b̂₂±S.E (b₂) |
r2 |
|
% Water = a+b1W+b2 TL |
0.425 *** | 107.22 |
0.032 ±0.015 |
-1.321 ±0.476 |
0.18 |
|
% Fat = a+b1W+b2 TL |
0.261*
|
1.695
|
-0.007 ±0.005 |
0.168 ±0.171 |
0.07
|
|
% Protein = a+b1W+b2 TL |
0.420 *** | -10.51 |
-0.024 ±0.014 |
1.079 ±0.454 |
0.18 |
|
% Ash = a+b1W+b2 TL |
0.311 ** | 1.596 |
-0.0002 ±0.003 |
0.073 ±0.111 |
0.09 |
Table 8: Multiple regression link of percent water, fat, as well as protein and ash to total length, condition factor of C. idella.
| Relationship | r | a |
b1 ± S.E |
b2 ± S.E |
r2 |
|
%Water = a + b1 TL + b2 K |
0.416*** | 78.596 |
-0.333± 0.106 |
8.807± 4.617 |
0.173 |
|
%Fat = a + b1 TL + b2 K |
0.214* | 7.229 |
-0.068± 0.038 |
-1.013± 1.672 |
0.046 |
|
%Protein = a + b1 TL + b2 K |
0.422*** | 12.024 |
0.335± .100 |
-7.444± 4.369 |
0.178 |
|
%Ash = a + b1 TL + b2 K |
0.313** | 2.151 |
0.066± 0.024 |
-0.350± 1.073 |
0.098 |
Water constituent showed highly significant (P < 0.001) negative correlation with protein, ash and organic content in wet weight condition which is in general agreement with findings of different investigators (Naeem and Ishtiaq, 2011; Naeem et al., 2013).
Mean, range for protein in percent wet and dry weight were 11.53 ± 4.18 and 58.35 10.49 in Grass carp. Proteins recorded in cold water fish, O. mykiss in percent wet weight were 64.52 ± 3.88 (Chakrabotry, 2015) while Naeem et al. (2016) reported protein content (% dry weight) 66.66 ± 02.31 in Hypothalmichthy molitrix.
The value of b indicates variation in body constituents and growth pattern with increase in weight and total length. When b is equal to 3 or close to 3 the growth in fish is isometric with length. While, when b is far less or greater than 3 the growth in fish is positive allometric. Similar the case with wet body weight but the reference value for b is 1.00 (Naeem et al., 2016). All body constituents except fat showed positive allometric growth with log body weight as their b value is greater than 1. Naeem et al. (2016) also reported that all constituents showed positive allometry with weight in fresh water rainbow trout (Oncohyhynus mykiss).
The value of b for log total length with log water content and fat is less than 3 shows that water and fat contents decrease as fish length increase i.e. negative allometric pattern. Value b is greater than 3 with protein, ash and organic contents. Results indicated that water and fat contents showed negative allometry, while protein and ash showed positive allometry with the increase in fish size. This all suggested that during the growth of Grass carp, the quantity of water and fat decreases while ash and protein contents increases. Earlier studies show that the value b is above 3 for all body constituents in fresh water Rainbow trout, O. mykiss collected from trout hatchary, Mastore Murree and Swat (Naeem et al., 2016).
Present study shows that condition factor has non-significant relation with percent fat, percent protein, percent ash and least significant effect on water and organic contents. Least significant effect of condition factor (K) on water and organic contents has also reported in bighead carp (Aristichys nobilis) collected from Indus river near Ghazi Ghat. (Naeem et al., 2013).
Conclusions
The results present study reveals that various proximate components (water, protein, lipids, ash, organic contents) not only vary with change of species, but also with change body weight and total length and condition factor. Though this study the body constituents value can be predicted by just knowing fish size, without scarifying the fish. The result of this were proved that Grass carp has high proteincious value. So, it’s used should be more promoted as it is very useful in fishing industry for food processors marketers and nutritionists.
Authors Contribution
Muhammad Khalid: Carried out the experiment, analysed the data and wrote the manuscript with the support of Muhammad Naeem.
Muhammad Naeem: Conceived and planned the experiment and supervised the research work.
References
Abdullahi, S.A. 2001. Investigation on nutritional status of Chrysicthys nigrodigitatus, Barus filamentous and Aucheoglanis occidentalis (Family: Bagridae). J. Arid Zone Fish.. 1: 39−50.
Aberoumand, A. 2014. Preliminary studies on nutritive and organoleptic properties in processed fish fillets obtained from Iran. Food Sci. Tech. (Camp.). 34: 287−291. https://doi.org/10.1590/fst.2014.0042
Ajah, P.O. 2009. Fish breeding and hatchery management. Jerry commercial productions, Calabar.183.
Amanullah, A.S. and M.N. Bhatti. 1999. Effect of size on the processing yield components of grass carp, Ctenopharyngodon idella (Val.). Acta. Sci. 9: 33-50.
Chakraborty, S.C., K.B. Brahma and K.A. Goyal. 2015. Proximate composition of three small indigenous fish species encountered in local fish market of Kokrajhar, BTAD, Asam. India. J. App. Res. 5: 712−714.
Chandrashekhar, A., P. Rao and A.B. Abidi. 2004. Changes in muscle ciochemical composition of Labeo rohita (Ham.) in relation to season. India. J. Fish. 51: 319−323.
Cui, Y. and R.J. Wootton. 1988. Bioenergetics of growth of Cyprinids, Phoxinus, The Effect of the ration and temperature on growth rate and efficiency. J. Fish Biol., 33: 763−773. https://doi.org/10.1111/j.1095-8649.1988.tb05521.x
Dawson, A.S. and A.S. Grimm. 1980. Quantitative seasonal changes in the protein, lipid and energy content of the carcass, ovaries and liver of adult female plaice, Pleuronectes platessa. J. Fish Biol. 16: 493−504. https://doi.org/10.1111/j.1095-8649.1980.tb03729.x
FAO. 2007. Fishery statistics. Aquaculture production: In: Food and Agriculture Organization of the United Nations, Rome Italy, Year book 2005. 2007. 55-56.
Job, B.E., E.E. Antai, A.P. Inyang-Etoh, G.A. Otogo and H.S. Ezekiel. 2015. Proximate composition and mineral contents of cultured and wild tilapia (Oreochromis niloticus), (Pisces: Cichlidae), (Linnaeus, 1758). Pak. J. Nutri. 14: 195.Mustafa, O. and S. Dikel. 2015. Comparison of Body compositions and Fatty aid profiles of farmed and wild rainbow trout (Oncorhynchus mykiss). Food Sci. Tech. 3: 56−60.
Mustafa, O.Z. and S. Dikel. 2015. Body compositions and fatty acid profile of Salmo Trutta Macrostigma caught from Korkun Brook. Advan. Zool. Bot. 3(4): 190 – 192.
Naeem, M. and A. Ishtiaq. 2011. Proximate composition of Mystus bleekeri in relation to body size and condition factor from Nala Daik, Sialkot, Pakistan. Afr. J. Biotechnol. 10(52): 10765-10773. https://doi.org/10.5897/AJB10.2339
Naeem, M., A. Salam and and A, Zuberi. 2016. Proximate composition of freshwater Rainbow Trout (Oncorhynchus mykiss) in relation to body size and condition factor from Pakistan. Pak. J. Agric. Sci. 53: 497−502. https://doi.org/10.21162/PAKJAS/16.2653
Naeem, M., A. Salam, N.T. Narejo and A. Tahir. 2013. Body composition of edible portion of wild bighead carp Aristichthys nobilis in relation to body size and condition factor from Indus River, Pakistan. Sindh Univ. Res. J. Surj. (Sci. Series). 45: 353−356.
Ogata, H.Y. and K.D. Shearer. 2000. Influence of dietary fat and adiposity on feed intake of juvenile red sea bream Pagrus major. Aquacult.189: 237−249. https://doi.org/10.1016/S0044-8486(00)00374-4
Olopade, O.A., I.O. Taiwo, A.A. Lamidi and O. Ayodeji. 2016. Proximate Composition of Nile Tilapia (Oreochromis niloticus) (Linnaeus, 1758) and Tilapia Hybrid (Red Tilapia) from Oyan Lake, Nigeria. Bull. UASVM Food Sci. Tech. 73. https://doi.org/10.15835/buasvmcn-fst:11973
Salam, A. and P.M.C. Davies. 1994. Body composition of northern pike (Esox lucius L) in relation to body size and condition factor. Fish. Res. 19: 193-204. https://doi.org/10.1016/0165-7836(94)90038-8
Salam, A., A.M. Chatta, Q.U. Zaman, Q.A. Akhtar and S. Khan. 1994. Weight-length and condition factor relationship of a fresh water hatchery reared rainbow trout, Oncorhynchus mykiss from swat, Pak. Act. Sci.4: 67−72.
Sanaullah and T. Ahmad. 2014. Nutritional and medical importance of fish. A mini review, Rev. prog. 2(2).
Teame, T., P. Natarajan and Z. Tesfay. 2016. Proximate and mineral composition of some commercially important fish species of tekeze reservoir and lake Hashenge, Ethiopia. Int. J. Fish. Aquat. Stud. 4: 160−164.
Tenyang, N. 2016. Proximate composition, fatty acid and mineral contents of four freshwater fish from Megalake (Far northern region of ameroon). Am. J. Food Sci. Tech. 14: 6469.
Waterman, J.J. 2000. Composition and quality of fish. Torry Research Station, Edinburgh Wimalasena, S., and Jayasuriya, M.N.S. (1996) Nutrient analysis of some fresh water fish. J. Nation. Sci. Counc. Sri Lanka. 24: 21−26.
Zar, J.H. 1996. Biostatistical analysis. Prince Hall, New Jersey.
To share on other social networks, click on any share button. What are these?


