

Multicollinearity Problem and Bias Estimates in Japanese Quail


Multicollinearity Problem and Bias Estimates in Japanese Quail
Mustafa Sahin1,*, Esra Yavuz1 and Fatih Uckardes2
1Department of Animal Production, Kahramanmaraş Sütçü İmam University, 46050 Kahramanmaraş, Turkey
2Department of Biostatistics and Medical Informatics, Basic Medical Sciences, Adiyaman University, 02040 Adiyaman, Turkey
ABSTRACT
The aim of this study is to estimate the albumen index value that is one of the interior egg quality traits using the Least Squares (LS), Ridge Regression (RR) and Principal Components Regression (PCR) methods. For this reason, eggs were collected from 20 to 24 weeks of age, non-selected and random-mated Japanese quails. In this study, we investigated the characteristics of egg external quality such as egg width (X1), egg length (X2), Haugh unit (X3), and shape index (X4). The impact of these variables on albumen index was analyzed. Due to the multicollinearity between independent variables, the standard errors and VIF values of the partial regression coefficients in the LS method were found to be quite high. Therefore, the RR and PCR methods were used as an alternative to LS. Compared with LS, PCR and RR led to small standard deviations and more accurate and more reliable partial regression coefficients. As a result, it was concluded that the use of RR and PCR analysis methods could be more accurate instead of the LS method under multicollinearity problem.
Article Information
Received 20 July 2017
Revised 23 October 2017
Accepted 30 December 2017
Available online 27 March 2018
Authors’ Contribution
MS, EY and FU designed the study. EY and MS collected the data while FU and EY analysed and interpreted the data. All the authors participated in writing the manuscript.
Key words
Multicollinearity, Ridge, Principal components, Least squares, Japanese quail.
DOI: http://dx.doi.org/10.17582/journal.pjz/2018.50.2.757.761
* Corresponding author: ms66@ksu.edu.tr
0030-9923/2018/0002-0757 $ 9.00/0
Copyright 2018 Zoological Society of Pakistan
Introduction
Regression analysis is widely used in many disciplines such as Agriculture, Medicine, and Social Sciences, etc. to explain the total variation in the dependent variable and to determine the independent variable or variables that affect the dependent variable. In particular, regression equations are widely used in examining the interrelationships between variables obtained in the field of animal husbandry (Baker et al., 1988; Pinto et al., 2006). In poultry breeding, the use of regression equations in evaluating the internal and external quality characteristics of eggs of chicken and Japanese quails is remarkably widespread (Baker et al., 1988; Mahmood et al., 2014). For example, the egg external quality characteristics such as egg weight, egg length, Haugh unit, and shape index are utilized to estimate the inner quality index of Japanese quail eggs. Thus, these values are used in estimating chick quality both in commercial and breeding stock of eggs (Marks, 1996).
In many studies on animal husbandry, high correlations between independent variables in multiple regression analysis lead to the nearly singular X’X matrix (Düzgüneş et al., 1987). In such cases, the estimates of the partial regression coefficients can logically be expected to be very large, with opposite signs and standard errors being very high. This is called a multicollinearity problem. Ridge regression (RR) and Principal Component Regression (PCR) are the techniques used to obtain more realistic estimates than the multicollinearity-sensitive Least Squares (LS) method (Ergüneş, 2004; Rathert et al., 2011; Üçkardeş et al., 2012).
In that regard, the aim of the present study is to estimate regression coefficients using the RR and PCR methods as an alternative to the LS method, considering that multicollinearity may be a problem in estimating the albumen index from the exterior quality characteristics of eggs.
Materials And Methods
Material
Eggs from randomly-mated 20-24-week-old Japanese quails were used in the current study. Quails were fed with starter concentrate containing 24% HP, 2900 kcal/kg ME for the first 3 weeks. Between the 4th and the 6th week, quails were fed with concentrate containing 20% HP, 2800 kcal/kg ME. After the 6th week, they were fed with concentrate containing 17% HP, 2700 kcal/kg ME. During the first 3 weeks, 23 h/day lighting was applied, in the following periods, 16 h lighting and 8 h darkness per day were applied. Eggs were weighed using a scale of 0.1 g sensitivity. The length measurements of eggs were taken with a digital caliper. Egg width (X1), egg length (X2), Haugh unit (X3), and shape index (X4) were analyzed. The albumen index (AI) was determined as described by Alkan et al. (2010).
Methods
Multiple regressions is one of the most commonly used methods to describe relationships between a dependent variable and a set of independent variables. The regression equation takes the following form:
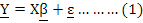
Where, Y is the vector of observations on the dependent variable, X is the matrix of observations on the explanatory variables, β is the vector of unknown parameters, and ε is the vector of randomly distributed errors.
The vector of partial regression coefficients in Equation 1 is estimated according to the following formula:
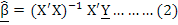
The condition that this equation is valid is the non-singularity of the X’X matrix. If the X’X matrix, is close to singular, the estimated values obtained by the LS method are logically expected to be very different (usually very large and opposite), causing the variances to inflate and the parameters to become meaningless (Düzgüneş et al., 1987; Albayrak, 2005; Akdeniz and Erol, 2006).
Determination of multicollinearity
Multicollinearity exists when two or more of the predictors in a regression model are moderately or highly correlated. There are many indicators that reveal the existence of multicollinearity. These are respectively listed as follows:
Simple correlation coefficient
The correlation coefficient between the independent variables shows that there is a multicollinearity problem if its absolute value is close to 1 (Albayrak, 2005).
Variance inflation factor (VIF)
One of the most frequently used methods in determining the problem of multicollinearity is the variance inflation factor (VIF). In calculating the VIF values, the determination coefficients are utilized. VIF is given by the following formula:
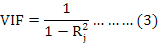
Where, R2j is the coefficient of determination between the jth independent variable and all other independent variables. If VIF ≥ 10, then multicollinearity is assumed (Albayrak, 2005).
Eigenvalues of the X’X matrix
The eigenvalues are defined as the variance explained in the eigenvectors. The eigenvalues of the X’X correlation matrix λ1, λ2, ……… λp obtained by the LS method are used to measure the degree of multicollinearity. Vinod and Ulah (1981) proposed a condition index (CI) based on the largest and smallest eigenvalues:
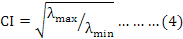
If CI < 10, that means there is little multicollinearity, thus, a serious problem cannot be observed. Multicollinearity is medium-leveled if 10 ≤ CI ≤ 30, while CI > 30 indicates severe multicollinearity (Pagel and Lunneborg, 1985; Gujarati, 1995; Rathert et al., 2011).
Tolerance value
Another factor that is used in determining the multicollinearity is the tolerance value (TV) obtained by equality:

The resulting TV value is caused by a larger VIF result. Hence, a small TV value implies the presence of multicollinearity (Albayrak, 2005).
Ridge regression
In the case of multicollinearity, the RR method proposed by Hoerl and Kennard (1970) is an alternative to the LS method. In the RR method, with a positive k bias constant to the diagonal X’X matrix of the equation 2 aims to find appropriate parameter values (Düzgüneş et al., 1987) .

When the value of k is zero, the same parameter estimation values as in the LS are obtained. By increasing the value of k in the RR method, a biased estimate is obtained. However, there is a serious reduction in the value of variance.
The optimum k value of ridge estimator
The determination of the k bias constant for the RR model is based on eigenvalues. detected calculating. Many researchers have proposed various formulas to determine k value (Hoerl and Kennard, 1970; Lee and Campbell, 1985; Akdeniz and Erol, 2006). In this study, the following formula proposed by Kurtuluş (2001) was used in determining the optimum k value of Ridge Estimator.
Principal component regression
In the case of multicollinearity among independent variables, instead of directly applying the Least Squares method, the variables created by factor analysis that are uncorrelated with each other can be used (Draper and Smith, 1998; Özkan, 2009). In the case of PCR, the estimation equation is obtained as:
Where, Dq is the first qeigenvector matrix, and X’X; Ʌq represents the diagonal matrix for the first q eigenvectors of X’X (Al-Hassan and Al-Kassab, 2009). Here the smallest component causing multicollinearity is removed. Eigenvalues are used for this purpose. The component with the eigenvalue closest to zero is removed from the model.
To estimate inner egg quality variables outer egg quality traits LS, RR, and PCR were used; and to do that necessary calculations were performed with NCSS (2007) software Ver. 07.1.12.
Table I.- Descriptive statistics results.
| Variables |
n (min-max) |
Mean ± SD |
| Albumen index, % (Y) |
110 (4.77-6.88) |
5.88±0.45 |
|
Egg width, mm (X1) |
110 (18.82-30.25) |
24.81±1.96 |
|
Egg length, mm (X2) |
110 (26.34-38.45) |
31.82±2.21 |
|
Haugh unit (X3) |
110 (78.03-86.71) |
82.34±1.61 |
|
Shape Index, % (X4) |
110 (69.34-86.17) |
77.99±4.05 |
SD, standart deviation.
Results and discussion
The descriptive statistical results of the parameters of egg internal and external quality are given in Table I. These results are consistent with those reported by Hrnčár et al. (2014). The results of the correlation matrix of the dependent and independent variables are given in Table II. Correlation analysis showed some relationships between the albumen index and independent variables. The albumen index and Haugh index were found to be positively and significantly correlated (r=0.734; P<0.01). It has been found that there was no significant correlation (P>0.05) between the albumen index and other independent variables. In the case of only independent variables, the correlation between egg length and egg width was high (r=0.762; P<0.01). The results obtained are summarized in Poyraz (1989), Akbaş et al. (1996), Alkan et al. (2010), Kul and Şeker (2004), and Rathert et al. (2011). Moreover, a significant positive correlation (P<0.01) was found between egg width and Haugh unit as well as egg width and shape index. These results are consistent with those of Kul and Şeker (2004), while Alkan et al. (2010) found that they were incompatible with their work.
Eigenvalues of correlations and condition index are given in Table III. The eigenvalue of PC4 was very close to zero and the condition index was bigger than 30 indicating that there was a serious multicollinearity problem in the LS model. These results are similar to presented by Üçkardeş et al. (2012).
Table II.- Correlation matrix of dependent and independent variables.
| Variables |
AI (Y) |
EW (X1) |
EL (X2) |
HU (X3) |
SI (X4) |
| AI (Y) |
1 |
|
|
|
|
|
EW (X1) |
-0.086ns |
1 |
|
|
|
|
EL (X2) |
-0.169ns |
0.762** |
1 |
|
|
|
HU (X3) |
0.734** |
0.420** |
0.327** |
1 |
|
|
SI (X4) |
0.09ns |
0.508** |
-0.167ns |
0.209* |
1 |
EI, Albumen index; EW, egg width; EL, egg length; HU, Haugh unit; SI, shape index; ns, P>0.05; *, P<0.05; **, P<0.01.
Table III.- Eigenvalues of correlations and condition index in LS method.
| No |
Eigenvalue |
Condition ındex |
| PC1 |
2.13 |
1 |
| PC2 |
1.15 |
1.36 |
| PC3 |
0.71 |
1.73 |
|
PC4ψ |
0.0015 |
37.99 |
ψmulticollinearity.
The least square method, principal component regression and ridge regression values are given in Table IV. Multicollinearity was found in the parameters egg width (βˆ1), egg length (βˆ2) and shape index (βˆ4) through LS method. However, multicollinearity was not found in PCR and RR method.
|
LS |
PCR |
RR (k=0.02) |
|||||||
|
βˆ ± S (βˆ) |
VIF |
TV |
βˆ ± S (βˆ) |
VIF |
TV |
βˆ ± S (βˆ) |
VIF |
TV |
|
|
βˆ0 |
-1.92±4.713ns |
~ |
~ |
-12.12 |
~ |
~ |
-10.969 |
~ |
~ |
|
βˆ1 |
0.36±0.189ns |
308.77 |
0.0032 |
-0.05±0.00 |
0.361 |
0.021 |
-0.02±0.015 |
1.8 |
0.00 |
|
βˆ2 |
-0.38±0.146* |
236.11 |
0.004 |
-0.05±0.00 |
0.484 |
0.055 |
-0.07±0.013 |
1.5 |
0.00 |
|
βˆ3 |
0.26±0.014** |
1.218 |
0.821 |
0.26±0.014 |
1.215 |
1.215 |
0.253±0.014 |
1.1 |
0.82 |
|
βˆ4 |
-0.13±0.060* |
133.28 |
0.0075 |
-0.00±0.004 |
0.680 |
0.768 |
-0.01±0.006 |
1.2 |
0.0 |
*, P<0.05; **, P<0.01; ns~, not revealed; LS, least square; PCR, principal component regression; RR, ridge regression; VIF, variance inflation factor; TV, tolerance value.
The VIF values for the parameters egg width (βˆ1), egg length (βˆ2) and shape index (βˆ4) were found to be very high in the LS method. Likewise, the results in Table IV indicated that standard errors of LS regression parameters were too high. Whereas, The VIF values of these parameters were found close to one in the PCR and the RR methods. And also, standard errors of regression parameters of PCR and RR methods were too low. These results are consistent with those of Aktan (2004), Rathert et al. (2011) and Üçkardeş et al. (2012). The measures of goodness of fit values (R2) of LS, PCR and RR are given in Table V. These values of estimation equation received from LS, PCR, and RR methods were very near to each other (76.8%, 75.7%, and 73.8%, respectively).
As a result, in this study, parameter estimates, variance inflation factor, and tolerance values were obtained using the LS, PCR ,and RR, methods. All three models including independent variables that affect the albumen index were examined in a comparative way.
| Variables |
R2 |
MSE |
ANOVA F |
P |
| LS |
0.77 |
0.22 |
86.98 |
0.00 |
| PCR |
0.78 |
0.05 |
81.89 |
0.00 |
| RR |
0.74 |
0.05 |
73.94 |
0.00 |
LS, least square; PCR, principal component regression; RR, ridge regression; R2, determination coefficient; MSE, mean square errors.
Conclusion
In the present study, the variance inflation factors obtained using the Least Squares method were very high, whereas those resulting from Ridge Regression and Principal Components Regression were very low. This clearly demonstrated the existence of multicollinearity for the LS method. The application of the RR or PCR estimators from the biased estimation methods gave more consistent and safer results instead of the regression equation generated by the LS method. Particularly, when we compared the RR and PCR methods, which are predominantly biased estimators, we concluded that the RR and PCR methods are better than the LS in terms of the determination coefficient and mean square errors. As a result, PCR and RR lead to more accurate and more reliable estimation equations than LS method.
Statement of conflict of interest
We declare that we have no conflict of interest.
References
Akbaş, Y., Altan, O. and Koçak, C., 1996. Effects of hen’s age on external and internal egg quality characteristics. Turk. J. Vet. Anim. Sci., 20: 455-460.
Akdeniz, F. and Erol, H., 2003. Mean squared error matrix comparisons of some biased estimators in linear regression. Commun. Stat. Theor. Meth., 32: 2389-2413. https://doi.org/10.1081/STA-120025385
Albayrak, A.S., 2005. An alternative bias estimation technique and an application of the least squares technique in multiple linear connections. Zonguldak Kara Elmas Univ. J. Soc. Sci., 1: 105-126.
Al-Hassan, Y.M. and Al-Kassab, M.M., 2009. A monte carlo comparison between ridge and principal components regression methods. Appl. Math. Sci., 3: 2085-2098.
Alkan, S., Karabağ, K., Galiç, A., Karslı, T. and Balcıoğlu, M.S., 2010. Effects of selectionfor body weight and egg production on egg quality traits in Japanes equails (Coturnix coturnix japonica) of different lines and relationships between these traits. Kafkas Univ. Vet. Fak. Derg., 16: 239-244.
Baker, J.F., Stewart, T.S., Long, J.R. and Cartwright, T.C., 1988. Multiple regression and principal component analysis of puberty and growth in cattle. J. Anim. Sci., 66: 2147-2158. https://doi.org/10.2527/jas1988.6692147x
Draper, and Smith, H., 1998. Applied regression analysis, 3rd ed. John Wiley & Sons Inc., New York, USA. https://doi.org/10.1002/9781118625590
Ergüneş, E., 2004. Determination the effects of outliers at the least squares, ridge regressıon and robust regression analysis results. MSc thesis, Çukurova University, Adana, Turkey.
Gujarati, D.N., 1995. Basic econometrics, 3rd ed. McGraw-Hill, New York, USA.
Hrnčár, C., Hanusová, E., Hanus, A. and Bujko, J., 2014. Effect of genotype on egg quality characteristics of Japanese quail (Coturnix japonica). Slovak J. Anim. Sci., 47: 6-11.
Hoerl, A.E. and Kennard, R., 1970. Ridge regression: Biased estimation for non-orthogonal problems. Technometrics, 12: 55-67. https://doi.org/10.1080/00401706.1970.10488635
Kul, S. and Şeker, I., 2004. Phenotypic correlations between some external and internal egg quality traits in the Japanase quail (coturnix coturnix japonica). Int. J. Poult. Sci., 3: 400-405. https://doi.org/10.3923/ijps.2004.400.405
Kurtuluş, M., 2001. A Study on ridge regression. MSc thesis, Gazi University, Ankara, Turkey.
Lee, T.Z. and Campbell, D.B., 1985. Selecting the optimum k in ridge regression. Commun. Stat. Theor. Meth., 14: 1589-1604. https://doi.org/10.1080/03610928508828997
Marks, H.L., 1996. Long-term selection for body weight in Japanese quail under different environments. Poult. Sci., 75: 1198-1203. https://doi.org/10.3382/ps.0751198
NCSS, 2007. Number cruncher statistical system, user guide I. Kaysville, Utah, USA.
Özkan, K., 2009. Modeling of variation of soil capacity of soil by basic components of soil tiller by regression analysis. Süleyman Demirel Univ. J. Forest., 2: 1-9.
Pagel, M.U. and Lunneborg, C.E., 1985. Empirical evaluation of RR. Psychol. Bull., 97: 342-355. https://doi.org/10.1037/0033-2909.97.2.342
Pimentel, E.C.G., Queiroz, S.A., Carvalheiro, R. and Fries, L.A., 2007. Use of ridge regression for the prediction of early growth performance in cross bred calves. Genet. Mol. Biol., 30: 536-544. https://doi.org/10.1590/S1415-47572007000400006
Pinto, L.F.B., Packer. I.U., Melo, J.C.M.R., Ledur, M.C. and Coutinho, L.L., 2006. Principal components analysis applied to performance and carcass traits in the chicken. Anim. Res., 55: 419-425. https://doi.org/10.1051/animres:2006022
Rathert, Ç.T., Üçkardeş, F., Narinç, D. and Aksoy, T., 2011. Comparison of principal component regression with the least square method in prediction of internal egg quality characteristics in Japanese quails. Kafkas Univ. Vet. Fak. Derg., 17: 687-692.
Üçkardeş, F., Efe, E., Narinç, D. and Aksoy, T., 2012. Estimation of egg albumen index in Japanese quail by ridge regression method. Acad. J. Agric., 1: 11-20.
Vinod, H.D. and Ullah, A., 1981. Recent advances in regression methods, 1st ed. Dekker, New York, USA.


