

Maximum Sustainable Yield Estimates of Carangoides Fishery Resource in Pakistan and its Bioeconomic Implications


Maximum Sustainable Yield Estimates of Carangoides Fishery Resource in Pakistan and its Bioeconomic Implications
Muhammad Mohsin1, Dai Guilin1,*, Chen Zhuo1, Yin Hengbin1 and Muhammad Noman2
1Marine Resource Economics, College of Economics, Ocean University of China, Qingdao 266003, China
2College of Fisheries, Ocean University of China, Qingdao 266003, China
ABSTRACT
Due to the decline of marine capture fisheries in Pakistan, it is necessary to evaluate fishery status and their economic implications of major commercially hunted fish species. In this study maximum sustainable yield (MSY) of Carangoides fishery from Sindh, Pakistan is estimated by using catch and effort data. For data analysis, two specialized fishery software CEDA (catch and effort data analysis) and ASPIC (a stock production model incorporating covariates) were employed. Three surplus production models (SPMs) viz., Fox Model (FM), Schaefer Model (SM) and Pella-Tomlinson Model (PTM) were used in CEDA along with three error assumptions (EAs) viz., normal error assumption (NEA), log-normal error assumption (LNEA) and gamma error assumption (GEA). On the other hand, in ASPIC two SPMs viz., Fox Model (FM) and Logistic Model (LM) were employed. MSY estimates for Carangoides fishery by using CEDA and ASPIC were between 1404-1709 t (tonnes) and 1409-1705 t correspondingly. The calculated MSY range by both the software significantly overlaps. However, ASPIC results showed higher values of R2. On the basis of obtained results, it is concluded that this fishery resource is overexploited which confers several economic disadvantages. In order to manage this fishery resource recommended target reference point (TRP) for MSY in Pakistani marine waters along the Sindh coast is between 1500-1700 t. Moreover, the harvest of this fishery resource beyond 1750 t should be considered as limiting reference point (LRP) which will result in economic loss.
Article Information
Received 16 March 2018
Revised 14 April 2018
Accepted 24 April 2018
Available online 14 December 2018
Authors’ Contribution
MM initiated this work, analyzed the data and wrote the article. DG designed the study and supervised. CZ, YH and MN helped in writing of the article.
Key words
Carangoides fishery, MSY, CEDA, ASPIC, Pakistan.
DOI: http://dx.doi.org/10.17582/journal.pjz/2019.51.1.279.287
* Corresponding author: oucdaiguilin@qq.com
0030-9923/2019/0001-0279 $ 9.00/0
Copyright 2019 Zoological Society of Pakistan
Introduction
Surplus production models (SPMs) are the conventional tools frequently used in fisheries resource assessment. Their popularity stems from their ease of use and ability to compute exclusive parameters. Surplus production refers to that fishery biomass, which will grow without fishing. Thus, fishing can be done sustainably by maintaining fish stock at a constant level. SPMs depend on the concept of fisheries stock depletion. The depletion concept refers to the fall in the abundance indicator due to the removal of fisheries stock. SPMs require a comprehensive continuous record of catch and effort data. Not necessarily, instead of catch and effort statistics, catch per unit effort (CPUE) can also be used to estimate various parameters (Hoggarth et al., 2006).
SPMs have many advantages over the other statistical routines. Such as, these models require simple data of catch and effort and compute very important fisheries parameters like BMSY (biomass at maximum sustainable yield i.e. MSY), BCUR (current biomass), FMSY (fishing mortality at MSY) and F (fishing mortality). Computed q (catchability coefficient) parameter by these models directly indicates the state of the fisheries stock. Moreover, in contrast to older SPMs, these models, assume fisheries in non-equilibrium state and hence are more reliable in their estimates (Hoggarth et al., 2006; Medley and Ninnes, 1997).
Like any other statistical model, these models also rely on certain assumptions. For example, these models assume that q does not change with the passage of time, both the natural and fishing mortality simultaneously occur in the fisheries population, r (population increase) is independent of age composition, the efficiency of the vessels and gears remain same and there exists no immigration or emigration in the fish population (Ewald and Wang, 2010; Hoggarth et al., 2006). Although, it is not possible that all the assumptions are met in nature yet the scientific method is used. In fact, these models are very useful tools which tell us about the exploitation status of the fisheries stock (Musick and Bonfil, 2005).
The process of fisheries management involves different stages from data collection to decision making by involving stakeholders (FAO, 1997; Die, 2002). Decisions are made on estimates obtained in the form of figures known as reference points (RPs) such as FMSY, BMSY and MSY. RPs are usually classified into two main types i.e. limit RPs (LRPs) and target RPs (TRPs). LRPs are those RPs, which fisheries managers try to avoid or otherwise the fish stock may suffer. On the other hand, TRPs are that RPs, which are ideal for fisheries management and fisheries managers strive to achieve these (Cochrane, 2002; Caddy and Mahon, 1995). In the fisheries management science, commonly three RPs are used viz., FMSY, BMSY and MSY. By considering the advantages of SPMs and importance of their computed RPs, in this study, we have used them to access the fishery status of Carangoides fishery in Pakistan to describe its economic implications.
Carangoides is a name of the genus categorized under family “Carangidae”. In Pakistani marine waters, twelve fish species are reported belonging to this genus viz., Carangoides armatus, C. bajad, C. chrysophrys, C. coeruleopinnatus, C. ferdau, C. fulvoguttatus, C. gymnostethus, C. hedlandensis, C. malabaricus, C. plagiotaenia, C. praeustus and C. talamparoides. The commercial catch of all of these fish species is reported collectively. These fish species are commercially harvested through gillnets. The local name of each of these fish species is similar. In Sindhi language they are known as “Kakkar and Patal” whereas in Balochi language their local name is “Gishran and Kakwan” (MFD, 2012; FAO, 2015). The need and importance of this study relies on three compelling factors. First, various researchers have tried to access exploitation status of the fisheries stocks in Pakistani marine waters and found that mostly the fisheries stocks are overexploited resulting in decreased marine capture production in the following years (Baset et al., 2017; Mohsin et al., 2016; Memon at al., 2015). Second, Pakistani seafood exports are rising with the passage of time, therefore, more and more efforts are done to capture commercially important fish species (Mohsin et al., 2017). Thus, in this situation, fishery stock assessment of commercially important fish species becomes extremely important. Third, no previously published literature documents fishery status of Carangoides in Pakistan and throws light on its ongoing economic implications. Thus, this study is the first attempt in this regard.
Materials and methods
Data acquisition
Available published time series data of catch and effort statistics, 1999-2013, related to Carangoides fishery from Sindh, Pakistan were obtained from the Sindh govt. statistics and fishery statistics book published by Marine Fisheries Department (MFD, 2012), Pakistan. The commercial catch of Carangoides fishery is mainly from the Sindh coast due to topographical features of this area. Such as, in this region the coast is sandy and muddy. Moreover, the Indus River delta is also present here in which diverse fish fauna dwells. Thus, the Sindh coast is a very important coast as far as Carangoides commercial fishery is concerned in Pakistan. Carangiodes fishery resource is landed on the dock stations along the entire Pakistani coastline (Fig. 1). It is necessary to mention that in this study catch statistics are in the form of tonnes (t), whereas, effort is represented by the number of fishermen.
Data analysis
Three SPMs were employed to statistically analyze the data through fishery specialized computer packages. For this purpose, two software i.e. catch-effort data analysis (CEDA) (MRAG, 2015) and a stock-production-model incorporating covariates (ASPIC) (NOAA, 2015) were used. SPMs are also known as biomass dynamic models. SPMs have three different versions on behalf of three fishery scientists Fox, Schaefer and Pella-Tomlinson. Schaefer model (SM) (Schaefer, 1954) is the most commonly used model which relies on a logistic population growth of the fishery stock.
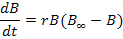
On the other hand, Fox model (FM) (Fox, 1970) and Pella-Tomlinson model (PTM) (Pella and Tomlinson, 1969) depend on the equation of growth proposed by Gompertz and equation of generalized production, respectively.

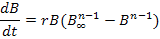
In these mathematical expressions, B, B∞, n, t and r stand for biomass of fish stock, carrying capacity (K), shape parameter, time (year) and population increase correspondingly.
CEDA (version 3.0.1)
This software fits data manually and can compute very important fishery parameters on customized basis. It employs a special data fitting method known as “bootstrapping” which uses 95% confidence interval. In this fishery software, three SPMs i.e. FM, SM and PTM were used. Each of these models was considered along with three error assumptions (EAs) viz., normal error assumption (NEA), log-normal error assumption (LNEA) and gamma error assumption (GEA). In order to compute data through this software IP (initial proportion = B1/K i.e. starting biomass over carrying capacity) is used. Key fishery parameters estimated by this software are CV, MSY, q, K, r and B which stand for coefficient of variation, maximum sustainable yield, catchability coefficient, carrying capacity, increase in population and biomass in that order.
ASPIC (Version 5.0)
This computer package uses IP input to approximate fishery parameters. However, it needs individual files for every IP input. Two SPMs i.e. Fox Model (FM) and Logistic Model (LM) were employed by using ASPIC. BOT and FIT files, for both of the SPMs, were prepared to compute various fishery parameters. BOT and FIT are the two different program modes and are technically different from each other. The managerial parameters are estimated by ASPIC software during FIT mode. On the other hand, many trails are done by using confidence interval to estimate parameters during BOT program mode. Different parameters estimated by using this software are MSY, q, K, BMSY (stock biomass giving MSY), FMSY (fishing mortality rate at MSY) and R2 (coefficient of determination).
In order to consider fitting of data, we used a following criteria. Selection of the best model depended upon several factors. First, the value of R2 was considered because it directly tells about the model’s fitting to the data. Second, output graphs of estimated catch and observed catch were also considered to select the best model (Hoggarth et al., 2006). Third, results only with suitable CV (coefficient of variation) values were accepted.
Results
Total landed mass of Carangoides fishery resource during the study period remained 26610 t. The maximum catch was observed in 1999 (3071 t) whereas the minimum catch quantity was recorded in 2013 (1123 t). The average capture production of this fishery resource remained 1774 t y-1. There is a deceasing trend in the capture production of this aquatic resource. CPUE has deceased with the passage of time during the study period starting in 1999 (0.036) it has fallen down considerably to 2013 (0.010) (Table I).
Table I.- Time series catch and effort statistics (1999-2013) of Carangoides fishery resource in Pakistani marine waters.
|
Year |
Catch |
Effort |
CPUE |
Year |
Catch |
Effort |
CPUE |
|
|
1999 |
3071 |
85104 |
0.0361 |
2007 |
1470 |
102875 |
0.0143 |
|
|
2000 |
2368 |
90205 |
0.0263 |
2008 |
1598 |
103946 |
0.0154 |
|
|
2001 |
2228 |
90683 |
0.0246 |
2009 |
1533 |
106552 |
0.0144 |
|
|
2002 |
1987 |
93967 |
0.0211 |
2010 |
1518 |
107639 |
0.0141 |
|
|
2003 |
1652 |
97476 |
0.0169 |
2011 |
1564 |
108422 |
0.0144 |
|
|
2004 |
1763 |
98237 |
0.0179 |
2012 |
1623 |
109143 |
0.0149 |
|
|
2005 |
1524 |
99828 |
0.0153 |
2013 |
1123 |
109822 |
0.0102 |
|
|
2006 |
1588 |
101596 |
0.0156 |
Catch, t (tonnes); Effort, number of fishermen.
CEDA estimates
CEDA computer package showed sensitivity towards input IP values, 0.1 to 1 (Table II). This means for various IP values it computed different MSY estimates. For the lower IP values, this package computed the higher MSY estimates and vice versa. Such as for IP 0.1 (FM), for NEA, CEDA estimated MSY as 1.56E+10 t whereas for IP 1, for same EA, this software calculated MSY as 1404 t. Similar is the case with other models i.e. SM and PTM. LNEA did not produce MF whereas NEA and GEA sometimes produced MF. Graphs obtained for expected and observed catches by using CEDA computer package are presented in Figure 2. These graphs look alike; however, they differ from each other in minute details.
Anticipated results by using IP 1 are presented in Table III. In FM, for NEA and LNEA, the estimated values of MSY and CV remained 1404 t (0.027) and 1405 t (0.045), correspondingly. The values of R2 for these EAs were 0.923 and 0.867 in that order. The output values of other parameters viz., K and B, for same EAs, were 11726 t, 3757 t and 11575 t, 3629 t, respectively. BMSY estimates, for same EAs, remained as 4314 t and 4258 t in that order. For this model GEA produced MF.
SM and PTM produced similar results for various parameters such as MSY, K, R2, B and BMSY. Similar results appear when model assumptions do not depend upon some un-testable biological assumptions (Hoggarth et al., 2006). Computed estimates of MSY for NEA, LNEA and GEA remained 1560 t, 1709 t and 1573 t, respectively.
Table II.- Estimated MSY values for Carangoides fishery resource in Pakistani marine waters by using CEDA computer package (IP = 0.1-0.9).
|
IP |
Model |
||||||||
|
FM |
SM |
PTM |
|||||||
|
NEA |
LNEA |
GEA |
NEA |
LNEA |
GEA |
NEA |
LNEA |
GEA |
|
|
0.1 |
1.56E+10 |
1893 |
9.47E+08 |
MF |
6450 |
MF |
MF |
6450 |
MF |
|
0.323 |
0.045 |
0.303 |
MF |
0.001 |
MF |
MF |
0.001 |
MF |
|
|
0.2 |
13183 |
1893 |
13701 |
MF |
3487 |
MF |
MF |
3487 |
MF |
|
2592.502 |
0.031 |
0.043 |
MF |
0.002 |
MF |
MF |
0.002 |
MF |
|
|
0.3 |
MF |
2180 |
MF |
18975 |
2464 |
18497 |
18975 |
2464 |
18497 |
|
MF |
0.001 |
MF |
0.044 |
0.002 |
0.025 |
0.044 |
0.002 |
0.025 |
|
|
0.4 |
1969 |
1930 |
1977 |
MF |
2362 |
2069 |
MF |
2362 |
2069 |
|
0.016 |
0.001 |
0.001 |
MF |
0.001 |
0.046 |
MF |
0.001 |
0.046 |
|
|
0.5 |
1761 |
1774 |
1764 |
7337 |
1747 |
MF |
7337 |
1747 |
MF |
|
0.029 |
0.002 |
0.035 |
0.097 |
0.011 |
MF |
0.097 |
0.011 |
MF |
|
|
0.6 |
1626 |
1679 |
1626 |
MF |
1929 |
MF |
MF |
1929 |
MF |
|
0.034 |
0.013 |
0.040 |
MF |
0.001 |
MF |
MF |
0.001 |
MF |
|
|
0.7 |
1534 |
1503 |
1533 |
MF |
1831 |
MF |
MF |
1831 |
MF |
|
0.028 |
0.037 |
0.037 |
MF |
0.001 |
MF |
MF |
0.001 |
MF |
|
|
0.8 |
1472 |
1454 |
MF |
1834 |
1776 |
1861 |
1834 |
1776 |
1861 |
|
0.031 |
0.041 |
MF |
0.025 |
0.001 |
0.021 |
0.025 |
0.001 |
0.021 |
|
|
0.9 |
1430 |
1407 |
1425 |
1677 |
1713 |
MF |
1677 |
1713 |
MF |
|
|
0.027 |
0.047 |
0.031 |
0.056 |
0.008 |
MF |
18975 |
2464 |
18497 |
|
1 |
1404 |
1405 |
MF |
1560 |
1709 |
1573 |
1560 |
1709 |
1573 |
|
0.027 |
0.045 |
MF |
0.052 |
0.014 |
0.077 |
0.055 |
0.016 |
0.069 |
|
CV, coefficient of variation (written below MSY values); MF, minimization failure.
Table III.- Various parameters computed by using CEDA computer package for Carangoides fishery resource in Pakistani marine waters (IP = 1).
|
Model |
K |
q |
r |
MSY |
Ryield |
CV |
R2 |
B |
BMSY |
|
FM (NEA) |
11726 |
3.50E-06 |
0.325 |
1404 |
1392 |
0.027 |
0.923 |
3757 |
4314 |
|
FM ( LNEA) |
11575 |
3.58E-06 |
0.329 |
1405 |
1388 |
0.045 |
0.867 |
3629 |
4258 |
|
FM (GEA) |
MF |
||||||||
|
SM (NEA) |
8996 |
4.83E-06 |
0.693 |
1560 |
1246 |
0.052 |
0.918 |
2480 |
4498 |
|
SM ( LNEA) |
7305 |
6.73E-06 |
0.935 |
1709 |
1240 |
0.014 |
0.866 |
1740 |
3653 |
|
SM (GEA) |
8808 |
4.99E-06 |
0.714 |
1573 |
1245 |
0.077 |
0.896 |
2392 |
4404 |
|
PTM (NEA) |
8996 |
4.83E-06 |
0.693 |
1560 |
1246 |
0.055 |
0.918 |
2480 |
4498 |
|
PTM (LNEA) |
7305 |
6.73-E06 |
0.935 |
1709 |
1240 |
0.016 |
0.866 |
1740 |
3653 |
|
PTM (GEA) |
8808 |
4.99E-09 |
0.714 |
1573 |
1245 |
0.069 |
0.896 |
2392 |
4404 |
MF, minimization failure; K, carrying capacity; q, catchability coefficient; r, intrinsic population growth rate; MSY, maximum sustainable yield; CV, coefficient of variation; R2, coefficient of determination; B, current biomass; BMSY, biomass giving MSY.
Table IV.- Various parameters estimated by using ASPIC software for Carangoides fishery resource in Pakistani marine waters (IP = 1).
|
Model |
IP |
MSY |
K |
q |
FMSY |
BMSY |
R2 |
CV |
|
FM |
1 |
1409 |
10690 |
3.797E-06 |
0.358 |
3933 |
0.960 |
0.028 |
|
LM |
1 |
1705 |
5830 |
8.052E-06 |
0.584 |
2915 |
0.957 |
0.173 |
Table V.- ASPIC results for Carangoides fishery resource by using ASPIC software in Pakistani marine waters (IP = 0.5-1).
|
Model |
IP |
MSY |
K |
q |
FMSY |
BMSY |
R2 |
CV |
|
FM |
0.5 |
1767 |
10070 |
8.24E-06 |
0.476 |
3704 |
0.958 |
0.034 |
|
0.6 |
1638 |
9879 |
7.00E-06 |
0.450 |
3634 |
0.959 |
0.041 |
|
|
0.7 |
1544 |
9979 |
5.90E-06 |
0.420 |
3671 |
0.959 |
0.037 |
|
|
0.8 |
1479 |
10170 |
5.03E-06 |
0.395 |
3741 |
0.959 |
0.025 |
|
|
0.9 |
1436 |
10400 |
4.35E-06 |
0.375 |
3826 |
0.959 |
0.029 |
|
|
1 |
1409 |
10690 |
3.79E-06 |
0.358 |
3933 |
0.960 |
0.028 |
|
|
LM |
0.5 |
2252 |
6959 |
1.05E-05 |
0.647 |
3479 |
0.918 |
0.110 |
|
0.6 |
2099 |
5918 |
1.11E-05 |
0.709 |
2959 |
0.941 |
0.107 |
|
|
0.7 |
1895 |
5267 |
1.05E-05 |
0.719 |
2633 |
0.959 |
0.045 |
|
|
0.8 |
1895 |
5267 |
1.05E-05 |
0.719 |
2633 |
0.959 |
0.018 |
|
|
0.9 |
1797 |
5462 |
9.38E-06 |
0.657 |
2731 |
0.958 |
0.029 |
|
|
1 |
1705 |
5830 |
8.05E-06 |
0.584 |
2915 |
0.957 |
0.047 |
The output values of K and R2, for these EAs, remained 8996 t, 7305 t, 8808 t and 0.918, 0.866 and 0.896, correspondingly. Parameters B and BMSY were computed, for these EAs, as 2480 t, 1740 t, 2392 t and 4498 t, 3653 t, 4404 t, respectively. Computed CV values were different for SM and PTM. In SM estimated values of CV, for NEA, LNEA and GEA, remained 0.052, 0.014 and 0.077 in that order. Conversely, in PTM, CV values were 0.055, 0.016 and 0.069, correspondingly.
ASPIC estimates
ASPIC estimates, for IP 1, were obtained by using two models viz., FM and LM. The results obtained are listed in Table IV. MSY estimate of FM is 1409 t whereas LM calculation for MSY is higher than FM i.e. 1705 t. FM computed K, FMSY and BMSY as 10690 t, 0.358 and 3933 t in that order. On the other hand, LM computed same parameters as 5830 t, 0.584 and 2915 t correspondingly. Although, the difference is very little but FM showed higher R2 value (0.960) as compared to R2 value (0.957) of LM. Computed CV, for both the models, remained 0.028 and 0.173, respectively.
Sensitivity analysis was also performed through ASPIC computer package by using IP values from 0.5 to 1. IP values from 0.1 to 0.4 did not produce results. Results of IP values, 0.5 to 1, are presented in Table V. Like CEDA, this software computed MSY with higher values against lower IP values and vice versa. For example,
Table VI.- ASPIC estimates of fishing mortality (F) and biomass (B) (IP = 1) (1999-2013).
|
Year |
Model |
|||||||
|
FM |
LM |
|||||||
|
F |
B |
F/FMSY |
B/BMSY |
F |
B |
F/FMSY |
B/BMSY |
|
|
1999 |
0.332 |
10690 |
0.927 |
2.718 |
0.667 |
5830 |
1.140 |
2.000 |
|
2000 |
0.324 |
8074 |
0.902 |
2.053 |
0.694 |
3825 |
1.187 |
1.312 |
|
2001 |
0.363 |
6689 |
1.013 |
1.701 |
0.794 |
3104 |
1.357 |
1.065 |
|
2002 |
0.373 |
5676 |
1.042 |
1.443 |
0.833 |
2574 |
1.424 |
0.883 |
|
2003 |
0.339 |
5017 |
9.470 |
1.276 |
0.748 |
2234 |
1.279 |
0.766 |
|
2004 |
0.388 |
4737 |
1.084 |
1.205 |
0.848 |
2187 |
1.450 |
0.750 |
|
2005 |
0.354 |
4367 |
9.883 |
1.110 |
0.765 |
1988 |
1.307 |
0.681 |
|
2006 |
0.383 |
4246 |
1.068 |
1.080 |
0.809 |
1998 |
1.383 |
0.685 |
|
2007 |
0.364 |
4065 |
1.017 |
1.034 |
0.750 |
1933 |
1.282 |
0.663 |
|
2008 |
0.409 |
4005 |
1.142 |
1.018 |
0.824 |
1985 |
1.408 |
0.681 |
|
2009 |
0.409 |
3816 |
1.141 |
0.970 |
0.816 |
1901 |
1.396 |
0.652 |
|
2010 |
0.418 |
3691 |
1.166 |
0.938 |
0.829 |
1857 |
1.417 |
0.637 |
|
2011 |
0.448 |
3578 |
1.250 |
0.910 |
0.902 |
1808 |
1.542 |
0.620 |
|
2012 |
0.493 |
3415 |
1.376 |
0.868 |
1.088 |
1669 |
1.860 |
0.572 |
|
2013 |
0.338 |
3182 |
0.943 |
0.809 |
0.798 |
1342 |
1.364 |
0.460 |
in FM for IP 0.5 estimated MSY value was 1767 t whereas for IP 1 its value was 1409 t. K parameter followed the same pattern like MSY. With the increase of IP value, the FMSY and BMSY showed decreasing trend.
Details of computed B and F are presented in Table VI. For FM, obtained results indicate that biomass of this fishery resource is decreased from 10690 t (1999) to 3182 t (2013) and for LM from 5830 t (1999) to 1342 t (2013). When we compare B to BMSY, it is found that current B is much lower than the B at MSY which clearly indicates overharvesting of this fishery resource. Same is the case of F computed by both the models which also represent overexploitation.
Discussion
In this study, the computed CPUE has gradually decreased with the passage of time indicating overexploitation of Carangoides fishery resource (Table I). CPUE or index of abundance indicates the state of the fisheries. If CPUE does not change and catch along with effort increase it means fishing is not affecting the fish population. However, when the catch either decreases or increases against constant effort it may be due to quantitative variation in the fish stock. On the other hand, if catch is decreasing against constant effort this may indicate rapidly declining fisheries stock i.e. overexploitation (Hoggarth et al., 2006).
Other computed fishery parameters, MSY, FMSY and BMSY, also indicated overexploitation of Carangoides fishery resource in Pakistan which has several disadvantages. Such as, overexploitation leads to economic losses and may result in the extinction of the fisheries population, particularly with low reproductive capacity and high economic value. Private owners strive to maximize their profit, therefore, exploitation status of the renewable biological resource is essential in order to continue economic benefits it possesses (Clark, 1973). Fishery rebuilding is the best option for overexploited stocks. Scientific studies reveal that for more overexploited fishery stock more marginal economic gains are obtained from its rebuilding. At the initial stage of the fisheries, with low effort higher catch is obtained. However, with the advancement of the fisheries, the effort i.e. costs rise and catch declines. If fishing remains continue, finally a stage comes when fishing profit become negative. It has been found that profit of fishing becomes negative long before the resource is fully depleted (Grafton et al., 2007).
Apparently, fisheries stock depletion is a result of an attempt to increase economic gain (Clark, 1973). This fishery stock reduction should be cured by fishery rebuilding. But, fishers usually do not comply with the idea of fisheries stock rebuilding. Because species with fast-growth rate can rebuild their stock quickly but species with low-growth rate may take decades to rebuild them. During the process of rebuilding, transition costs indicate why fishers oppose it. In addition to fishers, stakeholders also have disagreement with the idea of fisheries stock rebuilding (Hilborn, 2007). However, fishers and stakeholders may be attracted by suitable incentives such as the determination of harvesting rights at the community or individual level (Grafton et al., 2006). By doing this, fishers will feel secure and will be satisfied from fisheries stock rebuilding. Moreover, in order to compensate transition costs for fisheries stock rebuilding, intertemporal transfers may be encouraged through quota rental charge (Grafton, 1995).
Among all the RPs, MSY is the most commonly used RP to access fisheries stock. When estimated MSY is above the observed catch in this case fisheries is assumed to be flourishing. On the other hand, if computed MSY is lower than the observed catch it indicates fisheries stock is overexploited. Moreover, if both the estimated MSY and observed catch are same the fisheries stock is assumed to be in a stable state i.e. neither increasing nor decreasing (Hoggarth et al., 2006). Computed MSY for Carangoides fishery indicates that this fishery resource has consistently been overexploited in the past.
In Pakistan, historically, fisheries related issues in Pakistan were addressed under the policies designed for agriculture or livestock. The reports of the Agriculture Enquiry Committee and of the National Agriculture Commission paid some attention to the fisheries sector in the past. However, these reports did not make a major influence because fisheries sector’s problems were poorly addressed. In the past, policies have been made for deep sea fishing in 1988, 1995 and 2001 but these were exclusively intended for promoting fishing under licensing arrangements in EEZ. In 2004, the Ministry of Food, Agriculture, and Livestock approached FAO to fund a technical cooperation project (TCP/PAK/3005) and assist in formulating a policy and making a strategy to boost up fisheries and aquaculture development in the country. This project was approved and funded in May 2005. Finally, first national fisheries policy, “The National Policy and Strategy for Fisheries and Aquaculture Development in Pakistan”, was formulated in 2007 (GoP, 2007).
Strategy axis 2.A of this policy states that most of the fisheries resources in Pakistan are overexploited. However, due to the lack of information on the current status of various fisheries resources in shallow and offshore waters, it was not possible to implement management measures effectively. Therefore, it was suggested to control overexploitation of marine fisheries resources, policy objective 2A.2, and promote sustainable management of marine aquatic resources, policy objective 2A.3 (GoP, 2007). However, practical implementations of these objectives stated in this policy needs attention of the government. A published report in 2014 declares Pakistan a victim of overcapacity and overexploitation as well. It is reported that in the Sindh, the number of operational trawlers is more than the double of recommended ones (Schmidt, 2014). Thus, there is uncontrolled effort, which has resulted in the overcapitalization of the fishing fleets resulting in open access phenomenon.
Thus, concrete steps are needed to revive fisheries in Pakistan. The deceased capture production of Carangoides fishery is due to overexploitation as it has been witnessed in this study which needs serious attention. Moreover, the situation becomes worse when coastal waters get polluted by the industrial effluents (Nazir et al., 2016). Consequently, the reproduction of Carangoides fishery resource is affected severely resulting in the decreased biomass production in coming years. Thus, it is the need of the hour to make such fishery policies, by involving fishery managers, which conserve this fishery resource for its long-term economic contribution.
Conclusion
MSY estimates for Carangoides fishery resource in Pakistan by using CEDA and ASPIC were between 1404-1709 t and 1409-1705 t, correspondingly. Computed MSY range by both the software significantly overlaps. Furthermore, ASPIC results showed higher values of R2. Thus, considering obtained results, it is concluded that TRP for MSY for Carangoides fishery in Pakistani marine waters along the Sindh coast is between 1500-1700 t. However, harvesting of this fishery resource beyond 1750 t should be considered as LRP which will result in economic loss. Thus, concrete steps are needed to revive fisheries in Pakistan by involving fishery managers, which conserve this fishery resource for its long-term economic contribution.
Acknowledgement
This study was funded through “Project of Marine Cooperation and Trade in Fisheries Sector between China and Pakistan” approved by Ocean University of China, Government of Qingdao, China and Government of Punjab, Pakistan.
Statement of conflict of interest
Authors have no conflict of interest.
References
Baset, A., Liu, Q., Hanif, M.T., Liao, B., Memon, A.M. and Mohsin, M., 2017. Estimation of maximum sustainable yield using production modeling: A stock appraisal of Indian Oil Sardine (Sardinella longiceps) from Pakistani Waters. Pakistan J. Zool., 49: 521-528.
Caddy, J.F. and Mahon, R., 1995. Reference points for fisheries management. FAO Fisheries Technical Paper No. 347, FAO’s Fisheries Department, Rome, Italy, pp. 1-83.
Clark, C.W., 1973. The economics of overexploitation. Science., 181: 630-634. https://doi.org/10.1126/science.181.4100.630
Cochrane, K.L., 2002. The use of scientific information in the design of management strategies, Chapter 5. In: A fishery manager’s guidebook: Management measures and their application (ed. K.L. Cochrane). FAO Fisheries Technical Paper No. 424, FAO’s Fisheries Department, Rome, Italy, pp. 1-231.
Die, D., 2002. Design and implementation of management plans, Chapter 9. In: A fishery manager’s guidebook: Management measures and their application (ed. K.L. Cochrane). FAO Fisheries Technical Paper No. 424, FAO’s Fisheries Department, Rome, Italy, pp. 1-231.
Ewald, C.O. and Wang, W.K., 2010. Sustainable yields in fisheries: uncertainty, risk-aversion, and mean-variance analysis. Nat. Resour. Model., 23: 303-323. https://doi.org/10.1111/j.1939-7445.2010.00065.x
FAO, 1997. Fisheries management. FAO Technical Guidelines for Responsible Fisheries No. 4, FAO’s Fisheries Department, Rome, Italy, pp. 1-82.
FAO, 2015. Field identification guide to the living marine resources of Pakistan. FAO’s Fisheries Department, Rome, Italy, pp. 1-386.
Fox, Jr. W.W., 1970. An exponential surplus-yield model for optimizing exploited fish populations. Trans. Am. Fish. Soc., 99: 80-88. https://doi.org/10.1577/1548-8659(1970)99<80:AESMFO>2.0.CO;2
GoP, 2007. National policy and strategy for fisheries and aquaculture development in Pakistan. Ministry of Food, Agriculture and Livestock, Government of Pakistan, Islamabad, pp. 1-13. Available at: http://faolex.fao.org/docs/pdf/pak150786.pdf (accessed 24 May 2016).
Grafton, R.Q., 1995. Rent capture in a rights-based fishery. J. Environ. Econ. Manage., 28: 48-67. https://doi.org/10.1006/jeem.1995.1004
Grafton, R.Q., Arnason, R., Bjørndal, T., Campbell, D., Campbell, H.F., Clark, C.W., Connor, R., Dupont, D.P., Hannesson, R., Hilborn, R., Kirkley, J.E., Kompas, T., Lane, D.E., Munro, G.R., Pascoe, S., Squires, D., Steinshamn, S.J., Turris, B.R. and Weninger, Q., 2006. Incentive-based approaches to sustainable fisheries. Canadian J. Fish. aquat. Sci., 63: 699-710. https://doi.org/10.1139/f05-247
Grafton, R.Q., Kompas, T. and Hilborn, R.W., 2007. Economics of overexploitation revisited. Science, 318: 1601. https://doi.org/10.1126/science.1146017
Hilborn, R., 2007. Defining success in fisheries and conflicts in objectives. Mar. Policy, 31: 153-158. https://doi.org/10.1016/j.marpol.2006.05.014
Hoggarth, D.D., Abeyasekera, S., Arthur, R.I., Beddington, J.R., Burn, R.W., Halls, A.S., Kirkwood, G.P., McAllister, M., Medley, P., Mees, C.C., Parkes, G.B., Pilling, G.M., Wakeford, R.C. and Welcomme R.L., 2006. Stock assessment for fishery management. A framework guide to the stock assessment tools of the fisheries management science programme. FAO Fisheries Technical Paper No. 487, FAO’s Fisheries Department, Rome, Italy, pp. 1-261.
Medley, P.A. and Ninnes, C.H., 1997. A recruitment index and population model for spiny lobster (Panulirus argus) using catch and effort data. Canadian J. Fish. aquat. Sci., 54: 1414-1421. https://doi.org/10.1139/f97-027
Memon, A.M., Memon, K.H., Baloch, W.A., Memon, A. and Baset, A., 2015. Evaluation of the fishery status for King Soldier Bream Argyrops spinifer in Pakistan using the software CEDA and ASPIC. Chin. J. Oceanol. Limnol., 33: 966-973. https://doi.org/10.1007/s00343-015-4330-4
MFD, 2012. Handbook of fisheries statistics of Pakistan. Marine Fisheries Department, Government of Pakistan, Fish Harbour, West Wharf, Karachi.
Mohsin, M., Mu, Y., Memon, A.M., Kalhoro, M.T. and Shah, S.B.H., 2016. Fishery stock assessment of Kiddi shrimp (Parapenaeopsis stylifera) in the Northern Arabian Sea Coast of Pakistan by using surplus production models. Chin. J. Oceanol. Limnol., 35: 936-946. https://doi.org/10.1007/s00343-017-6096-3
Mohsin, M., Mu, Y., Memon, A.M., Mehak, A., Shah, S.B.H., Kalhoro, M.T. and Baset, A., 2017. Capture fisheries production and its economic role in Pakistan. Indian J. Geo-Mar. Sci., 46: 1110-1115.
MRAG, 2015. Fisheries assessment software. MRAG Ltd., London, UK. Available at: https://www.mrag.co.uk/resources/fisheries-assessment-software (accessed 11 October 2015).
Musick, J.A. and Bonfil, R., 2005. Management techniques for elasmobranch fisheries. FAO Fisheries Technical Paper No. 474, FAO’s Fisheries Department, Rome, Italy, pp. 1-251.
Nazir, K., Yongtong, M., Hussain, K., Kalhoro, M.A., Mohsin, M., Hyder, S., Katrika, S., Zhaoqun, S. and Na, A., 2016. Bio indicators (Mussels) are at danger along Karachi Coast affecting economy in Pakistan. Indian J. Geo-Mar. Sci., 45: 230-232.
NOAA, 2015. NOAA fisheries toolbox. NOAA’s National Marine Service, USA. Available at: http://nft.nefsc.noaa.gov/Download.html (accessed 11 October 2015).
Pella, J.J. and Tomlinson, P.K., 1969. A generalized stock production model. Inter-Am. Trop. Tuna Comm. Bull., 13: 416-497.
Schaefer, M.B., 1954. Some aspects of the dynamics of populations important to the management of the commercial marine fisheries. Inter-Am. Trop. Tuna Comm. Bull., 1: 23-56.
Schmidt, U.W., 2014. Fisheries policy report and recommendations for Sindh. USFIRMS Project, USAID. Available at: http://pdf.usaid.gov/pdf_docs/PA00K7T7.pdf (accessed 01 October 2016).
To share on other social networks, click on any share button. What are these?


