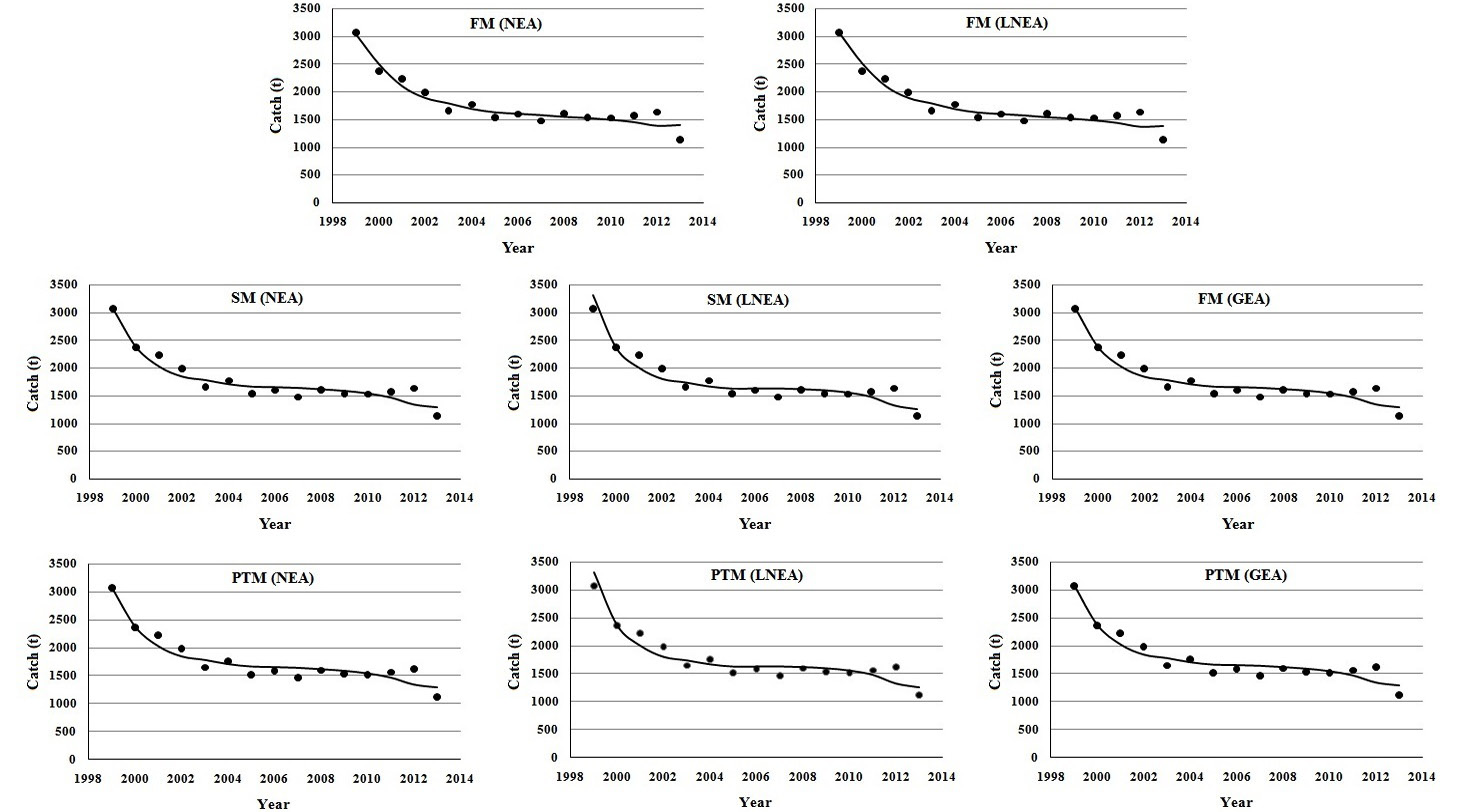
CEDA graphs obtained for IP 1. Dots represent observed catch (t) whereas straight line indicates expected catch.
