


Research Article
Impact of Socioeconomic Factors and farm Size on Wheat Productivity: A Case Study of District Peshawar, Pakistan
Sajad Ali1*, Naeem Ur Rehman Khatak1, Iftikhar Ahmad2, Jangraiz Khan3 and Azra4
1Department of Economics, Sarhad University of Information and Technology Peshawar, Khyber Pakhtunkhwa, Pakistan; 2Pakistan Institute of Development Economics (PIDE), Islamabad, Pakistan; 3City University of Science and Technology, Peshawar, Khyber Pakhtunkhwa, Pakistan; 4Department of Economics, Kohat University of Science and Technology, Kohat, Khyber Pakhtunkhwa, Pakistan.
Abstract | This study investigates the impact of socioeconomic characteristics as well as the farm size of wheat productivity in district Peshawar. Wheat is the main staple food item of the country’s population and the largest grain crop as well. Pakistan has been regularly importing wheat, except for the few years. This study is based on primary data collected in 2019 from district Peshawar.A sample of 200 (160 large and 40 small) wheat growers weretaken from twelve selected villages of Peshawar. An unpaired t-test was used to test the differences in the socioeconomic factors and farm sizes on the wheat production. Chow test were used for structural differences and dummy variable were introduced in the production function to test any significant productivity differentials (if any) between two farm groups. A significant difference was found awing to the socioeconomic factors of two farm groups. Moreover, the Chow F-Ratio confirmed the differences between small and large farms in terms of yield. The statistical value of dummy variable posted higher productivity for the large farms (almost 14%). Hence, results call for higher attention to be diverted to small farms as majority of land owners in Peshawar. The farmer’s have small holdings and lack of adequate access to inputs, agriculture credit and extension services left them technically inefficient. In addition, it is suggested that government and private sector should initiate programs to educate and train the farmers in order to bring advance techniques or improve theirconventional agriculture practices to increase wheat productivity.
Received | August 30, 2020; Accepted | October 15, 2020; Published | November 20, 2020
*Correspondence | Sajad Ali, Department of Economics, Sarhad University of Information and Technology Peshawar, Khyber Pakhtunkhwa, Pakistan; Email: sajadali1879@gmail.com
Citation | Ali, S., N.U.R. Khatak, I. Ahmad, J. Khan and Azra. 2020. Impact of socioeconomic factors and farm size on wheat productivity: A case study of District Peshawar, Pakistan. Sarhad Journal of Agriculture, 36(4): 1174-1179.
DOI | http://dx.doi.org/10.17582/journal.sja/2020/36.4.1174.1179
Keywords | Chow test, Farm size, Production function and socioeconomic factors, Unpaired t-test, Wheat productivity
Introduction
Pakistan’s agriculture sector plays a central role in the economy as it contributes 18.9 percent to GDP and absorbs 42.3 percent of labour force. It is also an important source of foreignexchange earnings and stimulates growth in other sectors (GoP, 2018).
This sector also fulfils the supply of basic food and fiber needs of the country’s growing population and the economy. Wheat is main staple food item of the country’s population and largest grain crop (Ahmad et al., 2002).
The production of food grain in the predominant agriculture economy of Pakistan is considerable. Food grains are important because it account for the major component of food. Increase in production of food crops become more important under the situation where a large proportion of the population lives in absolute poverty as well as the population growth is continuously high, increasing the demand for food product.
Wheat (Triticum aestivum L.), is a leading food grain of Pakistan, covered the largest area. It belongs to family of Poacae (a major cereal crop), which plays an important role in food and nutritional security. Wheat covers two third (2/3) of the acreage under cereals crops in the world (FAO, 2009) and hence it ranks first in acreage, production and consumption among all food crops. It contributes 8.7% to the value added in agricultural and 1.7% to GDP. In Pakistan, total area under wheat is 8825 thousand hectares, with production of 24,946 thousand tonnes and the productivity of 2,887 kg/ha (GOP, 2018). In Khyber Pakhtunkhwa, area under wheat is 748,650 hectares with production of 1365141tonnes and the productivity of 1823kg/ha (GoKP, 2017).
Current, the per hectareyield of wheat in Pakistan is very low as compared to some other countries of the world, which also include some less developed countries. These countries are getting substantially higher yields due to several factors as identified in the literature including seed quality, fertilizer, use of herbicides, water availability and technology which all contribute to higher production. According to Mburu et al. (2014), farmers schooling years, experience and fertilizer has a strong influence on wheat productivity in large farms as compared to small farms. Similarly, the impact of socioeconomic factors on crop productivity were studied by different researchers (Ali et al., 2020; Hashmi et al., 2015; Bagal et al., 2018; Hassan et al., 2010; Begum et al., 2016). Similarly, different research studies were conducted on comparative analysis of farmer’s socioeconomic characteristics in different farm sizes (Aurangzeb et al., 2007; Sial et al., 2012; Shah et al., 2016; Mehmmod et al., 2014) while few also highlighted the effect of farm size on farm productivity (Bhuiyan, 1987; Khan, 1979; Saqib et al., 2016).The present study is designed with the objective to investigate the difference in farmer’s socioeconomic characteristics as well as the difference in their perceived effect on wheat production between small and large farm in district Peshawar, Khyber Pakhtunkhwa.
Hypotheses of the study
The objective of the study is to test the following hypothesis.
H1= There is no significant differences between the socioeconomic factors of two farm groups.
H2 = There is no structural differences between the two farm groups.
H3= There is no difference in farm productivity between two farm groups.
Materials and Methods
The present study was conducted in district Peshawar, one of the highly irrigated and fertilewheat-producing district of Khyber Pakhtunkhwa (GoKP, 2008). The district Peshawar iscomprised of four towns (tehsils) namely Town-I, Town-II, Town-III, Town-IV. Two towns (Town II and Town IV) were purposively selected on the basis of rural population. A list of wheat growers was obtained from the officeof the concerned extension circle of agriculture department KhyberPakhtunkhwa. ThreeUnion Councils from each town were selected randomly. Lala, Nahqi and Gulbela from town II and Merakachori, Aza khel and UrmarMiana from town IV were selected. Out of six Union Councils, two villages were selected conveniently due to time constraints. A sample of 200 wheat growers from twelve (12) selected villages of the chosen towns was drawn by employing Yamani formula (1967). Data were collected through in-person interview method in the month of September-October 2019.Sampled wheat growers were divided into two categories on the basis of land holding i.e. small farmers-having less or equal to 5.0 acre and large farmers-possessing above 5.0 acre landholding; following Saqib et al. (2016). Proportional allocation method of stratified random sampling was used for the distribution of wheat growers among the sample villages as follows.
Where;
ni: No. of sampled wheat growers in ith Village; i:1, 2, 3, ……12; n: Total No. of sampled wheat growers; N: Total No. of wheat growers in the study area; Ni: Total Number of Farmer in the Village.
Specification of the model (Production function)
To find out the impact of socio economic factors on the production of wheat in district Peshawar, the functional form was used in the present study as given below (Bhuiyan, 1987).
Q=f (D, Edu, Age, FS, Lw, Fert, K, IP, WP, Exp)
The specified econometric model for this study is as follows:
LnQ= β0+ β0+ β1D+ β2Edu+ β3Age+ β4FS+ β5lnLw+ β6lnFertw+ β7lnK+ β8IP+ β9WP+ β10Exp+U
Where;
Q= Total production of wheat (tones) produced per acre; D= Dummy for farm size (0 for small farm and 1 for large farm); Edu=Education levelof the sampled farmers (Schooling years); Age= Farmers age in years; FS= No. of family members/family size; Lw= Labour in term of man-days spent on wheat farm per acre; Fertw= Amount spent on fertilizer use for wheat crop per acre (In Pakistani rupee); K= Capitalamount spent on wheat crop per acre (In Pakistani rupee); IPw= Value if Insecticides and pesticides used per acre (In Pakistani rupee); WP= Price of wheat per maund; βi= Parameters showing the output elasticities of inputs; U= error term.
Table 1: Village wise distribution of sampled wheat growers in the study area.
|
Towns/Tehsils |
Union councils |
Villages |
Small farms |
Large farms |
All farms |
|
Town I |
Lala |
Tambalpura |
10 |
05 |
13 |
|
Kala kaley |
08 |
04 |
11 |
||
|
Gulbela |
Gulbela kaley |
12 |
06 |
15 |
|
|
Mashai |
15 |
07 |
22 |
||
|
Nahqi |
Daman Afghani |
11 |
04 |
15 |
|
|
Mian Gujar |
10 |
05 |
11 |
||
|
Town II |
Mera Kachori |
jhagra |
13 |
03 |
16 |
|
Mera Kachori |
08 |
04 |
08 |
||
|
Urmarmiana |
Umar talab |
15 |
04 |
19 |
|
|
Urmarmiana |
11 |
05 |
13 |
||
|
Urmarpayan |
Urmarpayan |
10 |
04 |
13 |
|
|
Mandoori |
11 |
05 |
11 |
||
|
Total |
144 |
56 |
200 |
Source: Office of extension circle of district Peshawar, agriculture department, Khyber Pakhtunkhwa.
Analytical instruments
Test for differences of means (H1): To test the differences between two averages of two farm groups, the independent unpaired t-test was used (Aurangzeb et al., 2007) that is:
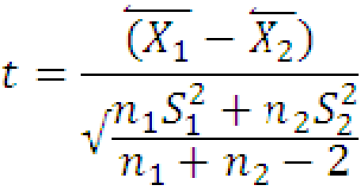
Where;
X1 and X2 are the means of two farm groups and S12 and S22 are sample variances of small and large farms respectively.
Test for structural differences homogeneity of parameters estimated (H2): The following chow test were used for the homogeneity of parameters estimated between two farm groups (Gujrati, 1995).
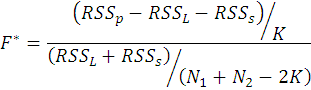
Where;
RSSp= Residuals Sum of Square (pooled), RSSL= Residuals Sum of Square (Large farms), RSSs=Residuals Sum of Square (Small farms), N1= No. of small farms, N2= no. of large farms, K = no. of parameters; If F*> F (Tab), its means that the two farm groups are significantly structurally different.
Test for differences in farm productivity(H3): A dummyvariable (1 for large farms and 0 for small farms) was used in the model for testing the difference in the farm productivity between the small and large farms (Khan, 1979).
If the coefficient of dummy variable is not equal to zero, its means that there is difference in the farm productivity between two farm groups.
Results and Discussion
The socioeconomic characteristics of sample households by farm size are presented in the form of their means, mean differences and significance by employing unpaired Student t-testfor difference of means. Table 2 shows that there was a significant difference in the means of all factors including productivity except age between small and large farms. Data reveals that education level had a direct relationship with farm size. Overall education level of sample respondent was very low as compared to the other province of Pakistan. The result regarding the difference in the mean age depict that there was no significant difference in the two farm groups. The average family size, labor, fertilizer, capital, insecticides and pesticides, wheat price, farmers experience and wheat productivity of the sample householdsby farm size in the Table 2 depicts that, there was a significance difference in the means of large and small farm. It was also found that there was a direct (positive) relation among the factors and farm sizes. The results were supported by studies of Saeed and Khan (2007) and Aurangzeb et al. (2007).
Table 2: Test of equality of means of socioeconomic factors between small and large farms.
|
Variables |
Mean values |
Mean differences |
T-ratio |
|
|
Large farms |
Small farms |
|||
|
Education |
6.48 |
2.56 |
3.92 |
4.541* |
|
Age |
47.80 |
42.93 |
4.867 |
6.90ns |
|
Family Size |
14.20 |
10.25 |
3.95 |
2.95** |
|
labor |
7.50 |
4.73 |
2.76 |
10.93** |
|
Fertilizer |
5665 |
3720 |
1945 |
20.25*** |
|
Capital |
10730 |
8745 |
1985 |
18.19** |
|
Insec/Pesticides |
2535.70 |
1874.30 |
661.27 |
14.10** |
|
Wheat Price |
2075.50 |
1819.00 |
56.50 |
9.90*** |
|
Experience |
20.50 |
12.93 |
7.57 |
6.97** |
|
Farm productivity |
1260.42 |
797.51 |
937.77 |
1.57*** |
Note: *, ** and ***: Significant at 10, 5 and 1 % respectively.
To test the impact of socioeconomic factors on productivity level of farm groups, homogeneity of parameters estimated (slopes), difference in the productivity level between small and large farms,the above model was estimated for: (i) for large farm (ii) small farm (iii) pooled data (all farm) (iv) pooled data with a dummy variable, 1 for large farm and 0 small farm (Amaefula et al., 2012).
All the model has high explanatory power and indicates that more than half of the variation in the productivity level is due to the socioeconomic factors included in the model. Education, age, family size, fertilizer and wheat price shows positive and significant impact on wheat productivity of largefarms while labor and capital show insignificant but positive relationship with wheat productivity. In case of small farms, education, age and capital shows positive but insignificant impact while family size, labour, fertilizer, insecticides/pesticides and wheat price shows positive and highly significant impact on wheat productivity. Results in the Table 3 revealed that education have more influence on wheat productivity of small farms as compared to large farms. The coefficient of age, family size and capital of large farms have more influence than small farms while opposite in case of labour, fertilizer and wheat price of small farms have more influence than large farms on wheat productivity. Interestingly farmers experience shows a negative but significant impact on wheat productivity in all cases.
Test for homogeneity of parameters or structural differences
To test the equality of parameters of the explanatory variables of two farm groups, Chow test was employed by using Residual sum of square (RSS) for small farm, large farm and polled data presented in the Table 3. Chow F-Ratio was calculated as under:
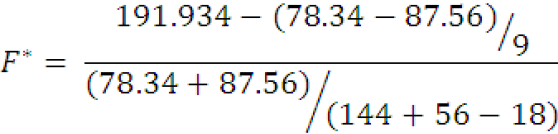
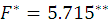
Comparison of F-calculated and theoretical value F-tabulated with V1= 9 and V2 = 182 degree of freedom at 5% level of significance suggest that difference between parameter estimates of two farm groups was statisticallysignificant. Inother words, two farm groups structurally and technologically different. Thisfinding were consistent to the earlier results of Sial et al. (2012), Saeed and Khan (2007).
Test for equal productivity
In order to test the equal productivity between the two farm groups, Equation 1 was estimated for pooled data with dummy variable. The coefficient of dummy variable differentiates two farm groups in term of productivity. The coefficient of dummy for large farm is 0.1398 and is significant at 1% (Table 3). The positive value indicates that large farms shows more (14%) productivity as compared to small farms. This confirmed the results of Chow test for the structural differences between the two farm groups due to the influence of farm size. Result of hypothesis three was supported by the study of (Bhuiyan, 1987; Khan, 1979).
Conclusions and Recommendations
From testing the threemain hypotheses in the detailed analysis of socioeconomic characteristics between small and large farms, it was concluded that there was a significance difference in the socioeconomic factors affecting wheat productivity between two farm groups. Significant difference was found between the estimated parameters in the production function for both farms. The output elasticities of input on large farms were notably higher relative to elasticities of inputs on small farms. It is concluded from the finding
Table 3: Influence of socioeconomic factors on wheat productivity.
|
Variables |
Large farms |
Small farms |
Pooled |
Pooled with dummy |
||||
|
β |
t-ratio |
β |
t-ratio |
β |
t-ratio |
β |
t-ratio |
|
|
Intercept |
6.034 |
1.038 |
5.9854 |
2.457 |
5.8843 |
1.237 |
5.7543 |
1.0234 |
|
Education |
0.0078 |
1.457* |
0.0098 |
3.781 |
0.0076 |
2.589* |
0.0087 |
1.934** |
|
Age |
5.0572 |
3.684* |
3.0913 |
4.590 |
5.0295 |
2.974* |
4.8724 |
2.654* |
|
Family size |
15.8014 |
4.673* |
13.6924 |
6.801** |
14.6126 |
4.001* |
15.8967 |
3.750** |
|
labor |
0.2321* |
5.032 |
0.3425 |
4.691** |
0.3091 |
4.078* |
0.3290 |
3.923* |
|
Fertilizer |
0.0987 |
3.254** |
0.1092 |
3.567** |
0.9532 |
2.673** |
0.9349 |
2.673** |
|
Capital |
0.0034 |
1.450 |
0.0013 |
1.581 |
0.0143 |
2.492* |
0.0024 |
3.324* |
|
Insec/Pesticides |
0.0053 |
2.788* |
0.0089 |
4.791** |
0.0076 |
3.887* |
0.0087 |
2.345** |
|
Wheat Price |
0.2761 |
1.348* |
0.3971 |
2.903** |
0.2619 |
1.923* |
0.2871 |
1.927** |
|
Experience |
-0.0472 |
-3.712* |
-0.2013 |
2.391* |
-0.0071 |
-3.015* |
-.0013 |
2.972*** |
|
Dummy |
0.1392*** |
|||||||
|
Residual SS |
78.34 |
87.56 |
185.78191.934 |
191.934 |
||||
|
R2 |
0.761 |
0.693 |
0.795 |
0.810 |
||||
|
Adj R2 |
0.732 |
0.641 |
0.739 |
0.789 |
||||
|
F-Ratio |
311.23** |
281.45** |
489.25** |
497.34*** |
||||
Note: *, ** and ***: Significant at 10, 5 and 1 % respectively.
of Chow test for structural differences that there was a remarkable technological gap between the two farms. Finally, the results of Chow test are confirmed by introducing a Dummy (large farms) variablein the production function for equal productivity between two farm groups. Itis concluded from the coefficient of dummy that large farms show almost 14% higher productivity than the small farms.
Results of the current study suggest thefollowing recommendations to minimize the technological and productivity gape between small and large farms.
- Education level of farmers is necessary to improve productivity. Therefore, government and agencies should initiate programs to educate small farmers and improve traditional agriculture.
- Large farms are better placed than small farms with respects to input use. Therefore, small farms should be given adequate access to these inputs so that they may be at least equally technically efficient.
- Farmers must be trained by extension programs in order to use the inputs efficiently.
Novelty Statement
This research provides sufficient information about the farmer’s socioeconomic characteristics differences and its impact on wheat productivity of the study area.
Author’s Contribution
Sajad Ali: Principal author, who conducted research, experiments and wrote first draft of the manuscript.
Naeem Ur Rehman Khatak: Supervised the research study.
Iftikhar Ahmad: Helped in data analysis and interpretation.
Jangraiz Khan: Provided in technical guidance at every step.
Azra: Helped in overall format of the manuscript.
Conflict of interest
The authors have declared no conflict of interest.
References
Ahmad, M., G.C. Mustafa and M. Iqbal. 2002. Wheat productivity, efficiency and sustainability: A stochastic production frontier analysis. Pak. Dev. Rev., 41: 643-663. https://doi.org/10.30541/v41i4IIpp.643-663
Ali, S., J. Khan, A. Jadoon, M. Riaz and A. Khan. 2020. Evaluation of farmers socioeconomic characteristics influencing tomato output in district Peshawar, Khyber Pakhtunkhwa, Pakistan. Sarhad. J. Agric., 36(3): 894-899. https://doi.org/10.17582/journal.sja/2020/36.3.894.899
Amaefula, C., C.A. Okezie and R. Mejeha. 2012. Risk attitude and insurance: A causal analysis: Am. J. Eco., 2(3): 26-32.
Aurangzeb, M., S. Nigar and M.K. Shah. 2007. Benefit cost analysis of the maize crop under mechanized and traditional farming systems in the NWFP. Sarhad J. Agric., 23(1): 170-176.
Bagal, S.Y., R. Peshin, L.K. Sharma and N. Panotra. 2018. Impact of socio-economic factors on the productivity of wheat growers of Samba district of J and K state of India. Int. J. Chem. Stud., 6(3): 320-325.
Bhuiyan, M.S.R., 1987. Effect of farm size and tenurial status of land on production efficiency in an area of Bangladesh. Bangladesh J. Agric. Econ., X (1): 1-31.
Food and Agricultural Organization (FAO). 2009. Year wise world wheat statistics, www.faostat.fao.org
GoKP, 2017. Crop Statistics of Khyber Pakhtunkhwa, crop reporting services, agriculture and livestock department, Peshawar.
GoKP. 2008. Bureau of Statistics. Crop reporting services, Khyber Pakhtunkhwa.
GOP, 2017. Economic Survey of Pakistan. Ministry of Food, Agriculture and Livestock, Islamabad, Pakistan.
GOP, 2018. Economic Survey of Pakistan. Ministry of Finance, Islamabad. http://www.finance.gov.pk/survey_1718.html
Gujarati, D., 1995. Basic econometrics. McGraw Hill Co. Singapore.
Hashmi, M.S., M.A. Kamran, K. Bakhsh, M.A. Bashir, M. Israr and R. Ullah. Socio-economic factors and their influences on scale efficiency of wheat farms. Pure Appl. Biol., 4(4): 543-550. https://doi.org/10.19045/bspab.2015.44013
Hassan, I., M.B. Chattha, T.H. Chattha and M.A. Ali. 2010. Factors affecting wheat yield: A case study of mixed cropping zone of Punjab. J. Agric. Res., 48(3): 403-408.
Khan, M.H., 1979. Farm size and land productivity relationships in Pakistan. Pak. Dev. Rev., 18(1): 69-77. https://doi.org/10.30541/v18i1pp.69-77
Mahmood, H.Z., M. Qasim, M. Khan and M.I.U. Husnain. 2014. Re-examining the inverse relationship between farm size and productivity in Pakistan. J. Anim. Plant Sci., 24(5): 1537-1546.
Mburu, S., A-O., Chris and M. Richard. 2014. Analysis of economic efficiency and farm size: A case study of wheat farmers in Nakuru District, Kenya. Eco. Res. Int., 10 pages. https://doi.org/10.1155/2014/802706
Saeed, M. and N.A. Khan. 2007. Measurement of economic efficiency in agriculture of Peshawar District., Sarhad J. Agric., 23(1): 198-206.
Saqib, S., M.M. Ahmad, S. Panezai, Hidayatullah and K.K. Khattak. 2016. Access to credit and its adequacy to farmers in KhyberPakhtunkhwa: The case of Mardan district. Sarhad. J. Agric., 32(3): 184-191. https://doi.org/10.17582/journal.sja/2016.32.3.184.191
Shah, T., J. Tao, F. Shah, A. Farooq, M. Ishaq and S.B. Khan. 2016. A comparative study of the agricultural practices of members andnon-member farming community of model farm services center in Khyber Pakhtunkhwa Pakistan. J. Anim. Plant Sci., 26(6): 1787-1796.
Sial, M.H., S. Iqbal and A.D. Sheikh. 2012. Farm size productivity’ relationship, recent evidence from central Punjab. Pak. Econ. Soc. Rev., 50(2): 139-162.
Yamane, T., 1967. Statistics: An introductory analysis Harper and Row, New York, Evanston and London and John Weather Hill, Inc., Tokyo.
To share on other social networks, click on any share button. What are these?


