
Impact of Climate Change on Cotton Production in Pakistan: An ARDL Bound Testing Approach


Research Article
Impact of Climate Change on Cotton Production in Pakistan: An ARDL Bound Testing Approach
Mudassar Rashid1, Zuhair Husnain2, Usman Shakoor1* and Muhammad Iftikhar ul Husnain1
1Department of Economics, COMSATS University, Islamabad, Pakistan; 2Pir Mehr Ali Shah, Arid Agriculture University Rawalpindi, Islamabad, Pakistan.
Abstract | In the recent times agriculture sector has been considered as one of the most affected sectors by climate change. Climatic factors that have direct influence on agricultural productivity are: rise in temperature, heavy rainfall, precipitation, floods and drought etc. This paper has empirically examined the effect of climatic variations on cotton productivity in Pakistan. In order to evaluate the climate change, three climatic variables (rainfall, max. temp and min temp) and three non-climatic variables (technology, fertilizer and area) had been used for analysis. Historical climate data from 1981-2015, was collected from Pakistan Meteorological Department, while data of Technology, fertilizer and cotton area has been gathered from Pakistan Economic Survey. ARDL bound testing econometric approach was employed to gauge the empirical estimates. The outcomes of cointegration shows that all climate variables have statistically substantial effect on cotton productivity in Pakistan. Both rain-fall and maximum temperature have positive effects while minimum temperature has negative effects on cotton production. Furthermore, both fertilizer and area have positive impact on cotton production. long run cointegrating relationship holds among climate change variables and cotton productivity. mitigating negative impressions of climate change requires strategies focusing on the adaptation of climate resistant cultivars.
Received | February 06, 2019; Accepted | January 08, 2020; Published | March 03, 2020
*Correspondence | Dr. Usman Shakoor, Assistant Professor, COMSATS University, Islamabad, Pakistan; Email: [email protected]
Citation | Rashid, M., Z. Husnain, U. Shakoor and M.I. Husnain. 2020. Impact of climate change on cotton production in Pakistan: An ARDL bound testing approach. Sarhad Journal of Agriculture, 36(1): 333-341.
DOI | http://dx.doi.org/10.17582/journal.sja/2020/36.1.333.341
Keywords | Climate change, Cotton production, ARDL, Pakistan; JEL Classifications: C22, Q54
Introduction
Climate change is referred as “The change in climate occurred due to human activities and natural changes in environment for long term” (Solomon, 2007). The gases which are responsible for increasing the temperature of the earth are called Greenhouse gases (GHGs), which include methane, carbon dioxide, water vapors and nitrous oxide. These gases are generated mainly due to anthropogenic activities (Brown, 1998). Since pre-industrial period, the concentration of CO2 it can be observed that has increased from 280ppm to 380ppm due to excess use of traditional fuels (Stern et al., 2006). Intergovernmental Panel on Climate Change (IPCC) has predicted that if there are no proper policy derivatives in place for the reduction in emissions of GHGs it would increase from 550ppmto 700ppm in the mid of this century which would accelerate the temperature of pre-industrial era from 30C to 60C (Stocker et al., 2013). Consequently, there will be more droughts, floods, shortage of food, unpleasant weather, newly borne illnesses, and rise in sea level (Narayan and Tisdell, 2008).
Developed economies are responsible for high concentration of CO2 through various production and consumption activities. Their spillovers are being faced by the developing economies in the form of frequent floods, droughts, temperature escalations, erratic rainfall pattern; etc. Developing nations are more susceptible to these changes due to low adaptation strategies available (Rosenzweig and Parry, 1994; Schlenker and Roberts, 2008). The countries situated in tropical areas and having agriculture as a single main source of income are under great threat because of these spillovers (Stern et al., 2006).
The climate change is supposed to affect the different sectors of economies, but agriculture is one sector which is highly exposed to weather fluctuations. It affects agriculture productivity through increase in temperature, alteration in precipitation patterns, change in planting time, availability of water and evapotranspiration (Deshmukh and Lunge, 2012). Global climate variability impact on agriculture of China showed positive impacts on cotton yields (Zhang et al., 2010). Climate change has imparted negative impacts on agriculture which is directly related to human food and life. Their result shows that higher temperature and precipitation in summers increases the crop production. As a whole the increase in temperature and precipitation decreases the agriculture production annually (Delworth et al., 2012). Threshold level of temperature for cotton was found 33°C and 29°C for soybeans and corns respectively (Schlenker and Roberts, 2009). They further examined that the crop production is expected to decrease if temperature increases above the threshold level.
Pakistan is considered as extremely exposed country to calamities resulting due to climate change. (World Bank, 2009). Janjua et al. (2010) analysed the changing climate effect on wheat crop productivity of wheat in Pakistan. They have not found significant influence on productivity of wheat. Agriculture sector contributes to 20.9 percent to GDP and 43.5 percent source of livelihood of to rural population (GoP, 2015). This sector is now more vulnerable to climatic changes. Higher absorptions of carbon dioxide can positively affect crops, increase in temperatures and decreased precipitation (GoP, 2009).
In the past numerous studies examined the climate change effects on agricultural productivity. Raza and Ahmad (2015) showed the outcomes of climate vulnerabilities on cotton profitability in Pakistan at regional level. They utilized disintegrated information of yield, region, manure, temperature and precipitation from 1981-2010. They found the positive effect of physical (zone, compost, P/NPK proportion and innovation) and climatic factors (temperature and precipitation) on cotton yield. Siddiqui et al. (2012) analyzed the impact of climate change on four major crops (wheat, rice, cotton and sugarcane) in Pakistan. Balanced panel design had been used from 1980-2009. Short run negative impact of rise in temperature on wheat production was evident while there was a positive effect in long run. Increase in precipitation poses an adverse impacts in both runs. A rise in temperature up to a certain level, increases the rice production. Surprisingly, rise in precipitation does not damage the rice production. In case of Cotton production, changes in both climatic variables has negative impact. Sugarcane productivity is also negatively affected by increase in temperature. Ahmed and Schmitz (2011) conducted a study to know in what ways cultivated outputs are affected by climatic variations across the four provinces of Pakistan. lower yield is expected in dry regions, posing a great threat to food security. Shakoor et al. (2017) found that escalating average temperatures will decrease maize outputs while mean min. temperature would increase maize production till 2021. Gorst et al. (2015) explored that how outputs would be affected by climatic change in two provinces (Punjab and Sindh) of Pakistan. Results showed that wheat and cotton crops have benefited from climate change. Shakoor et al. (2011) analysed agriculture output vulnerabilities of arid zones by using Ricardian approach to check the relation between Net Farm Revenue (NFR) and climate change variables. The results of study by revealed that Net Farm Revenue (NFR) decreased as a result of NFR. Hanif et al. (2010) checked the impact of changing climate on agriculture in Punjab using FGLS panel regression technique. The result confirmed that climate change affects the price of the land which is an important variable for net revenue.
As above mentioned, literature showed that many studies on climate change have been conducted on wheat, rice and maize crops of Pakistan, however in case of cotton production, little is known about the potential damage of climatic changes. Hence, it is the need of the time to tackle the problem of potential harm of environmental change on cotton production as Pakistan is the fourth biggest producer and third most elevate consumer of cotton in the world. The yield of cotton is extended more than 1200 km on Indus estuary (Naheed and Rasul, 2010). Cotton is one of the important crops of Pakistan. It is the third major crop of Pakistan after wheat and rice. Due to high increase in temperature, evapotranspiration increases, which increases water stress and reduces plant growth and production of cotton crop. Generally, cotton is sown in Punjab and Sindh areas where it receives high temperature and low precipitations (Iqbal, 2011). Due to drastic climatic changes, cotton production is under threat. Cotton production is predicted to be decline by 20-30% due to climate change (GoP, 2009). The main objective of our current research investigation is to examine the impact of climatic variables i.e. rainfall, average minimum and maximum temperatures and availability of water, on cotton crop productivity. The study will also explore the impact of some other factors on cotton production and based on the empirical finding the study will recommend some suitable policy framework to manage climate change impacts if any.
The current research paper is broken down in different sections containing theoretical framework, materials and methods and estimated results and discussion. Last section contain the conclusion of the paper.
Theoretical framework
There are mainly two approaches which examines the effect of climate change stresses on agriculture sector i.e. Production function approach and the Ricardian approach. The latter empirically analyses climatic variations directly affecting the agricultural production and considers the farmer’s response in adaptions to the local climate. This approach on one hand estimate the effect of climatic variations which affect the agricultural output directly and on the other hand assesses the indirect replacements of different inputs by introducing diverse activities and other probable adoption practices to different climate. Second approach i.e. the production function approach evaluates the relation of agriculture output to traditional and modern production variables. The current study uses the latter approach for the sake of examining how climate change variables impact the production of cotton. We have employed both traditional and modern inputs as determinants of cotton production. The traditional input used is land while modern inputs used are fertilizer and tractors. Besides, these climatic factors like rain and temperature (both minimum and maximum) are also included in the production function (Barrios et al., 2008). The following cotton production function will be estimated:

Where;
cott is cotton production, which is function of rain (raint), technology (techt), maximum temperature (temMaxt), minimum temperature (temMaxt), fertilizer (fert) and area (areat) under cotton production. γ`s are the coefficients of variables to be estimated. Finally, vt is stochastic error term. All variables are converted into natural logarithm form so that their coefficient can be represented in the form of elasticities.
Materials and Methods
The current study has used seven variables for the analysis which includes cotton production, mean precipitation, mean max. temperature, mean min. temperature, technology, fertilizer and area under cotton crop. three variables are climate variables while the remaining variables are non-climatic variables. Cotton production is dependent variable and is taken in metric tons. Mean rainfall is taken in millimeter (mm). Mean minimum temperature and mean maximum temperature are measured in Celsius scale. Area under cotton production is in thousand hectares. Fertilizer data is taken in thousand nutrients tons and technology factor is proxied by numbers of tractors. The data of climatic variables is collected from Pakistan Meteorological Department. The data of cotton production and area under cotton crop production and technology is collected from Pakistan Economic Survey. The data for fertilizer is taken from National Fertilizer Development Center (NFDC). For empirical analysis data is taken for the period 1982-2015.
The study has used the ARDL approach of Pesaran et al. (2001). This method possesses some advantageous features over the traditional cointegration methods. First, this technique is applicable even if variables are fractionally integrated. In turn, the variables need to be made stationary at I (1) while using the traditional methods of cointegration, such as FMOLS, DOLS, Engle-Granger (1987) or Johansen method (1988, 1990).Second, it provides short run as well as long run cointegration. Third, contrasting other methods of cointegration, the lag lengths need not be symmetrical in case of ARDL estimation. Fourth, endogeneity is less problematic in the ARDL as it is free from residual correlation i.e. all variables are endogenous.
ARDL involves a least squares regression which contains lags in terms of both predicted and independent variables. The notation (p, q1, …..qk), is used to denote the ARDL, given that p shows number of lags for predicted variable, q1 shows number of lags for the foremost independent variable, while qk shows number of lags for the kth independent variable. ARDL constitutes of a linear time series model, which in general form can be written as follows:

Where;
The predicted variable is denoted by yt and xt, ….,xk are k explanatory variables. The model may include fixed regressors, which are independent variables without lagged terms (qj=0). Dynamic regressors are those which include one lagged term, to say the least. α is constant term. γi and βj, i are coefficients of lagged yt and xj, t-i respectively. ϵt is innovation term. To specify an ARDL model, determination of lag length is pre-requisite regarding every variable.
ARDL model estimates the association existing between the independent and predicted variables. And hence can be modified into long run depiction, which shows the change in predicted variable caused by variation in independent variables. Long run coefficient can be calculated as follows:

The cointegrating regression form of an ARDL model is obtained by transforming (1) into differences and substituting the long-run coefficients from (2):

Where;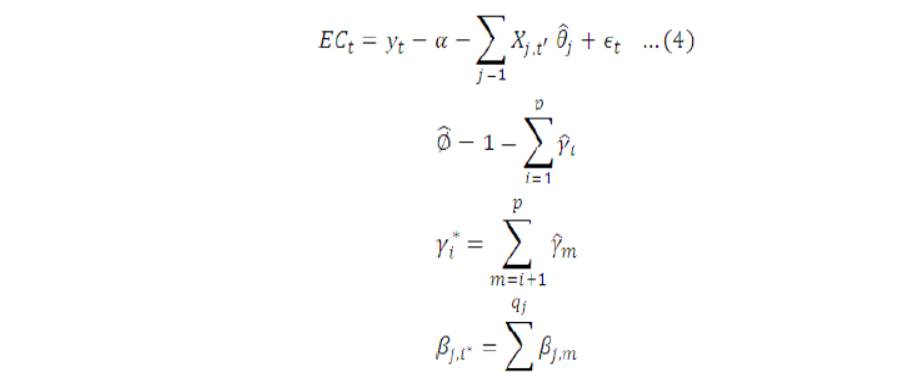
Pesaran et al. (2001) has developed Bounds test to see if a long run association exists between the predicted and explanatory variables in the ARDL model. The Bounds test procedure converts cointegrating Equation 3 into the following form:

Existence of level relationships can be tested as:

The coefficient estimates used in the test may be obtained from a regression using (1) or can be estimated directly from a regression using (5).
Under null hypothesis, the test estimates shown by Equation 5 demonstrate a separate distribution, based on the regressors being I (0) or all I (1). Distribution is found to be non-standard for the given cases. Pesaran et al. (2001) propose the use of critical values as limits when regressors are a combination of I (0) and I (1).
Results and Discussion
Descriptive statistics and unit root testing
Table 1 describes the descriptive statistics of all the variables of the study. Before estimation, we have applied unit root test i.e. Augmented Dickey Fuller (ADF)
Table 1: Descriptive statistics.
| Area | Production | Fertilizer use | Rainfall | Max temp | Min temp | Technology | |
| Mean | 2768.2 | 9804.8 | 591.6 | 36.5 | 36.7 | 23.5 | 28718.8 |
| Minimum | 2108 | 2908 | 172.5 | 15.1 | 35.3 | 22.7 | 1529 |
| Maximum | 3193 | 14265 | 1090 | 80.4 | 37.7 | 24.5 | 71607 |
| St. deviation | 300.7 | 2942.9 | 303.3 | 13.6 | 0.50 | 0.21 | 19269.4 |
Table 2: Results of ADF and phillips-perron unit root tests.
| ADF | Phillips-Perron | |||||
| Level | First difference | Level | First difference | |||
| Cotton production | -2.287 | -7.570 | I(1) | -2.226 | -10.046 | I(1) |
| Rainfall | -5.541 | I(0) | -5.582 | I(0) | ||
| Technology | -2.987 | I(0) | -2.856 | -35.478 | I(1) | |
| Maximum temperature | -4.966 | I(0) | -4.963 | I(0) | ||
| Minimum temperature | -3.586 | I(0) | -3.575 | I(0) | ||
| Fertilizer | -1.486 | -6.393 | I(1) | -2.268 | -6.530 | I(1) |
| Area | -2.513 | -8.189 | I(1) | -2.704 | -8.792 | I(1) |
to check the stationarity of variables. In ADF, null hypothesis is that of the existence of unit root. If ADF statistics are lower than critical value, the null hypothesis is accepted. ADF results shown in Table 2 depicts that rain fall, technology, min and max temperature do not have a unit root. In turn, unit root is eliminated after first difference for cotton production, and fertilizer so, the alternative hypothesis is rejected. We have additionally checked the stationary properties of these factors utilizing Phillips-Perron unit root test. This test shows all factors being in harmony with the ADF test while unit root for technology variables is eliminated after differencing. These results depict all variables having mixed level of integration instead of same level depending on whether they become stationary at I(0) or I(1).
ARDL lag selection
To select the appropriate lags for best ARDL model we have used Akaike Information Criterion (AIC). The value of AIC is reported in Figure 1. The lowest value of AIC is obtained at ARDL (2, 2, 1, 2, 2, 2, 0). Thus, in our model cotton production which is the dependent variable will appear with two lags while the independent variables have different lags.
| F-static | Critical value | Lower bound | Upper bound | Decision |
| 4.703812 | 1% | 3.15 | 4.43 | Co-integration |
| 5% | 2.45 | 3.61 | ||
| 10% | 2.12 | 3.23 |
ARDL bounds test
Long run co-integration between variables is checked using the ARDL bound test. Table 3 provides the estimates of bound test. The F-statistic stands at 4.703 which is larger compared to upper bound value which is 4.43. Therefore, the alternative hypothesis of co-integration is accepted at 1% level of significance. Thus, results confirmed presence of long run co-integration.
Long and short run estimates
Table 4 shows the results of long run estimation. The rainfall coefficient is of statistical significance and directly related to cotton production, which indicates rain fall increases cotton production in Pakistan. The coefficient’s value implies that an increase in average rain fall by one percent will increase cotton production by 0.369 percent. Good rainfall helps in proper germination of cotton seedlings and vegetative growth of cotton crop. Like rain fall technology proxied number of tractors also have significant positive effect on cotton production. Economically speaking, if technology will increase by one percent then increase in cotton production will be 0.184 percent. It is expected that an increase in the technology factor would increase the production of cotton as increase in no of tractors have made agriculture practices easy and more effective. It helps in a good and timely preparation of crop field ultimately providing a good condition for crop germinations. Max temperature was found to be positively and significantly related to cotton production while min temperature was found to be negatively related to cotton production. If maximum temperature increases by one percent cotton production will increase by 0.588 percent. As cotton has high tolerance to survive in high temperature due to its vertical tap root system, it is mostly cultivated in the high warmest regions. Mostly it is cultivated in central and southern Punjab and in Sindh province where high temperatures are encountered. Raza and Ahmad (2015) and Song et al. (2010) explained that maximum temperature has significantly positive impact on cotton productivity. Reilly (2002) determined that cotton is well adopted to higher temperature.
In turn, one percent increase in minimum temperature will decrease cotton production by -0.637 percent. It is important to note that the negative effect of minimum temperature on cotton is greater than the positive effect of max temperature. Fertilizer is significantly and positively related to cotton production with regard to Pakistan. The results for fertilizer indicate that one percent increase in fertilizer used for cotton crop may enhance the productivity of cotton by 0.826 percent. Fertilizer enhances the production of agriculture in two ways. First it increases the growth of the crop and second it increases the fertility of the land where the crop is sown. Raza and Ahmad (2015) reported that fertilizer has significant positive impact on cotton production in Pakistan. Song et al. (2004) stated that increased use of fertilizer can in turn increase cotton production. Area also has positive impact on cotton production. One percent increase in area for cotton cultivation will increase cotton productivity by 0.537 percent. However, this result is statistically insignificant. High p-value of Breusch-Pagan-Godfrey test of heteroskedasticity indicates homoscedasticity for the given model. Similarly, the absence of autocorrelation in the model is depicted by the high p-value of Breusch-Godfrey serial correlation LM test. Short run estimates showed that error correction term was of statistical significance and negative (results not reported). In the short run, fertilizer, rainfall and maximum temperature showed significant effect on cotton production while minimum temperature didn’t show any significant negative influence with regard to cotton production.
| Intercept | -3.866 |
| (-0.677) | |
| Rainfall | 0.369** |
| (2.086) | |
| Technology | 0.184** |
| (2.122) | |
| Maximum temperature | 0.588*** |
| (3.769) | |
| Minimum temperature | -0.637*** |
| (-4.651) | |
| Fertilizer | 0.826*** |
| (10.092) | |
| Area | 0.537 |
| (0.987) | |
| Breusch-Pagan-Godfrey heteroskedasticity test | 1.474 |
| [0.234] | |
| Breusch-Godfrey serial correlation LM test | 1.102 |
| [0.363] |
Note: Values in parentheses are student t-values. Values in brackets are p-values. *** (**) indicates that the coefficient is statistically significant at 1%(5%) level of significance.
Cumulative sum and cumulative sum of squares
After development of long-run relationships, these criterions are functioned to check the consistency of the model (Brown et al., 1975). The model is steady if the plot of cumulative sum and cumulative sum of square stays within the 5% critical bands. Figures 2 and 3 provide the results of CUSUM and CUSUMQ test, respectively. It shows that model under study is stable.
Conclusions and Recommendations
Current research empirically investigates the effects of rainfall, maximum temperature and minimum temperature along with technology, fertilizer and area on cotton productivity in Pakistan. First, stationarity tests were performed i.e. ADF and Phillips-Perron unit root tests. It has been found that research variables have mixed order of integration. Therefore, to gauge the long run associations amongst variables we have employed ARDL test. ARDL bounds test confirmed variables are cointegrating in long run. Results further showed climatic variables like rainfall and maximum temperature have placed a significant, favourable influence on cotton production while minimum temperature was found to have a negative effect on cotton production. It is evident from the results that adverse effect of increase in minimum temperature exceeds the positive effect that comes with an increase in maximum temperature. Thus, cotton crops need to be safeguarded from increase in minimum temperature. However, increase in maximum temperature is beneficial for cotton production. Technology, which is proxied by number of tractors, has significant positive effect on cotton production. Further, both fertilizer and area have positive impacts on cotton production.
Based on the empirical results it is recommended that those cotton varieties which are more temperature variations tolerant should be introduced. For this purpose, government should focus on research and development. Agriculture extension department should be responsible to provide on time and on farm information regarding climate fluctuations. It is also recommended that government should provide latest agriculture technology which would increase the crop yields and will also be cost effective in long run.
Novelty Statement
The research brings novelty by examining the climate change impacts on cash crop (cotton) of Pakistan by employing robust econometric analysis.
Author’s Contribution
MR contributed to concept and design. ZH wrote literature review. US wrote first draft and did database handling. MZ did analysis. MIH wrote result section. MU revised the manuscript and NK wrote introduction section of manuscript.
References
Ahmed, M. and M. Schmitz. 2011. Economic assessment of the impact of climate change on the agriculture of Pakistan. Business and Economic Horizons (BEH), 4(1232-2016-101145), 1-12.
Barrios, S., B. Ouattara and E. Strobl. 2008. The impact of climatic change on agricultural production: Is it different for Africa? Food Policy 33(4): 287-298.
Brown, R., J. Durbin and J. Evans. 1975. Techniques for testing the constancy of regression relationships over time. J. R. Stat. Soc. Ser. B (Methodological), 37(2): 149-192. Retrieved from http://www.jstor.org/stable/2984889; https://doi.org/10.1111/j.2517-6161.1975.tb01532.x
Brown, S.P. 1998. Global warming policy: some economic implications. Econ. Rev. Fed. Res. Bank of Dallas, Issue Q IV, pp. 26-35. Online available: https://ideas.repec.org/a/fip/fedder/y1998iqivp26-35.html; https://doi.org/10.1353/aph.1998.0015
Delworth, T.L., A. Rosati, W. Anderson, A.J. Adcroft, V. Balaji, R. Benson, K. Dixon, S.M. Griffies, H.C. Lee, R.C. Pacanowski, G.A. Vecchi, A.T. Wittenberg, F. Zeng and R. Zhang. 2012. Simulated climate and climate change in the GFDL CM2. 5 high-resolution coupled climate model. J. Clim. 25(8): 2755-2781. https://doi.org/10.1175/JCLI-D-11-00316.1
Deshmukh, D., and H. Lunge. 2012. Impact of global warming on rainfall, and cotton lint with vulnerability profiles of five districts in Vidarbha, India. Int. J. Sci. Technol. Res. 1(11): 77-85.
Engle, R.F. and C.W. Granger. 1987. Co-integration and error correction: representation, estimation, and testing. Econ. J. Econ. Soc. 55(2): 251-276. https://doi.org/10.2307/1913236
Engle, R., and C. Granger. 2001. Co-Integration and error-correction: representation, estimation, and testing. Econ. Soc. Monogr. 33: 145-172. https://doi.org/10.1017/CBO9780511753978.009
GoP. 2015. Pakistan Economic Survey, Chapter 2, Agriculture, Ministry of Finance, Government of Pakistan, Islamabad. Islamabad.
GoP. 2009. Pakistan Economic Survey, Chapter 15, Environment, Ministry of Finance, Government of Pakistan, Islamabad.
Gorest, A., G. Ben and D. Ali. 2015. Crop productivity and adaptation to climate change. Centre for climate change economics and policy working paper no. 214. Grantham Res. Inst. Clim. Change Environ. Working Pap. No. 189.
Haim, D., M. Shechter and P. Berliner. 2008. Assessing the impact of climate change on representative field crops in Israeli agriculture: a case study of wheat and cotton. Clim. Change. 86(3-4): 425-440. https://doi.org/10.1007/s10584-007-9304-x
Hanif, U., S.H. Syed, R. Ahmad, K.A. Malik and M. Nasir. 2010. Economic impact of climate change on the agricultural sector of Punjab [with comments]. Pak. Dev. Rev. 49(4): 771-798. https://doi.org/10.30541/v49i4IIpp.771-798
Hoekstra, A.Y., A.K. Chapagain, M.M. Aldaya and M.M. Mekonnen. 2009. Water footprint manual: State of the art 2009.
Iqbal, J., 2011. Modeling the impact of climate change on seed cotton (Gossypium hirsutum L.) Yield in Punjab, (Pakistan). Univ. Agric., Faisalabad.
Janjua, P.Z., G. Samad and N. Khan. 2014. Climate change and wheat production in Pakistan: An autoregressive distributed lag approach. NJAS-Wageningen J. Life Sci. 68: 13-19. https://doi.org/10.1016/j.njas.2013.11.002
Janjua, P.Z., G. Samad, N.U. Khan and M. Nasir. 2010. Impact of climate change on wheat production: A case study of Pakistan [with Comments]. Pak. Dev. Rev. 49(4): 799-822. https://doi.org/10.30541/v49i4IIpp.799-822
Johansen, S., 1988. Statistical analysis of cointegration vectors. J. Econ. Dyn. Cont. 12(2): 231-254. https://doi.org/10.1016/0165-1889(88)90041-3
Johansen, S. and K. Juselius. 1990. Maximum likelihood estimation and inference on cointegration-with applications to the demand for money. Oxf. Bull. Econ. Stat. 52(2): 169-210. https://doi.org/10.1111/j.1468-0084.1990.mp52002003.x
Motha, R.P. and W. Baier. 2005. Impacts of present and future climate change and climate variability on agriculture in the temperate regions: North America. Increasing Clim. Variabil. Change, 70(1-2): 137-164: Springer. https://doi.org/10.1007/s10584-005-5940-1
Naheed, G. and G. Rasul. 2010. Recent water requirement of cotton crop in Pakistan. Pak. J. Meteor. 6(12): 75-84.
Narayan, P.K. and C. Tisdell. 2008. Global warming and the future of Pacific Island countries. Int. J. Soc. Econ. 35(12): 889-903. https://doi.org/10.1108/03068290810911444
Odhiambo, N.M. 2009. Energy consumption and economic growth nexus in Tanzania: An ARDL bounds testing approach. Energy Policy. 37(2): 617-622. https://doi.org/10.1016/j.enpol.2008.09.077
Pesaran, H., and Y. Shin. 1999. An Autoregressive distributed lag modelling approach to cointegration chapter 11. Paper presented at the Econ. Econ. Theory 20th Century: The ragnar frisch centennial symposium.
Pesaran, M.H. and B. Pesaran.1997. Working with Microfit 4.0: interactive econometric analysis; [Windows version]. Oxf. Univ. Press.
Pesaran, M.H. and R.P. Smith. 1998. Structural analysis of cointegrating VARs. J. Econ. Surv. 12(5): 471-505. https://doi.org/10.1111/1467-6419.00065
Pesaran, M.H., Y. Shin and R.J. Smith. 2001. Bounds testing approaches to the analysis of level relationships. J. Appl. Econ. 16(3): 289-326. https://doi.org/10.1002/jae.616
Pesaran, M.H. and Y. Shin. 1999. An autoregressive distributed lag modelling approach to cointegration analysis. Econ. Econ. Theory 20th Century: The ragnar frisch centennial symposium, strom, S. (ed.) Cambridge Univ. Press.
Raza, A., and M. Ahmad. 2015. Analysing the impact of climate change on cotton productivity in Punjab and Sindh, Pakistan.
Reilly, J., and S. Paltsev. 2009. 8 Biomass energy and competition for land. Econ. Anal. Land Use Glob. Clim. Change Policy. 14: 182.
Reilly, J.M., 2002. Agriculture: the potential consequences of climate variability and change. Rep. Nat. Agric. Ass. Group U.S. Glob. Change Res. Prog. Cambridge Univ. Press, UK.
Rosegrant, M.W., S. Msangi, C. Ringler, T.B. Sulser, T. Zhu and S.A. Cline. 2008. International model for policy analysis of agricultural commodities and trade (IMPACT): Model description. Int. Food Policy Res. Inst. Washington, DC.
Rosenzweig, C., and M.L. Parry. 1994. Potential impact of climate change on world food supply. Nat. 367(6459): 133-138. https://doi.org/10.1038/367133a0
Safonov, G., and Y. Safonova. 2013. Economic analysis of the impact of climate change on agriculture in Russia. Oxf. Res. Rep.
Sainju, U.M., H.h. Schomberg, B.P. Singh, W.F. Whitehead, P.G. Tillman and S.L. Lachnicht-Weyers. 2007. Cover crop effect on soil carbon fractions under conservation tillage cotton. Soil Tillage Res. 96: 205-218. https://doi.org/10.1016/j.still.2007.06.006
Sayed, A.H., 2011. Climate change and its realities for Pakistan. Pap. Presented Proc. Symp. Chang. Environ. Pattern Impact Spec. Focus Pakistan.
Schlenker, W., and M.J. Roberts. 2008. Estimating the impact of climate change on crop yields: The importance of nonlinear temperature effects (No. w13799). Nat. Bureau Econ. Res. https://doi.org/10.3386/w13799
Schlenker, W., and M.J. Roberts. 2009. Nonlinear temperature effects indicate severe damages to US crop yields under climate change. Proc. Nat. Acad. Sci. 106(37): 15594-15598. https://doi.org/10.1073/pnas.0906865106
Shakoor, U., M. Rashid, A. Saboor, N. Khurshid, Z. Husnain and A. Rehman. 2017. Maize production response to climate change in Pakistan: A time series assessment. Sarhad J. Agric. 33(2): 320-330. https://doi.org/10.17582/journal.sja/2017/33.2.320.330
Shakoor, U., A. Saboor, I. ALI and A. MOHSIN. 2011. Impact of climate change on agriculture: Empirical evidence from arid region. Pak. J. Agric. Sci. 48: 327-333.
Siddiqui, R., G. Samad, M. Nasir and H.H. Jalil. 2012. The impact of climate change on major agricultural crops: evidence from Punjab, Pakistan. Pak. Dev. Rev. 51(4): 261-274. https://doi.org/10.30541/v51i4IIpp.261-276
Solomon, S., 2007. Climate change 2007-the physical science basis: Working group I contribution to the fourth assessment report of the IPCC. Cambridge Univ. Press. Vol. 4.
Song, Q.J., G.F. Jia, Y.L. Zhu, D. Grant, R.T. Nelson and E.T. Hwang, 2010. Abundance of SSR motifs and development of candidate polymorphic SSR markers (BARCSOYSSR_1.0) in soybean. Crop Sci. 50: 1950–1960. https://doi.org/10.2135/cropsci2009.10.0607
Song, Y.-L., Q. Zhang and W.-J. Dong. 2004. Impact of climate change on cotton production in xingjiang autonomous region. Agric. Meteorol. 3: 004.
Stern, N.H., S. Peters, V. Bakhshi, A. Bowen, C. Cameron, S., Catovsky and N. Edmonson. 2006. Stern review: The economics of climate change. Cambridge Univ. Press Cambridge. Vol. 30.
Stocker, T.F., D. Qin, G.K. Plattner, L.V. Alexander, S.K. Allen, N.L. Bindoff and P. Forster. 2013. Technical summary. In Climate change 2013: The physical science basis. Contrib. Working Group I Fifth Assess. Rep. Intergovernmental Panel Clim. Change Cambridge Univ. Press. pp. 33-115.
Ton, P., 2011. Cotton and climate change: Impacts and options to mitigate and adapt. Int. Trade Center, Geneva, Switzerland.
Pearce, W., R. Cline, N. Achanta, S. Fankhauser, K. Pachauri, J. Tol and P. Vellinga, 1996. The Social Costs of Climate Change: Greenhouse Damage and the Benefits of Control. P. Bruce, H. Lee, F. Haites (Eds.), Climate Change 1995. Econ. Soc. Dimens. Cambridge Univ. Press, pp. 179–224.
Warrick, R., 1988. Carbon dioxide, climatic change and agriculture. Geogr. J. 154(2): 221-233. https://doi.org/10.2307/633848
Way, N., R. Reddy and J. Rhodes. 2007. Students’ perceptions of school climate during the middle school years: Associations with trajectories of psychological and behavioral adjustment. Am. J. Community Psychol. 40(3-4): 194-213. https://doi.org/10.1007/s10464-007-9143-y
World Bank Report. 2009. Climate Change Strategy for South Asia Region, http://siteresources.worldbank.org/SOUTHASIAEXT/Resources/Publications/448813-1231439344179/5726136-1232505590830/1SARCCSJanuary192009.pdf.
Zhang, W., Y. Zhang, M. Löbler, K.P. Schmitz, A. Ahmad, I. Pyykkö and J. Zou. 2011. Nuclear entry of hyperbranched polylysine nanoparticles into cochlear cells. Int. J. Nanomed. 6: 535. https://doi.org/10.2147/IJN.S16973
Zhang, W.-Y., W.-D. Guo, L.-Q. Fang, C.-P. Li, P. Bi, G.E. Glass, J.-F., Jiang, S.-H., Sun, Q. Qian and W. Liu. 2010. Climate variability and hemorrhagic fever with renal syndrome transmission in Northeastern China. Environ. Health Perspect. 118(7): 915-920. https://doi.org/10.1289/ehp.0901504
To share on other social networks, click on any share button. What are these?


