
Impact of Price Volatility of Agriculture Commodities vs Food in Case of Pakistan


Research Article
Impact of Price Volatility of Agriculture Commodities vs Food in Case of Pakistan
Wajid Habib1, Saira Rasul2* and Hafiza Sadaf Zahra3
1Lahore University of Management Sciences, Lahore, Pakistan; 2Pakistan Institute of Development Economics, Islamabad, Pakistan; 3International Islamic University, Islamabad, Pakistan
Abstract | This study focuses on nature as well as the volatility of price determinants in Pakistan. The aim of this study is to investigate the causes of agriculture commodities and food products in Pakistan for selected commodities data ranging from June 1983 to June 2018. Data were collected from different sources including IMF (International Monetary Fund), World Bank, IFS (International Financial Statistics) as well as SBP (State Bank of Pakistan). The GARCH (1, 1) models was used to estimate all variables by using standard normal and student’s t-distribution. Further, to explore the dynamics of conditional volatility for agriculture commodities vs food products prices and explain the diffusion between both products. Results of the study concluded that the volatility effect and mean of both interest plus exchange rate affects the selected commodities overall. Further, the volatility of wheat price significantly affects the price series of the rice. On the other hand, poultry prices do not affect the mean prices of beef as well as other products. It has been noted that prices significantly impact the current prices of most of the commodities, excluding oil as well as cotton. For future, it is recommended to motivate that hedging instruments to be used for the reduction of price volatility by the farmers.
Received | October 09, 2020; Accepted | December 14, 2020; Published | June 30, 2021
*Correspondence | Saira Rasul, Pakistan Institute of Development Economics, Islamabad, Pakistan; Email: sairarasul_18@pide.edu.pk
Citation | Habib, W., S. Rasul and H.S. Zahra. 2021. Impact of price volatility of agriculture commodities vs food in case of Pakistan. Sarhad Journal of Agriculture, 37(3): 877-883.
DOI | https://dx.doi.org/10.17582/journal.sja/2021/37.3.877.883
Keywords | Agriculture commodities, Beef, Exchange rate, Fertilizer, Food, GARCH model, Interest rate, Poultry, Price volatility
Introduction
Agriculture is known as the backbone of developing economies like Pakistan. Prices of food and agriculture products always dispute with each other. Mostly in countries like Pakistan, prices of Agriculture products are very low as compared to Food prices. From the end of 2006 to the mid of 2008, prices of both national as well as international for food as well as agriculture products have risen radically. If we compare the prices, we come to know that in the last 30 years both agriculture products and food prices reached their highest levels. However, prices fall rapidly during the second half of 2008 due to the financial crisis and this is known as “2008 price spike” (Mitchell, 2008; Gilbert and Morgan, 2010a).
On the other hand, prices almost partially recovered that exceed pre-spike values at the end of the year 2009 (Mitchell, 2008; Gilbert and Morgan, 2010b) and also some products prices decreased up to 50 percent from their crowning, but as compared to 2005, still prices are higher (Balcombe, 2009). Macroeconomic effects of large food plus agriculture products prices have been following the booms and depression, leads to the even broad effects on the government budget, poverty, inflation, balance of payments and imports vs exports and theses price effects are known as volatility with peaks and spikes leads to the serious tasks for market participants (Roache, 2010). Deaton and Laroque (1992) and Cashin and McDermott (2002), both in their studies try to find out commodity prices and behavior of these commodities in different aspects. On the other hand, volatility prices experienced in agriculture products and food prices over period 2006-2009, as compared to 2006-2008 confound of prices by a sudden downfall in world food prices plus cause and effects of sharp and evident price disparities.
Some studies specifically focus on factors like “price spike” of the year 2008 (Abbot et al., 2008; Mitchell, 2008; Cooke and Robles, 2009; Gilbert and Morgan, 2010a) focused on the factors behind the global “price spike” of the year 2008. Most studies focused on changes that happened in the demand and supply factors. Like, on the supply side, low commodity inventories are major contributing factors for the underinvestment of the agriculture sector. As well on the demand side, China and some Asian economies who have fast economic growth emphasized. Bio fuels are also known as the emerging form of the alteration as the usage of food crops plus oil prices, money supply and value of dollar changes leads to change the agriculture commodity prices factors effecting as most of the economies are dominated by US dollar. Also some other factors like climatic changes, trading policies within the economies, plus expectations for prices vs market responses and speculations for future in trading options for markets of food (Mitchell, 2008; Cooke and Robles, 2009; Gilbert and Morgan, 2010a).
Most studies focused on the volatility of agriculture prices (Gilbert, 2006; Balcombe, 2009; Sumner, 2009; Gilbert and Morgan, 2010a; Huchet Bourdon, 2011). All related studies focused on prices i.e., they are low in the 1960’s as compared to the 1970’s but during the 1980’s as well as the 1990’s but still higher than 1960’s. Food and Agriculture Organization of the United Nations and the Organization for Economic Co-operation and Development (2001) report emphasized the volatility of agriculture prices throughout 2001-2010. If we specifically look at Pakistan scenario, 2006-2008 have remarkably volatility in the prices of almost every product related to food and agriculture (Hye et al., 2010; Hye and Siddiqui, 2010). Main agriculture products including maize, wheat as well as rice have not only increased abruptly but also the prices of other related products like fruits, meat, vegetables, ghee as well as oils. Furthermore, increased price of butter and milk went to double (Hye and Siddiqui, 2010).
FAO-OECD (2011) show that developing countries like Pakistan, the main reason for high prices of agriculture products and food commodities are due to high prices of energy costs, oil prices and weather conditions (Hye et al., 2010). Also, prices are affected due to factors affecting the demand and supply in Pakistan plus food habits as well as increase in income also leads to increase the food prices in Pakistan (Cornelisse et al., 1987; Atkin, 2013). Studies like (Hye and Siddiqui, 2010; Kemal et al., 2011; Abdullah and Rukhsana, 2012) mainly focused on determinants of price inflation for food products in Pakistan by using different econometric methods avoiding the volatility of food products. But when we try to find out the determinants of volatility, firstly we must find determinants at the level form for series plus to identify determinants of squared series changes.
The research gap of this study is that we have not found such study related to Pakistan that focused on nature as well as the volatility of price determinants in Pakistan. In this paper, we will mainly focus on two main determinants of food plus prices of agriculture products in Pakistan. Firstly, we will examine the volatility of both agriculture and food prices. Secondly, by using GARCH models, we will try to estimate the volatility of series plus regressing it on the set of explanatory variables by using the data of food and agriculture products.
Research objectives of our study mainly focused on: How to measure the volatility of food and agriculture prices in Pakistan? Persistence changes in the volatility of different series, as well as how volatility in one commodity price effect the other one series. We will also try to find out whether these volatility effects have any impact on the macroeconomic variables.
Materials and Methods
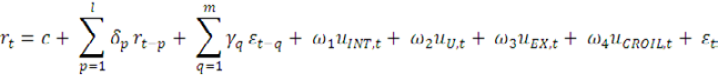
We have used GARCH (1, 1) Model in our study to investigate the price volatility of agriculture and food products in Pakistan. GARCH Model is defined as mean and variance equations, i.e.
Mean equation
Variance equations
GARCH(1,1)

Here in the above two equations rt represents the price return series, uINT,t (interest rate residuals), Uu,t (urea), UEX,t (exchange rate) and UCROIL,t (crude oil) correspondingly. On the other hand, side, in the variance equation, these are the squared residuals of the respective economic variables. To identify the appropriate lag length of both conditional mean as well as variance equation, in this study, we use the ARMA (p,q) model. Student “t” test is used to discover the most acceptable fitted model plus the ML, i.e., Maximum Log-Likelihood estimation is also used. Broyden (1970) gives the idea of BFGS-BOUND method which is used for unconstrained optimization is also used here for the estimation of parameters. Once to find the appropriate lag length of return series of both levels plus square residuals, the method called BFGS congregates for an optimum quadratic Taylor expansion stay saved.
Theoretically, residual series considered to be standardized need to have zero mean as well as unit variance. For specified GARCH model, we must have co-efficient for skewness as well as kurtosis to be close to zero. To check the normality of the series of residuals under the null hypothesis i.e., Co-efficient of skewness and kurtosis is close to zero is checked by considering the Jarque-Bera (JB) test here. The test named as JB is to be significant at a 5% significance level, only if its critical value is greater than 5.99. AIC (Akaike Information Criterion), SIC (Schwartz Information Criterion), Shibata Criterion, Hannan-Quin Criterion and log-likelihood all are to be used to assess the properties of the model i.e., the best fit. Ljung-Box pierces Q-statistics and Ljung-Box pierce Q²-statistics is used under the null hypothesis that there is no autocorrelation is used to check the absence of autocorrelation here in this study. Q²-statistics must be insignificant to reject the null hypothesis i.e., autocorrelation is still present in residual series. Residual Based Diagnostic testing (RBD) with the specified null hypothesis i.e., there is heteroscedasticity in the series are used to specifically check the presence as well as the absence of heteroscedasticity in the data which is used in the study. We also employ the LM-ARCH test with its null hypothesis, i.e., there is an ARCH effect in the series to check the ARCH effect here in this study. In the end, we used our best model based on employing all the above specified diagnostic test full filling the above-stated properties. In this study, we also save the conditional mean and variance of agriculture and food series for the modelling of volatility.
Data source and descriptive statistics
In our study, we use monthly data of some selected food plus agriculture products for Pakistan from June 1983 to June 2015. We have taken the data from different sources including IMF (International Monetary Fund), World Bank, IFS (International Financial Statistics) as well as SBP (State Bank of Pakistan). Prices are measured in the standard units for all commodities i.e., the US dollar. The items are included tea, rice, barley, beef, poultry, sugar, lamb, oil, wheat, and cotton. In this study, we also used prices of urea, interest rate and exchange rate to investigate sources of prices for agriculture and food products. To analyze the behavior of prices of return series, we take log of the first difference in the monthly prices of each commodity. By making simple line graphs, the logarithmic level series simply show the upward and downward movements of all included commodity prices. After that, for the return series off all selected commodity prices, we come to know that ARCH effect is indicated in the return series for low and high volatilities. For the squared return series, it indicates variations in volatility plus also high order serial correlation is observed by looking at the graphs. Descriptive statistics for the series of return are given in Table 1.
By looking at the values, we come to know that for the kurtosis values less than 3 included tea, rice, barley, beef, and poultry. Values less than 3 shows that the series is platykurtic and there is the probability of extreme values. It also shows that the series is non-normal. To check the normality for the series, we use the JB test in this study. Most of the series are non-normal by just comparing the critical values of JB-test here. If we look at the descriptive statistics, we come to know that overall, the series is skewed, leptokurtic as well as platykurtic. Here in this study, Non-normal distribution is shown for most of the return series of Pakistani markets. It is the main feature of most emerging markets (Choudry, 1996).
To check the stationarity, we use the KPSS test for the return series at a level as well as the first difference with constant for the unit root. All series are found to be non-stationary at a level as well as stationary at the first difference at the level of significance i.e., 1%, 5% and 10%. The results are shown at the Table 2.
Table 1: Descriptive statistics of return (rt ) series.
|
Min. |
Max. |
Mean |
SD |
Skew |
Ex-Kur |
J-B |
|
|
Tea |
-0.2349 |
0.2657 |
0.0015 |
0.0383 |
-0.0146 |
0.8123 |
12.1100 |
|
Rice |
-0.2153 |
0.3822 |
0.0023 |
0.0537 |
0.1251 |
0.7238 |
10.2100 |
|
Barley |
0.0189 |
0.4887 |
0.0035 |
0.0643 |
-0.1087 |
0.3783 |
14.3500 |
|
Beef |
-0.1796 |
0.5283 |
0.2169 |
0.0468 |
0.0971 |
0.4683 |
50.1595 |
|
Poultry |
-0.2398 |
0.8331 |
0.5159 |
0.4579 |
-0.0946 |
0.5583 |
30.2194 |
|
Sugar |
-0.2538 |
0.5613 |
0.0633 |
0.2568 |
0.0985 |
3.8935 |
44.1293 |
|
Lamb |
-0.2772 |
0.2832 |
0.0045 |
0.0678 |
-0.1142 |
3.8044 |
93.8033 |
|
Oil |
-0.1789 |
0.1795 |
0.0015 |
0.0557 |
0.4151 |
3.9170 |
99.2895 |
|
Wheat |
-0.3571 |
0.1040 |
0.0014 |
0.0351 |
0.0212 |
3.2945 |
162.3220 |
|
Cotton |
-0.5472 |
0.3186 |
0.0087 |
0.0876 |
0.2658 |
3.6772 |
11.4871 |
|
Urea |
-0.4321 |
0.6601 |
0.0026 |
0.0384 |
2.1215 |
19.3069 |
135.4322 |
|
Interest rate |
-0.3578 |
0.4988 |
0.3315 |
0.4505 |
-0.0389 |
3.6681 |
203.0517 |
|
Exchange rate |
-1.5979 |
1.9661 |
0.0029 |
0.3289 |
0.4195 |
6.1752 |
58.5120 |
|
CV |
1% |
5% |
10% |
||||
|
J-B |
9.21 |
5.99 |
4.61 |
|
Kwiatkowski Phillips Schmidt Shin (KPSS) |
||||
|
Log level |
Log first difference |
|||
|
With constant |
With constant and trend |
With constant |
With constant and trend |
|
|
Tea |
4.9914 |
1.6551 |
0.1926 |
0.0075 |
|
Rice |
7.2182 |
2.0217 |
0.0631 |
0.0248 |
|
Barley |
10.2413 |
1.6019 |
0.0443 |
0.0219 |
|
Beef |
6.7497 |
3.1783 |
0.2013 |
0.0347 |
|
Poultry |
14.1397 |
1.1892 |
0.0356 |
0.0316 |
|
Sugar |
6.7193 |
2.9385 |
0.0417 |
0.0255 |
|
Lamb |
9.6815 |
2.0311 |
0.1416 |
0.1479 |
|
Oil |
11.7894 |
3.2715 |
0.1574 |
0.1275 |
|
Wheat |
7.8388 |
1.8589 |
0.1035 |
0.0281 |
|
Cotton |
1.3215 |
1.0059 |
0.0694 |
0.0338 |
|
Urea |
9.1099 |
1.6748 |
0.0590 |
0.0311 |
|
Interest rate |
1.6678 |
0.5948 |
0.0096 |
0.0831 |
|
Exchange rate |
16.2071 |
1.5994 |
0.1647 |
0.0740 |
|
Critical Value |
1% |
5% |
10% |
|
|
With constant |
0.739 |
0.463 |
0.347 |
|
|
With constant and trend |
0.216 |
0.146 |
0.119 |
|
Note: All series are non-stationary at a level as well as stationary at the first difference, i.e., 1% critical values.
To test the conditional hetersoskedasticity, we employ the Lagrange Multiplier test on all selected food and agriculture commodities in the study. To check the conditional heteroskedasticity for further estimation of food and agriculture products, we employ the LM test that exhibits that squared residuals have an ARCH effect. Further, Ljung-Box-Pierce Q-Statistics and Q²-Statistics are used to find that either both residual as well as squared residual series have serial correlation or not. After finding the support for conditional hetersoskedasticity, now we can employ the GARCH models on selected commodities and find the results.
Results and Discussion
By using price returns, oil, urea, interest rate as well as exchange rate, we are going to try to investigate the effect of explanatory variables on these data series in this study. All these variables are going to be added in the variance equation if the residuals are square and level, to be added in the mean equation. Effect of all these varibales is estimated through GARCH(1,1) on food as well as agriculture commodities with normal-distribution and t-distribution.
The predicted significance of α1 including all commodities with explanatory variables are shown by the GARCH models except tea, wheat as well as beef. The other co-efficient i.e., β1 is high but close to 1, which shows that there is a strong significance for all included commodities in the study. It also shows that there is volatility persisted for a long duration after the shock. We also came to know that there are asymmetric effects in this study by observing another parameter i.e., γ1. We also observed that our model is negatively skewed for barley, beef as well as tea series by looking at the normality tests. On the otherhand side, we know that all other series are positively skewed. The value of excess kurtosis is very high for oil which indicates that the series is basically leptokurtic with an extreme value of higher probability and remaining all other commodities are platykurtic distributed. No specification error is demonstrated by applying LM-ARCH test. We also observe the non-normal distribution by employing the JB test for the stnadardized residuals. The Q and Q²-statistic btoh for squared residuals shows zero or minute sign of serial correlation plus volatility clustering, also no heteroskedastictiy based on diagnostic Test of Tse (2002).
The prices of lamb, barley as well as beef are to be positively plus significantly affected by oil prices as shown by the co-efficient present in the mean equation. Cotton prices are also affected by the volatility of oil prices, which is significant. We also observe in our study that wheat price is negatively significant due to the oil prices, which is considered as a significant input to be used for production. We also came to know that local market prices are very much affected by the international oil prices (Zhang et al., 2010). In other words, we can say that although prices are affected by inetrnational prices in case of Pakistan for local prices, all these changes not even minutely affect the production directly here. Howeever, we can say that cost of food for processing, its distribution as well as the cost of transportation is indirectly affected. In case of Pakistan, we also say that high input cost, which inlcudes the cost of tube well and tractor in harvesting leads to increase the food prices plus prices of agriculutral products. All the results of this study are consistent for wheat, rice and poultry, as well as they, found the relationship of wheat with international prices of oil as negative in case of Pakistan (Ali et al., 2012). The main reason for this is due to the instability of the government and also the inconsistent economic policies, which are the main reason for the general rise in the price in our economy. Even sometimes, in the case of Pakistan, we observed that no reduction in prices even internationally, still we observe the decrease in oil prices (Azeem et al., 2012).
In this study, we come to know that the results of mean equation are positively plus significantly affected by the prices of barley and wheat. But they donot affect any other commodity due to volatility of prices in Pakistan. Interest rate has significant as well as a negative impact on prices of beef as well as poultry. We also observe the strong positive evidence for the effect of current price with past price for all the commodities in Pakistan included in this study except the prices of oil. A high value of GARCH and volatiltiy analysis, we come to know that current prices depends upon past values as well as their effect is of long duration.
Conclusions and Recommendations
In this study, GARCH models are used by taking data ranging from June 1983 to June 2018 to investigate the unpredictability of food as well as agriculture commodities in Pakistan. Findings of our study concludes that the mean prices of beef, lamb as well as barley are significantly plus positively affected by the oil prices in case of Pakistan. We also come to know that in this study, significantly the oil volatility is negatively affected by the volatility of wheat prices. As well as the oil volatility positively affected the cotton prices volatility. From these results, we conclude that in Pakistan, most of the food and agriculture commodity prices by international oil prices. Here we concluded that the exchange rate has positive as well as significant effect on the mean prices of barley plus wheat. Still, it does not affect explicitly the volatilities of any other commodity that is included in this study. If we look at the impact of interest rate in this study, we come to know that it has a negative impact on both poultry as well as beef prices. On the other hand, side, it has significant as well as a positive impact on the mean prices of wheat, but the interest rate volatility negatively impacts the beef prices. In the end, we found that price volatility significantly impacts the current prices of all commodities except oil plus cotton to be included in the study for Pakistan.
For future recommendations, we have to motivate those hedging instruments to be used for the reduction of price volatility by our farmers. In countries like Pakistan, the uncertainty of weather, rains and floods affect most of the time, crops production. Also, delayed shipments of imported oil plus low stock of grains leads to an increase in local prices with-in our country. Our government must focus on how to control the volatile prices of food as well as agriculutral commodities because it directly affects the low-income group. The government also give attention to sustain the volatility of agriculture sector by involving individual institutions that leads to increase GDP. The subsidy provided by the government on food sector inputs as well as on agriculture sector leads to reduce the price of food in the market as well as help the small producers plus attain the general equilibrium level in the market. Developing countries like Pakistan need to create flexible prices as well as to increase investment in the agriculture sector. It will definitely lead to boost the growth not only to meet the increased desire of food for a growing population. Also leads to control the food prices in the market.
Novelty Statement
Novelty of this study is to find how to measure the volatility of food and agriculture prices in Pakistan? As well as also the persistence changes in the volatility of different series. Also, how volatility in one commodity price effect the other one series.
Author’s Contribution
Wajid Habib: Conducted research, designed methodology, data analysis.
Saira Rasul: Interpretation of results and wrote draft of the manuscript.
Hafiza Sadaf Zahra: Helped in literature review and also in data.
Conflict of interest
The authors have declared no conflict of interest.
References
Abbott, P.C., C. Hurt and W.E. Tyner. 2008. What’s driving food prices? Farm foundation issue report.
Abdullah, M. and K. Rukhsana. 2012. Empirical analysis of food price inflation in Pakistan. World Appl. Sci. J., 16(7): 933-939.
Ali, S.A., M. Ramzam, M. Razi and A.G. Bhatti. 2012. The impact of oil prices on food inflation in Pakistan. Interdisciplin. J. Contemp. Res. Bus., 3(11): 123-140.
Atkin, D. 2013. Trade, tastes, and nutrition in India. Am. Econ. Rev., 103(5): 1629-1663. https://doi.org/10.1257/aer.103.5.1629
Azeem, M.M., S. Munawwar and K. Mushtaq. 2012. An empirical analysis of factors affecting food (wheat) inflation in Pakistan. Pak. J. Agric. Sci., 49(2): 199-203.
Balcombe, K. 2009. The nature and determinants of volatility in agricultural prices: An empirical study from 1962-2008. Proceedings from FAO Workshop. November, 2009.
Broyden, C.G.,1970. The convergence of a class of double-rank minimization algorithms 1 general considerations. IMA J. Appl. Math., 6(1): 76-90. https://doi.org/10.1093/imamat/6.1.76
Cashin, P. and C.J. McDermott. 2002. The long-run behavior of commodity prices: Small trends and big variability. IMF Staff Papers, 49: 175-199.
Choudhry, T. 1996. Stock market volatility and the crash of 1987: Evidence from six emerging markets. J. Int. Money Finance, 15(6): 969-981. https://doi.org/10.1016/S0261-5606(96)00036-8
Cooke, B. and M. Robles. 2009. Recent food price movements: A time series analysis. IFPRI Discussion Paper.
Cornelisse, P.A., B. Kuijpers and A. Salam. 1987. A policy model of the wheat and rice economy of Pakistan. Pak. Dev. Rev., pp. 385-400. https://doi.org/10.30541/v26i4pp.385-400
Deaton, A. and G. Laroque. 1992. Estimating the commodity price model. (INSEE, Ed.) Paris: Research program in development studies, Princeton University.
Gilbert, C.L. and C.W. Morgan. 2010a. Has food price volatility risen? Pdf Available at: http://ideas.repec.org/p/trn/utwpde/1002.html, Accessed on April 2010.
Gilbert, C.L. and C.W. Morgan. 2010b. Food price volatility. Philos. Trans. R. Soc. B Biol. Sci., 365(1554): 3023-3034. https://doi.org/10.1098/rstb.2010.0139
Gilbert, C.L. 2006. Trends and volatility in agricultural commodity prices. In: D.A. Sarris and D. Hallam. Agricultural commodity market and trade: New approaches to analyzing market structure and instability. Edward Elgar Publishing limited.
FAO-OECD. 2011. Agricultural Outlook 2011–2020. OECD Publishing, Paris.
Huchet-Bourdon, M. 2011. Agricultural commodity price volatility: An overview. OECD Food, Agric. Fish. Working Papers No.52.
Hye, Q.M. and M.M. Siddiqui. 2010. Money supply, exchange rate, industrial and agricultural product prices: Evidence from Pakistan. Afr. J. Agric. Res., 2(22): 2997-3002.
Hye, Q.M., S. Malik and M. Mashkoor. 2010. Government expenditure, agricultural product prices and agricultural growth: A case of Pakistan. Middle East. Finance Econ., ISSN: 1450-2889 (7).
Kemal, M.A., I. Zainab and A. Henna. 2011. The determinants of food prices: A case study of Pakistan. PIDE-Working Paper, pp. 76.
Mitchell, D. 2008. A note on rising food price. Policy Research Working Paper. https://doi.org/10.1596/1813-9450-4682
Roache, S.K. 2010. What explains the rise in food price volatility? IMF Working Paper, pp. 1-29. https://doi.org/10.5089/9781455201129.001
Sumner, D.A. 2009. Recent commodity price movements in historical perspective. Am. J. Agric. Econ., 91(5): 1250-1256. https://doi.org/10.1111/j.1467-8276.2009.01292.x
Tse, Y.K. 2002. Residual-based diagnostics for conditional heteroscedasticity models. Econ. J., 5(2): 358-374. https://doi.org/10.1111/1368-423X.t01-1-00088
Zhang, Z., L. Lohr, C. Escalante and M. Wetzstein. 2010. Ethanol, corn, and soybean price relations in a volatile vehicle-fuels market. Energies, 2(2): 320-339. https://doi.org/10.3390/en20200320
To share on other social networks, click on any share button. What are these?


