Identification of Precipitation Zones within Indus River Basin (Pakistan) by Global Wavelet Power Spectra


Research Article
Identification of Precipitation Zones within Indus River Basin (Pakistan) by Global Wavelet Power Spectra
Kamran Zakaria1*, Noreen Munawar1 and Shafqat Ejaz2
1Department of Mathematics, NED University of Engineering and Technology, Karachi, Pakistan; 2Department of Civil Engineering, NED University of Engineering and Technology, Karachi, Pakistan.
Abstract | Water plays same role to earth as oxygen to body. In order to safe this Globe from droughts and floods, it is essential to design a strategy for the balanced usage of water resources for urban uses and agriculture. For such purpose, Precipitation regions were recognized in river Indus basin in Pakistan by examining the rainfall frequencies with the help of global wavelet power spectra. Records from 52 rain gauges were studied and the outcomes of the whole power spectra exhibited a low annual frequency all over the basin; whereas additional frequencies are present with major significance that indicate changes in the rainfall system. While, the calculated global wavelet power spectra showed variable frequencies, they presentedodd patterns (symbolized by A and B) that might be used to portray the region. Therefore, three sub-regions with consistentprecipitation patterns were recognized as: Region A (not apparent) and Region B (south and north part of the basin) and Transition zone (central portion of basin), having both the frequencies are identified.
Received | September 11, 2018; Accepted | November 20, 2018; Published | December 25, 2018
*Correspondence | Kamran Zakaria, Department of Mathematics, NED University of Engineering and Technology, Karachi, Pakistan; Email: zakariakamran@gmail.com, kamranza@neduet.edu.pk
Citation | Zakaria, K., Munawar, N. and Ejaz, S., 2018. Identification of precipitation zones within Indus river basin (Pakistan) by global wavelet power spectra. Journal of Innovative Sciences, 4(2): 130-135.
DOI | http://dx.doi.org/10.17582/journal.jis/2018/4.2.130.135
Keywords | Wavelet, Rainfall data, Time series
1. Introduction
Water is that natural resource which was thought to be used as long as their exist life on Earth but we run out of it very soon if we keep on using it in a way that we are doing now. Uncontrolled use of it can generate infinite social, economic and political damages.
Due to economic development and over population, the demand for water resources is continually increasing in the country. We, with the limited resources, can think of the methodologies that can aid in the application of policies for proper use of this resource together for human and agricultural purposes. This needs an understanding of the hydrological phenomena in the main regions, and a detachment of the regions into hydrological alike sub-regions that could be valuable for various outputs to be achieved.
In order to find homogenous rainfall regions, a lot of studies have been made up till now. For example,Archer and Fowler (2005) and Tahir et al. (2011) in lightened the Karakoram and Himalayas region by recording about its monsoon dynamics and also determinates the pattern of rainfall over the Himalayas. The regional climate model was used by Akhtar et al. (2008) that observed an increase up to 16% in annual mean rainfall by the end of 21 century (2071-2100), Diolaiuti and Bocchiola (2013) founded decreases precipitation over the Upper Indus basin and growing trends over northwest Karakoram and Chitral. Hydro-meteorological drifts in the UIB in Pakistan was analyze by M. ShehzadKhattak (2011) using mann-kendall test.
Heike Hartmann and Hilary Buchanan (2013) analyzed trends in extreme precipitation events in the River Indus Basin and flooding in Pakistan and concluded that Western part of the Basin observed decreasing trends in extreme precipitation and increasing trends in the very high mountains region. Future flood management plan need to consider an increasing trends in extreme precipitation.
Spatial analysis of precipitation over the UIB (2016) was analyzed by Yasir Latif, Ma Yaoming, concluded that declining precipitation dominated the Upper Indus basin both spatially and temporallycontainingthe high areas by using mann-kendall method.
In this work, the precipitation frequency over river Indus basin was analyzed with the use of“wavelet transform”. The technique can provide us with the frequency of signals and the time associated to those frequencies. Wavelet transform has wide applications in image processing too. Its usage has rapidly increased as substitute to the Fourier transform. It permits the study of different scales of temporal inconsistency without the stationary series. Hence, it is appropriate for analyzing irregularly distributed measures andtime series with non-stationary power of different frequencies. Wavelets, are now being used in many fields such as astronomy, nuclear engineering, neurophysiology, radar and pure mathematics; it is also used in geophysics applications, such as tropical convection, temperature variability. Lokenath Debnath presented his work on wavelet transform and its applications Nov, 1998. X Dong, in 2008, made the study on wavelets for agriculture and biology. Another research on an analysis and comparison of wavelet transform for Denoising was made in June 19, 2018, jean-Pierre Antoine wrote about wavelet transforms and their applications.
2. Methods and Materials
2.1 Site of the study area
The region of study is the Indus River basin. Its flow begins in the locality of Mansarovar Lake in the Tibetan Plateau (China) and covers the Ladakh region of Kashmir (India). Then it makes its path to the north leading to Gilgit-Baltistan. The river then Flows towards southcovering the complete length of the country (Pakistan)and fuse in the Arabian Sea nearbyKarachi in Sindh.
The river has an over-all drainage area exceeding 1,165,000 km2 (450,000 sq mi). Its estimated annual flow stands at around 243 km3 (58 cu mi), making it the twenty-first largest river in the world in terms of annual flow.
The Indus River is approximately 3,610 km (2,243 mi) long. Through a series of dams and canals, the Indus provides much of the irrigation and power for central Pakistan. It is 2,896km (1,800 miles) in length, having annual discharge of 6,600 m3/s. It is situated between 23059’40” N and 670 25’ 51 E.
2.2 Selected data
A total of 52 rain gauges were selected, based on their geographical distribution, with data from 1964 to 2016 provided by the Bureau of Statistics Planning and development department government of Sindh and Pakistan bureau of statistics. Due to the features of the wavelet transform, it is not essential for data to be from exactly the similar period. For decision-making
Processes, it is essential to regionalize an area Hydro logically. Decisions regarding agriculture, floods and droughts and hydroelectric power generation. Though, regionalization is complex because the rainfall, although within the same basin, can show different features, which are not easily measureable due to the resemblancein the hydrological system.
2.3 The wavelet transforms
Mathematical conversions are used on the original signals to find further hidden facts. Out of several transformations, the most popular one is Fourier transforms.
Wavelet decomposes or converts time series of one dimension into a tme series of two-dimensions(time-frequency) image which is in a diffused state. Thus, sustains frequency and time localization in a particular signal. In this way, we can find information about an amplitude of signals that are periodic, in the particular series and its variation with time. For such transformations, wavelet analysis uses basic waves, or mother wavelets.
Some examples of mother wavelets are the Paul and the derivative of Gaussian (DOG) wavelets, as shown in Figure 1 with their respective order (m), and the Morlet wavelet (Figure 2), which is, in practice, is the product of a Gaussian envelope and an exponential function which is complex:
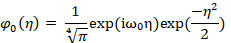
Here φ0 (η) is wavelet’s value when ω0 is the frequency (In this study, the value is 6) and time is η, (Figure 3). A new time series of the projection amplitude vs time can be constructed by sliding this wavelet along the time series. Lastly, by changing its width, the “scale” of the wavelet can be varied. Other associated physical characteristics describing all parameters and technical details can be viewed in the appropriate literature (e.g. Torrence and Compo, 1988).
3. Results and Discussion
3.1 Wavelet power spectrum
Because the present data is monthly distributed, the parameters include the start scale s0 = 2 months and time interval δt = 1 month, the width of the scale δj = 1/4, that generates four sub-octaves for each octave, and we have nine exponents of 2(2,4,8,16,32,64,128,256,and 512). For the study basin, the outcomes are alike to those in Figure 4. Figure 4(a) displays the raw datafor the rainfall. Figure 4(b) shows the power (absolute value squared) of the wavelet transform for the monthly rainfalls presented in Figure 4(a), which is a record from 1961 to 2016. Here, the Morlet wavelet was used, because more accurate frequency information is given by it when compared to other mother wavelets. Figure 4(b)presents the actual oscillation of the individual wavelet, not only its magnitude, but the power concentration can easily be identified in the frequency or time, i.e. an annual frequency along the entire time series (1961-2016). The variance of power in the 8- to 16- month band displays the wet and dry years; i.e. when the power increases in this band it represents a wet year, and when the power declines it means a dry year, as discussed by Santos et al. (2001, 2003) and Santos and Ideiao (2006).
3.2 Scale-average series of time
In a certain band of a time series, the average variance is called scale-average. It is a band of 8- to 16- month in the case of Figure 4(d). We use it to observe variation of one frequency by another in the same time series. The average of Figure 3(b) is shown in Figure 3 (d) over all scales from 23 to 24 months that provides average monthly variance vs time. For example, a period of wetness can be identified between 1961 and 1967 shadowed by a dry year until the start of 1985. Another decrease in power is found amidof 1995 and 2002 and that correspond a dry period shadowed by a rainy period till 2009.
3.3 The global wavelet power spectrum
An amalgamation of exponents over the time spectrum confirms the trend in time series, assumed red noise, represented by the dashed lines (Figure 3(c)). Numerous geophysical time series are modelled either as red noise or white noise. As per Torrance and compo (1998), autoregressive process univariate lag-1 is a simple layout of red noise, he correspondence between the time series and itself is lag-1 (a1), which is one time unit lagged. Here, it is a month’s shift.
The lag-1 calculates that there is a glitch between two months. If lag-1>0.4, it is recommended to compute the true lag-1 as a = (a1 + a2 1/2)/2, in which, a1 = autocorrelation lag-1, and a2 = autocorrelation lag-2, lagged by 2 months instead of 1 month. The series is modelled as white noise (a = 0) when a1 <0.4.
The wavelet power spectrum gets its null hypothesis which states that series under examination has mean power range; so assumption can be made about the true features along with certain percent confidence. “95% confidence level” is equivalent near “significance at the 5% level”, and implication of a test contrary to certain background level is made. While “95% confidence interval” refers to the range of confidence about a given value. The 95% confidence signifies that 5% of the wavelet power should be above this level (Torrence and compo 1998).
Aneutral and reliable estimation of the true power spectrum of the time series is provided by the global wavelet spectra. For example, it clearly differentiates one peak from another, indicating the presence of an annual frequency, however other rain gauges show two or more peaks, independent of which frequencies they are, shown in Figure 4(a) and (b). Following this correspondence, Global wavelet power spectra helped to identify two main patterns: 01 with one main annual frequency referred to as pattern A (e.g. Figure 5(a), (c)) and 51 with more than one main frequency referred to as Pattern B (e.g. Figure 5(d)-(f)).
From this result, three distinct hydrological zones (generally named here, Section A, Section B and Transition zone) were recognized, illustrated in Figure 6. Region A intends to show Pattern A, Region B shows frequency Pattern B and Transition regiondisplays frequency Patterns A and B. Frequency Pattern A signifies the presence of only an annual frequency and, therefore, the shape of its global wavelet spectrum is different from those of Pattern B. Smith et al. (1998) also characterized time series using such global spectra, because aneutral and reliable approximation of power spectrum is obtained with it.
Thus, the characterization of river Indus basin in Pakistan into three hydrological regions, based on rainfall frequency, could enable the implementation of plans that is benefited for the agriculture and misuse of water in affected vicinity.
Conclusions
It is possible to bring this discussion to an end that the wavelet transform is an active device in regionalizing any zone through precipitation as we done for the Indus river basin. Records from 52 rain gauges were analyzed. The outcomes of the global power spectra showed a low yearly frequency all over the basin; whereas additional frequencies exist in major impact that signifies changes in the precipitation regime. Through global wavelet power spectra, we found peculiar patterns of rainfall data that might be used to portray the region. Hence, three sub-regions with homogenous precipitation patterns were recognized as: Section A with frequency pattern A (not apparent), Section B with frequency pattern B (the south and north part of the basin), and a Transition zone in the central part. A neutral and reliable estimation of true power spectrum is obtained by means of global wavelet spectrum. This is considered as simple and robust way to portray the time series variability of Indus river basin. More studies are suggested with a largeramount of rain gauges together with more hydrological variables to depict the entire basin.
Author’s Contribution
The idea of research, calculations and plotting were completed by Kamran Zakaria. Noreen Munawar manipulated the whole text. Shafqat Ejaz provided the expert view of the paper.
References
Antoine, J.P., Bagarello, F. Gazeau, J.P. 2018. Springer coherent states and their applications: A contemporary Panorama. Springer International Publishing.
Boyce, M. 1989. A history of Zoroastrianism: The early period, BRILL, pp. 136–201, ISBN 90-04-08847-4.
Bailey, H.W. 1975. Indian Sindhu, Iranian Hindu- (Notes and Communications). Bulletin of the School of Oriental and African Studies, 38(3): 610–611.
Geography, 2017. The rivers of Pakistan. Dawn. September 29, 2009. Retrieved 15 August 2017.
Swain, A. 2004. Managing water conflict: Asia, Africa and the Middle East. Routledge. pp. 46. ISBN 1135768838.
Winston, Y., Yi-Chen, Y., Andre, S., Donald, A., Casey, B., James, W., Dario, D. and Sherman, R., The Indus Basin of Pakistan: The impacts of climate risks on water and agriculture. World bank publications. p. 59. ISBN 9780821398753.
Mountjoy, S. 2004. The Indus river. Infobase Publication. pp. 8, ISBN 978-1-4381-2003-4, Parpola 2015, Chapter 9.
Prasad, R.U.S. 2017. River and goddess worship in India: Changing perceptions and manifestations of Sarasvati. Taylor and Francis. pp. 23, ISBN 978-1-351-80655-8. https://doi.org/10.4324/9781315209401
Possehl, G.L. 1999. Indus age: The beginnings. University of Pennsylvania Press.
Thieme, P. 1970. Sanskrit sindu-/Sindhu- and Old Iranian hindu-/Hindu. in Mary Boyce; Ilya Gershevitch, W. B. Henning memorial volume, Lund Humphries, pp. 447–450.
Author’names...? Indus water flow data in to reservoirs of Pakistan. Retrieved 15 August 2017.
Holdich, T.H. 1911. “Indus” in Chisholm, Hugh. Encyclopædia Britannica. 14 (11th ed.). Cambridge University Press. pp. 507–508.
Williams, B. 2016. Daily life in the Indus valley civilization. Raintree. p. 6. ISBN 1406298573.
Yule, H. 1903. India, Indies. In: Hobson-Jobson: A glossary of colloquial Anglo-Indian words and phrases and of kindred terms, etymological, historical, geographical and discursive. Edited by Crooke, W., London, B.A. and Murray, J.
Clift, Gaedicke, Edwards, Lee, Hildebrand, Amjad, White and Schlüter. 2002. The stratigraphic evolution of the Indus Fan and the history of sedimentation in the Arabian Sea. Marine Geophysical Researches. 23 (3): 223–245. https://doi.org/10.1023/A:1023627123093
Clift, P.D. and J. Blusztajn. 2005. Reorganization of the western Himalayan river system after five million years ago. Nature. 438 (7070): 1001–1003. https://doi.org/10.1038/nature04379
Clift, P.D., N. Shimizu, G.D. Layne, J.S. Blusztajn, C. Gaedicke, H.U. Schlüter, M.K. Clark and S. Amjad. 2001. Development of the Indus fan and its significance for the erosional history of the western Himalaya and Karakoram. GSA Bulletin. 113 (8): 1039–1051. https://doi.org/10.1130/0016-7606(2001)113<1039:DOTIFA>2.0.CO;2
Zeitler, P.K., P.O. Koons, M.P. Bishop, C. Chamberlain, Page, D. Craw, M.A. Edwards, S. Hamidullah, Q.A. Jam, M.A. Kahn, M.U.K. Khattak, W.S.F. Kidd, R.L. Mackie, A.S. Meltzer, S.K. Park, A. Pecher, M.A. Poage, G. Sarker, D.A. Schneider, L. Seeber and J.F. Shroder. 2001. Crustal reworking at Nanga Parbat, Pakistan, Metamorphic consequences of thermal-mechanical coupling facilitated by erosion. Tectonics. 20 (5): 712–728. https://doi.org/10.1029/2000TC001243
Indus River (PDF). World top 10 rivers at risk. WWF. Archived from the original (PDF) on 25 May 2013. Retrieved 11 July 2012.
To share on other social networks, click on any share button. What are these?