
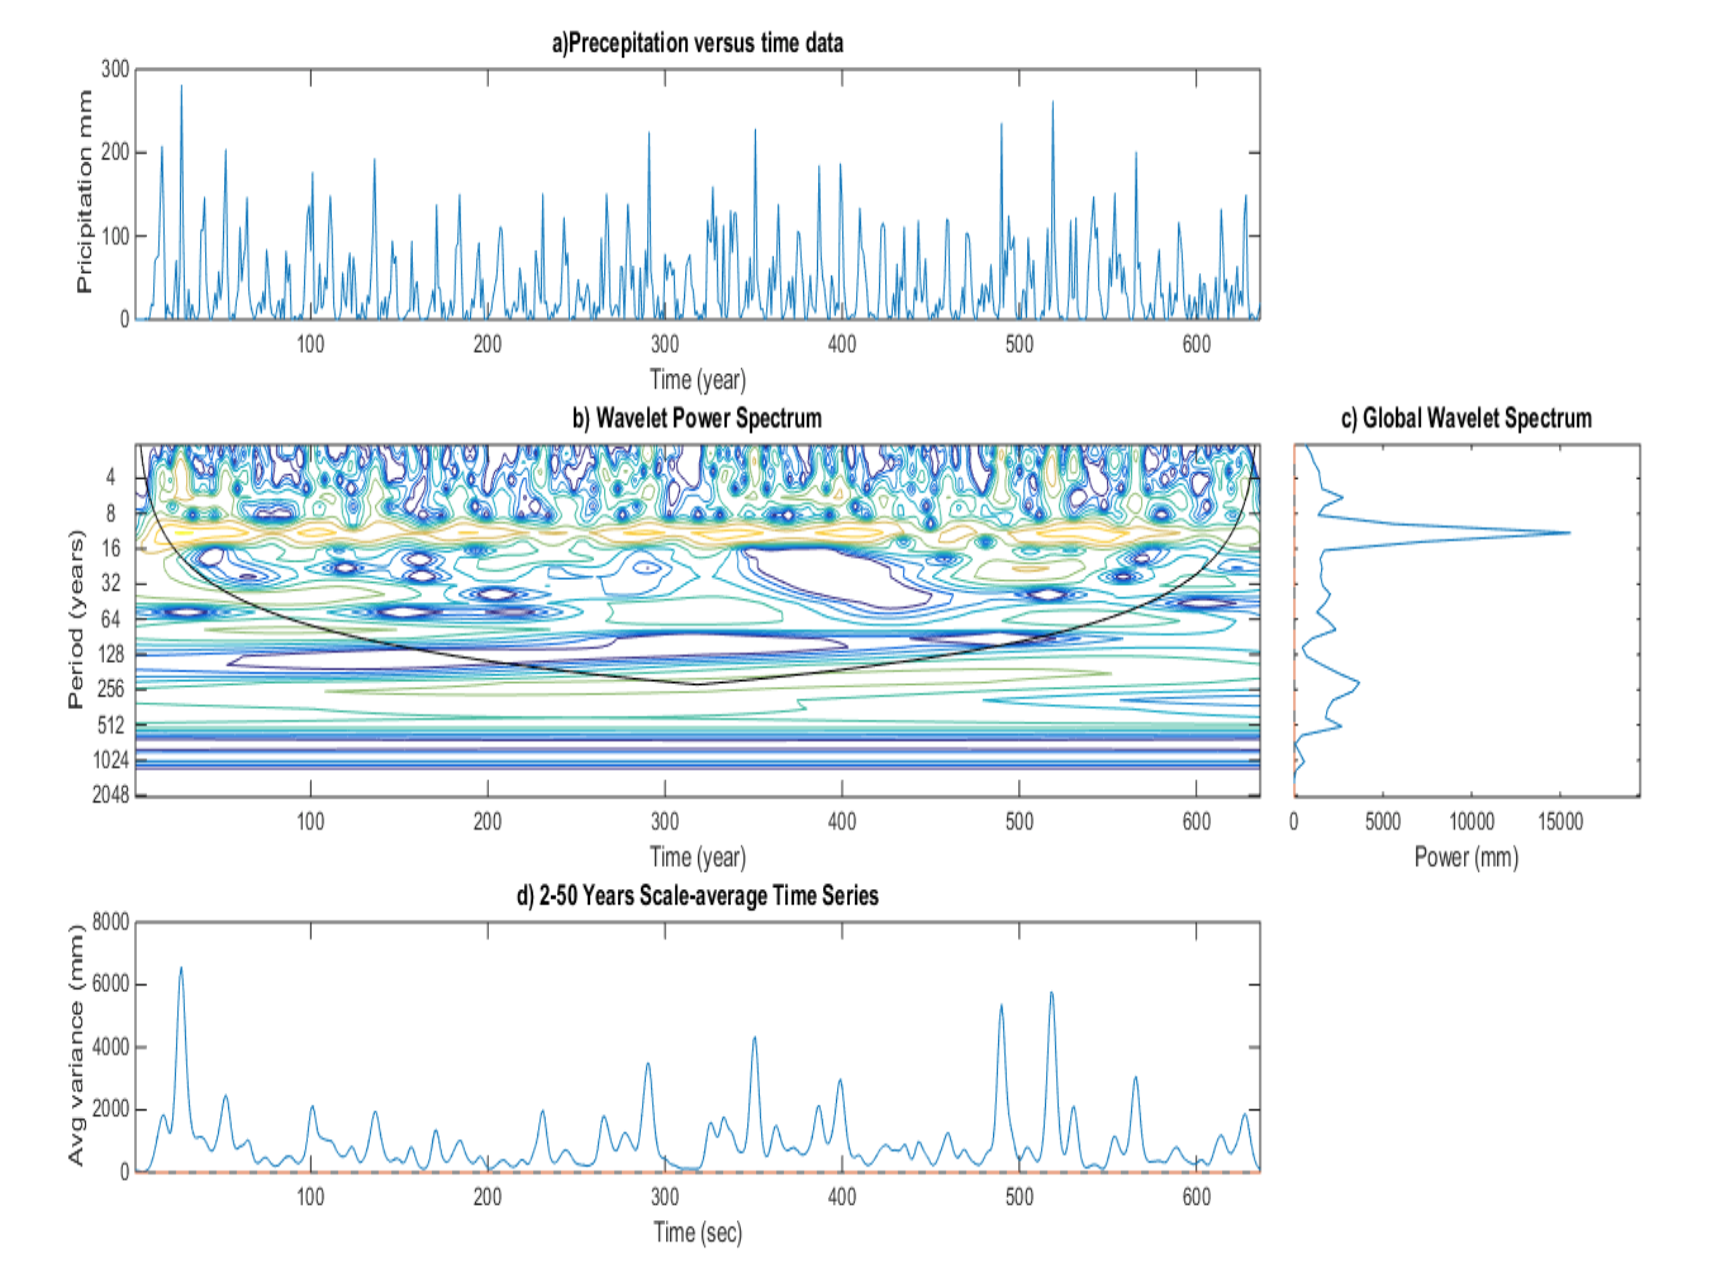
Figure 3:
(a) Monthly rainfall for the 1961-2016 period; (b): The wavelet power spectrum using Morlet mother wavelet. Here thick contour encloses regions of greater than 95% confidence for a red-noise process; (c): The global wavelet power spectrum. The dashed line is the 5% significance level, using a red-noise background spectrum; (d): showsscale-average wavelet power for 8- to 16- month bandand 5% significance level is indicated by a dashed line, supposing red noise.