
Genetic Variability, Heritability and Genetic Advance for Morphological Traits in F5:6 Rice Lines


Research Article
Genetic Variability, Heritability and Genetic Advance for Morphological Traits in F5:6 Rice Lines
Arshad Iqbal1*, Syed Mehar Ali Shah1, Hidayat ur Rahman1, Faiza Aman2 and Aziz-ur-Rahman1
1Department of Plant Breeding and Genetics; 2Department of Horticulture, The University of Agriculture, Peshawar, Khyber Pakhtunkhwa, Pakistan.
Abstract | This study was conducted to investigate variability, heritability and genetic advance among F5:6 lines of rice for various morphological traits. Thirty-eight lines derived from F5 rice cross combinations along with their 8 parents were planted in a randomized complete block design (RCB) having three replications at The University of Agriculture, Peshawar during 2016 rice crop growing season. Data were taken on some of the morphological traits like number of days to heading (days), number of days to maturity (days), flag leaf area (cm2), culm length (cm), panicle length (cm), primary branches panicle-1 (no.) and secondary panicle branches (no.). Analysis of variance showed highly significant (p ≤ 0.01) differences for parents, F5:6 lines and parents vs F5:6 lines for all the studied traits. Among the F5:6 lines, AUP-304 showed minimum days to heading (91 days) while the F5:6 line AUP-361 took minimum days to maturity (118 days). F5:6 line AUP-311 exhibited maximum flag leaf area (55 cm2) and maximum culm length (132.3 cm). Maximum panicle length (28.3 cm) among F5:6 lines was recorded for AUP-271, whereas, AUP-345 and AUP-322 showed best performance for primary panicle branches (13) and secondary panicle branches (41.3), respectively. High broad-sense heritability estimates were observed for all the studied characters, number of days to maturity (99.6%), culm length (99.4%), flag leaf area (98.9%), days to heading (95.9%), secondary branches panicle-1 (88.3%), panicle length (70.7%) and primary branches panicle-1 (60.6%), respectively. Genetic advance estimation showed that flag leaf area exhibited high genetic advance (40.2%) followed by secondary branches panicle-1 (36.6%) and culm length (31.4%) among studied traits of rice genotypes. On the basis of good performance for early maturity, area of flag leaf and panicle contributing traits like primary and secondary branches panicle-1 F5:6 lines AUP-361, AUP-311 and AUP-345, AUP-322 could be advanced further in multi-locations trials to develop new rice genotypes for local cultivation.
Received | January 08, 2018; Accepted | November 9, 2018; Published | November 23, 2018
*Correspondence | Arshad Iqbal, Department of Plant Breeding and Genetics, The University of Agriculture, Peshawar, Khyber Pakhtunkhwa, Pakistan; Email: [email protected]
Citation | Iqbal, A., S.M.A. Shah, H. Rahman, F. Aman and A. Rahman. 2018. Genetic variability, heritability and genetic advance for morphological traits in F5:6 rice lines. Sarhad Journal of Agriculture, 34(4): 888-895.
DOI | http://dx.doi.org/10.17582/journal.sja/2018/34.4.888.895
Keywords | F5:6 lines, Variability, Heritability, Genetic advance, Morphological traits
Introduction
Rice (Oryza sativa L.) is the chief staple food for one third of the world’s population. The genus Oryza belongs to the tribe Oryzeae of the family Poaceae. The genus Oryza contains 20 wild and two cultivated rice species. O. sativa is grown world-wide while O. glaberrima is planted in West African countries. Rice is the primary nutritional source for 17 nations in Asia and the Pacific, nine states in North and South America and 8 states in Africa. Globally rice was cultivated on an area of 161.8 million ha which gives the production of 494.4 million tons having an average yield of 3.05 tons ha-1 (FAOSTAT, 2016). The chief rice producing nations are: China, India, Indonesia, Bangladesh, Japan, United States of America, and Pakistan. China is the leading producer with the production of 142.3 million tons. On nutritional basis cultivated rice delivers 35-60% of their entire calorie intake to around 3.3 billion individuals in the Asia (Naseer et al., 2015). Morphologically rice is a monocot and is planted as an annual crop with round culms, flat leaves and terminal panicle. Roots are fibrous, possessing rootlets and root hairs. Association of arrangement between flower-pattern and the timing of floret receptiveness create O. sativa largely auto-gamous and self-pollinated. However, there is still some chances of out-crossing in rice. Pakistan’s ranks third among the main crop in positions of the area sown, after wheat and cotton while it ranks second amongst the staple food grain crop. Rice provides 3.2% of the cost adding in agriculture and 0.7% of Gross domesticated products. In Pakistan, rice is cultivated on an area of 2.8 million ha, which gives the production of 6.8 million tons ha (PBS, 2016). In the province of Punjab, rice is cultivated on area of 2.03 million ha which gives the average production of 4.13 million tons. In Khyber-Pakhtunkhwa rice area under cultivation is 0.07 million ha-1 giving the production of 0.15 million tons (FBS, 2015-16).
The presence of genetic variation for morphological characters in segregating generations is important for identification and formation of desirable genotypes. Breeders have the choice of choosing appropriate genotypes in early generations of selection or postponing intense-selection till advanced generations as soon as progenies are become closely homozygous. Better information of the genetic planning of numerous genotypes is therefore essential to articulate an effective breeding procedure.
Heritability is the percentage of genotypic variation to the total (phenotypic) variance, which comprises both genetic and environmental variance. The heritability of the character estimates the extent to which it is expected to transfer next generation and is more valuable tool when used in combination with estimation of expected genetic advance. Genetic advance is the enhancement in the mean phenotypic value of the selected plants over the parental population. Genetic advance gives evidence on expected gain resultant from selection of higher individuals. Estimation of heritability along with genetic advance combination are useful in predicating the gain under selection than heritability alone (Ogunbayo et al., 2004). Keeping in view the significance of above facts, an experiment was conducted with the following objectives; i) To evaluate genetic variability among the genotypes for morphological traits. ii) To, estimate heritability and genetic advance in F5:6 rice lines derived from different cross combinations and iii) To identify the superior F5:6 lines for morphological traits for further use in rice breeding programs.
Materials and Methods
This study was conducted to assess genetic variability among F5:6 rice lines for morphological traits at Plant Breeding and Genetics Research Farm, The University of Agriculture, Peshawar during 2016 rice crop growing season. Thirty-eight lines derived from F5 rice cross combinations along with their eight parents were used in this study. Single plant selection has been made from F2 – F5 generations and the seed of the selected plants have been bulked to raise the next generation (Table 1). Nursery was grown in the May 1st week while the transplantation of seedlings into well-puddled field was done, during the first week of June 2016. Field management of the crop were made through recommended cultural practices. Parental genotypes along with their F5:6 populations were planted in a completely randomized block design with three replications. Every genotype of rice was planted in a four-rows/plot, with a row-length of 3 m, whereas row-to-row and plant-to-plant spacing will be retained as 30 and 15 cm respectively.
Data were documented on the some of the following morphological characters, using ten randomly selected plants in each entry as per IRRI descriptor. Number of days to heading was calculated by totaling the days from seeding to the date when 50% tillers of each particular plant in each entry produced panicles. Flag leaf area was measured for every genotype, by multiplying length of leaf and width of leaf with the correction factor (0.75) with the procedure of Francis et al. (1969). Culm length was measured in centimeters starting from earth surface to the base of the panicle near maturity by using meter rod. Number of days to maturity was calculated by including the number of days from date of sowing to the date when most of the 80 percent of the grains on panicles were ripened. Panicle length was calculated in centimeters from the bottom to the tip of the panicle without awns. Primary branches panicle-1 and secondary panicle branches were counted after complete bloom of panicles on five randomly selected plants for each entry.
Table 1: The genetic material used in this study.
| Parental genotypes | F5:6 Lines | Cross combinations |
| 1. Basmati-2008 | 1. AUP-262 |
1. Basmati-6129/Basmati-370 |
| 2. Kangni-27 | 2. AUP-263 | |
| 3. TN-1 | 3. AUP-264 | |
| 4. Basmati-370 | 4. AUP-271 | 2. Basmati-6129/Dokri-Basmati |
| 5. Basmati-6129 | 5. AUP-274 | |
| 6. Dilrosh | 6. AUP-282 |
3. Basmati-2008/Kashmir-Basmati |
| 7.Kashmir-Basmati | 7. AUP-285 | |
| 8. Dokri-Basmati | 8. AUP-292 |
4. Basmati-2008/TN-1
|
| 9. AUP-294 | ||
| 10. AUP-295 | ||
| 11. AUP-302 | 5. Basmati-2008/Dilrosh | |
| 12. AUP-304 | ||
| 13. AUP-305 | ||
| 14. AUP-311 |
6. Dokri-Basmati/Basmati-6129 |
|
| 15. AUP-312 | ||
| 16. AUP-315 | ||
| 17. AUP-321 |
7. Dilrosh/ Kashmir-Basmati |
|
| 18. AUP-322 | ||
| 19. AUP-325 | ||
| 20. AUP-335 | 8. Kashmir-Basmati/Dilrosh | |
| 21. AUP-341 |
9. Dilrosh/TN-1
|
|
| 22. AUP-342 | ||
| 23. AUP-343 | ||
| 24. AUP-345 | ||
| 25. AUP-351 |
10. Kashmir-Basmati/TN-1
|
|
| 26. AUP-352 | ||
| 27. AUP-354 | ||
| 28. AUP-355 | ||
| 29. AUP-361 |
11. TN-1/Kashmir-Basmati |
|
| 30. AUP-362 | ||
| 31. AUP-364 | ||
| 32. AUP-365 | ||
| 33. AUP-373 |
12. Kangni/Kashmir-Basmati |
|
| 34. AUP-374 | ||
| 35. AUP-381 |
13. Kashmir-Basmati/Kangni
|
|
| 36. AUP-382 | ||
| 37. AUP-383 | ||
| 38. AUP-385 |
Statistical analysis
Data were analyzed according to analysis of variance procedure as defined by Singh and Chaudhary (1985) for the parents and F5:6 lines derived from the parental lines (Table 1). Least-Significant-Difference (LSD) test was estimated for means partition and appropriate association.
Heritability estimation
Genetic and environmental-variances and heritability estimation from the mean squares in ANOVA for each parameter were estimated according to Singh and Chaudhary (1979).


 Broad sense heritability (h2bs) on entry mean basis was calculated as:
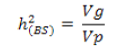
Vp: Phenotypic variance for a particular trait; (h2 bs): Broad sense heritability for a particular trait; Vg: Genetic variance.
Genetic advance
Genetic advance was computed using the following method of Panse and Sukhatme (1965).

Where; GA: Genetic advance; K: 1.76 (10 percent selection-intensity).

H2: broad-sense heritability for a particulate trait.
Genetic advance was calculated as percent of mean via the following formula;
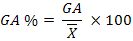
Where; X: the mean of specific F5:6 lines for a particular trait.
Results and Discussion
Days to 50% heading
Inherent enhancement of rice following breeding methods may help to achieve self-sufficiency in rice through the development of high yielding cultivars. Some of the traits like early heading assures the breeder to get sufficient yield and short duration varieties by receiving appropriate duration for grain development. Analysis of variance displayed highly significant (p < 0.01) differences among the parents, F5:6 lines and parents vs F5:6 lines were observed for days to heading (Table 2). These results are supported by the findings of Bitew (2016) and Tiwari (2015). Bitew (2016) evaluated 22 genotypes for yield attributing traits and detected significant differences for number of days to heading. Among the parents, mean values for days to heading varied from 78-94.6 days. Basmati-2008 took minimum days (78) to heading while maximum days (94.6) were recorded for Kangni-27. Among the F5:6 lines, mean values varied from 90.6 to 103 days. AUP-304 showed minimum days to heading (90.6) while maximum days (103) were recorded for AUP-274 (Table 3). Heritability is important for selection-based improvement as it specifies the degree of transmissibility of a character into upcoming generations. Genetic advance provides clear representation and accurate opinion of segregating generations for promising selection. High broad -sense heritability of 95.9% having genetic advance of 8.3% was recorded among the studied traits of rice genotypes (Table 4). Corazon et al. (2015) assessed 48 rice genotypes for yield and yield associated traits and recorded high heritability (91.3%) for days to heading.
Table 2: Mean squares for various morphological traits of rice genotypes at Peshawar during 2016.
| Traits | Replications | Genotypes | Parents | F5:6Lines | P vs F5:6 | Error |
| Df | 2 | 45 | 7 | 37 | 1 | 90 |
| Days to heading |
4.24** |
61.73** |
94.9** |
18.6** |
1421** |
0.85 |
| Days to maturity |
1.27** |
243.4** |
226.4** |
101.8** |
5598** |
0.27 |
| Flag leaf area |
4.16** |
227.3** |
82.5** |
258.8** |
77.7** |
82.8 |
| Culm length |
10.8** |
1052** |
579.8** |
1157** |
482.5** |
1.93 |
| Panicle length |
1.78NS |
13.3** |
22.5** |
11.6** |
10.97** |
1.61 |
|
Primary branches panicle-1 |
2.11* |
3.81** |
4.7** |
2.6** |
38.69** |
0.68 |
|
Secondary branches panicle-1 |
9.38NS |
105.9** |
67.6** |
113.1** |
107.9** |
6.61 |
*, ** = Significant at 0.05 and 0.01 levels of probability, NS = Non significant.
Days to maturity
Early maturing rice genotypes are highly focused throughout the world by plant breeders in current climatic conditions. For the adaptability of rice to different environments and geographical regions, maturity trait is considered as a critical parameter. Statistical analysis showed highly significant (p ≤ 0.01) differences among the parents, F5:6 lines and parents vs F5:6 lines for this trait (Table 2). Similar results have been reported by Corozon et al. (2015) for days to maturity. They assessed 48 rice genotypes for morphological traits and observed significant differences for days to maturity. Among the parents mean values ranges between 99 and 120 days. Basmati-370 took minimum days to maturity (99) while maximum days (120) were recorded for Kangni-27. Among F5:6 lines, the mean values range from 118 to 134 days. AUP-361 showed minimum days (118) to maturity while AUP-322 showed maximum days (134) to maturity (Table 3). High broad-sense heritability of 99.6% and genetic advance of 12.8% was observed among studied traits of rice genotypes (Table 4). Results are similar with the findings of Bitew (2016) for the said trait.
Flag leaf area
Flag leaf area contributes major role in determining the yield potential of cereal crops and contribute mainly to the filling of grains, since flag leaf area deliveries photosynthetic foodstuffs primarily to the panicle. The genotypes displayed highly significant (p ≤ 0.01) differences for parents, F5:6 lines and parents vs F5:6 were observed for flag leaf area (Table 2). Similar results have been reported by Devi et al. (2016) and Naseem et al. (2014) who also reported highly significant difference for flag leaf area. Among the parental genotypes, mean values ranges from 31 to 46.0 cm2. Basmati-2008 exhibited minimum flag leaf area (31) while maximum flag leaf area (46.0) was recorded for Dilrosh. Among the F5:6 lines the mean values ranged from 19.8 to 55 cm2. AUP-364 showed minimum flag leaf area (19.8 cm2) while maximum flag leaf area (55 cm2) was observed for AUP-311 (Table 3). High broad-sense heritability of 98.9% and genetic advance of 40.2% was recorded for flag leaf area (Table 4). Similar results of high heritability and genetic advance for flag leaf area were described by Devi et al. (2016) and Gangashetty et al. (2013).
Culm length
Culm is the connected stem of rice and is made-up of sequences of nodes and internode which contribute towards numbers of panicles density. Mean squares exhibited highly significant (p ≤ 0.01) differences among parents, F5:6 lines and parents vs F6 lines for culm length. Highly significant results for culm length are analogous to the outcomes of Lingaiah (2015) and
Table 3: Means for days to heading, days to maturity and flag leaf area, culm length, panicle length, primary branches and secondary branches panicle-1 of rice genotypes at Peshawar during 2016.
| Genotypes | Days to heading | Days to maturity | Flag leaf area (cm2) | Calmlength (cm) | Panicle length (cm) | Primary branches panicle-1 | Secondary branches panicle-1 |
| Parents | |||||||
| Basmati-2008 | 78 | 100 | 31 | 99.6 | 27.7 | 8.7 | 21.2 |
| Kangni-27 | 94 | 120 | 33.3 | 112.7 | 27.3 | 9.6 | 31.1 |
| TN-1 | 91 | 120 | 37.3 | 115.2 | 29.9 | 9.3 | 20.2 |
| Basmati-370 | 83 | 99 | 43.2 | 89.5 | 22.0 | 6.5 | 18.9 |
| Basmati-6129 | 82 | 106 | 40.6 | 103.1 | 27.4 | 10.9 | 28.2 |
| Dilrosh | 88 | 102 | 46.0 | 108.5 | 26.7 | 9.4 | 17.3 |
| Kashmiri-Basmati | 91 | 116 | 43.8 | 104.5 | 25.2 | 9.6 | 25.0 |
| Dokri-Basmati | 88 | 112 | 39.9 | 73 | 22.4 | 8.7 | 24.3 |
|
F6 Lines |
|||||||
| AUP-262 | 95 | 131 | 31.3 | 104.3 | 28.1 | 10.47 | 25.0 |
| AUP-263 | 95 | 131 | 37.8 | 110.4 | 26.8 | 9.4 | 19.7 |
| AUP-264 | 94 | 132 | 36.4 | 111.6 | 27.5 | 10.2 | 31.8 |
| AUP-271 | 101 | 132 | 44.2 | 122.7 | 28.3 | 10.8 | 30.4 |
| AUP-274 | 103 | 133 | 46.8 | 120.4 | 26.9 | 11.0 | 39.6 |
| AUP-282 | 93 | 123 | 40.8 | 109.5 | 25.5 | 9.8 | 22.6 |
| AUP-285 | 94 | 123 | 37.0 | 121.2 | 26.6 | 10.2 | 23.8 |
| AUP-292 | 94 | 127 | 33.2 | 109.4 | 24.3 | 9.8 | 20.1 |
| AUP-294 | 94 | 126 | 38.4 | 112.3 | 23.7 | 9.8 | 26.1 |
| AUP-295 | 94 | 126 | 39.0 | 121.5 | 24.3 | 10.0 | 30.1 |
| AUP-302 | 91 | 122 | 35.6 | 112.2 | 25.4 | 11.0 | 32.8 |
| AUP-304 | 91 | 122 | 36.2 | 102.2 | 25.3 | 9.5 | 23.7 |
| AUP-305 | 91 | 121 | 32.9 | 116.6 | 24.0 | 10.4 | 26.4 |
| AUP-311 | 93 | 133 | 55.0 | 132.3 | 27.2 | 9.8 | 24.5 |
| AUP-312 | 97 | 133 | 52.9 | 128.3 | 27.6 | 11.1 | 24.8 |
| AUP-315 | 97 | 133 | 54.2 | 127.4 | 27.0 | 11.0 | 32.4 |
| AUP-321 | 92 | 133 | 39.7 | 120.1 | 27.0 | 10.5 | 29.3 |
| AUP-322 | 92 | 134 | 45.2 | 118.7 | 27.2 | 10.9 | 41.3 |
| AUP-325 | 91 | 132 | 45.0 | 119.7 | 24.5 | 10.0 | 29.1 |
| AUP-335 | 93 | 121 | 42.9 | 113 | 23.9 | 9.2 | 29.3 |
| AUP-341 | 95 | 119 | 24.7 | 83.4 | 24.3 | 1 1.4 | 18.1 |
| AUP-342 | 96 | 118 | 23.5 | 82.6 | 25.0 | 11.4 | 17.1 |
| AUP-343 | 96 | 119 | 25.7 | 77.3 | 23.9 | 11.6 | 19.4 |
| AUP-345 | 96 | 120 | 28.7 | 84.4 | 26.3 | 13.0 | 24.8 |
| AUP-351 | 97 | 125 | 37.5 | 94.8 | 26.3 | 12.2 | 34.8 |
| AUP-352 | 97 | 125 | 34.7 | 95.2 | 26.3 | 10.6 | 25.4 |
| AUP-354 | 97 | 123 | 29.3 | 98.7 | 26.5 | 11.2 | 29.8 |
| AUP-355 | 97 | 124 | 30.7 | 97.8 | 26.9 | 11.0 | 30.9 |
| AUP-361 | 94 | 118 | 25.3 | 63.6 | 22.8 | 11.8 | 19.6 |
| AUP-362 | 94 | 118 | 23.9 | 63.8 | 22.2 | 10.8 | 19.2 |
| AUP-364 | 95 | 119 | 19.8 | 62.2 | 20.6 | 10.7 | 15.7 |
| AUP-365 | 95 | 120 | 23.8 | 64.6 | 20.4 | 11.0 | 14.1 |
| AUP-373 | 94 | 120 | 43.0 | 122.6 | 23.4 | 9.0 | 23.9 |
| AUP-374 | 93 | 121 | 41.8 | 123.6 | 22.2 | 8.2 | 20.7 |
| AUP-381 | 94 | 133 | 49.7 | 111.4 | 25.8 | 9.6 | 25.4 |
| AUP-382 | 95 | 133 | 52.1 | 110.4 | 26.9 | 10.6 | 25.6 |
| AUP-383 | 94 | 133 | 40.5 | 109.0 | 26.0 | 9.4 | 22.3 |
| AUP-385 | 95 | 133 | 43.0 | 121.4 | 25.9 | 9.5 | 23.6 |
| Genotype Means LSD (0.05) |
93.2 1.4 |
123.3 0.83 |
37.7 1.54 |
104.4 2.2 |
25.5 2.1 |
10.2 1.3 |
25.2 4.1 |
| Parental Means LSD (0.05) |
86.2 1.7 |
109.4 0.99 |
39.4 1.84 |
100.3 2.68 |
26.1 2.4 |
9.1 1.5 |
23.3 4.9 |
|
F6 Line Means LSD (0.05) |
94.7 1.5 |
126.2 0.85 |
37.4 1.57 |
105.3 2.2 |
25.3 2.1 |
10.5 1.3 |
25.6 4.2 |
and Idris and Mohammad (2013). They also reported highly significant differences for this trait (Table 2). Among the parental genotypes, mean values varied from 73 to 115.2 cm. Dokri-Basmati manifested minimum culm length (73 cm) while maximum culm length (115.2 cm) was recorded for TN-1. Among the F5:6 lines mean values ranged from 62.2 to 132.3 cm. Minimum culm length (62.2 cm) was observed for AUP-364 while maximum culm length (132.3 cm) was recorded for AUP-311 (Table 3). Culm length exhibited high broad-sense heritability of 99.4% and genetic advance of 31.4% among studied traits of rice genotypes (Table 4). Das (2015), Lingaiah (2015) and Tiwari (2015) also reported high heritability and genetic-advance for culm length.
Table 4: Broad-sense heritability (h2) and genetic advance of rice genotypes studied at Peshawar during 2016.
| Parameters | Heritability (h2 BS) | Genetic advance (%) |
| Days to heading | 95.9 | 8.3 |
| Days to maturity | 99.6 | 12.8 |
| Flag leaf area | 98.8 | 40.2 |
| Culm length | 99.4 | 31.4 |
| Panicle length | 70.7 | 11.4 |
|
Primary branches panicle-1 |
60.6 | 13.6 |
|
Secondary branches panicle-1 |
88.3 | 36.6 |
Panicle length
The terminal component of the rice tiller is an inflorescence called the panicle. Longer panicle will bear increased number of spikelets resulting in enhanced grain yield. Highly significant (p ≤ 0.01) differences were recorded among parents, F5:6 lines and parents vs F5:6 for panicle length (Table 2). Similar results for panicle length are supported to the findings of Das (2015) and Jambhukar and Bose (2014). Among the parental geotypes mean values ranges between 22.4 and 29.9 cm. Basmati-370 showed minimum (22.4 cm) panicle length while maximum panicle length (29.9 cm) was recorded for TN-1. Among F5:6 lines, mean data ranged from 20.4 to 28.3 cm. AUP-365 showed minimum panicle length (20.4 cm) while maximum was recorded for AUP-271 (28.3 cm) (Table 3). High broad-sense heritability of 70.7% and genetic advance of 11.4% was recorded for panicle length (Table 4). High heritability estimates for panicle length are supported by the findings of Servan et al. (2012) and Rafii et al. (2014).
Primary branches panicle-1
Number of primary panicle branches are the furthermost imperative yield attributing components concerning high yield in rice, more the number of primary branches more will be the number of grains. Analysis of variance displayed highly significant (p < 0.01) differences among the parents, F5:6 lines and parents vs F5:6 lines for primary branches panicle-1 (Table 2). Yadav et al. (2014) also reported significant differences for primary branches panicle-1. Among the parental genotypes, mean values ranged from 6.5 to 10.9 primary branches panicle-1. Basmati-370 took minimum number of branches (6.5) while maximum number of primary branches (10.9) were recorded for Basmati-6129. Among the F5:6 lines, mean values varied from 8.2 to 13 primary branches panicle-1. AUP-374 exhibited minimum number of primary branches (8.2) while maximum number of primary branches (13) was recorded for AUP-345 (Table 3). High broad-sense heritability of 60.6% and genetic advance of 13.6% was recorded among the studied traits of rice genotypes (Table 4). Similar results have been reported by Ketan and Sarkar (2014). They observed high heritability of 70% among the rice genotypes for primary branches panicle-1.
Secondary branches panicle-1
Secondary branches panicle-1 is important yield contributing trait resulting more number of grains which turn increase the yield in rice crop. Statistical analysis revealed highly significant (p ≤ 0.01) differences among parents, F5:6 lines and parents vs F5:6 for secondary branches panicle-1 (Table 2). Ketan and Sarkar (2014) also reported similar results. Among the parental genotypes, mean values ranged from 17.3 to 31.1 branches panicle-1. Minimum number of secondary branches (17.3) was recorded for Dilrosh while maximum number of secondary branches panicle-1 (31.1) was recorded by Kangni-27. Among F5:6 lines, mean values ranged from 14 to 41.3 branches panicle-1. AUP-365 exhibited minimum number of secondary branches panicle-1 (14) while maximum number of secondary branches panicle-1 (41.3) was recorded for AUP-322 (Table 3). High broad-sense heritability of 88.3% and genetic advance of 36.6% was recorded for secondary branches panicle-1 (Table 4) Ketan and Sarkar (2014) and Sanghera et al. (2013) also observed high heritability and genetic advance values for secondary branches panicle-1.
Conclusions and Recommendations
Highly significant differences among the parents, F5:6 lines and parents vs F5:6 lines were observed for all the studied characters. Among the F5:6 lines, early heading and early maturity was recorded for AUP-304 and AUP-361 respectively. AUP-345 showed highest number of primary branches panicle-1 while AUP-322 showed highest number of secondary branches panicle-1. High broad-sense heritability with moderate to high genetic advance was observed for entirely study traits. On the basis of good performance for maturity and yield related traits, F5:6 lines AUP-361 and AUP-345 are recommended for further evaluation in replicated yield trials across locations.
Author’s Contribution
Arshad Iqbal and Aziz-ur-Rahman: Collected and analysed the data and wrote the manuscript.
Syed Mehar Ali Shah: Provision of the genetic material, wrote the manuscript and guided in research.
Hidayat ur Rahman: Interpreted the data, wrote the manuscript and guided in research
Faiza Aman: Reviewed the literature, analysed the data and wrote the manuscript.
References
Baloch, M.J., E. Baloch and W.A. Jatoi. 2013. Correlations and heritability estimates of yield and yield attributing traits in wheat (Triticum aestivum L.). Pak. J. Agric. Eng. Vet. Sci. 29(2): 96-105.
Bitew, J.M. 2016. Estimation of genetic parameters, heritability and genetic advance for yield related traits in upland rice (Oryza sativa L. and Oryza glaberrima steud) genotypes in Northwester Ethopia. World Sci. News. 47(2): 340-350.
Corazon, F., E. Pacquiao and E.V. Aguinaldo. 2105. Genetic variation and heritability of yield related traits in promising rice genotypes (Oryza sativa L.). Int. J. Plant Breed. Genet. Vol. 2(3): 105-110.
Das, S. 2015. Genetic studies of yield variation in mid duration irrigated rice. ISOR, J. Agric. Vet. Sci. Vol. 8(3): 41-43.
Devi, K.R., K. Parimala, V. Venkanna, N. Lingaiah, Y. Hari and B.S. Chandra. 2016. Estimation of variability for grain yield and quality traits in rice (Oryza sativa L.). Intl. J. Pure Appl. Biosci. Vol. 4(2): 250-255. https://doi.org/10.18782/2320-7051.2245
FAOSTAT. 2016. Available at http://faostat.fao.org. (Accessed on January 01, 2017)
FBS. 2016. In: Agriculture Statistics of Pakistan 2015-16. Ministry of Food and Agriculture, Federal Bureau of Statistics. Govt. Pak. Islamabad.
Francis, C.A., J.N. Rutger and A.F.E. Palmer. 1969. A rapid method for plant leaf area estimation in maize (Zea mays L.). Crop Sci. 9(5): 537-539. https://doi.org/10.2135/cropsci1969.0011183X000900050005x
Gangashetty, P.I., P.M. Salimath and N.G. Hanamaratti. 2013. Genetic variability studied in genetically diverse non-basmati local aromatic genotypes of rice (Oryza sativa L.). Rice Genomics and Genetics. 4(2): 4-8.
Hayes, H.K., R.I. Forrest and D.C. Smith. 1955. Methods of plant correlation and regression in relation to plant breeding. Hill Inch. 2(1): 439-457.
Idris, A.E. and K.A. Mohamed. 2013. Estimation of genetic variability and correlation for grain yield components in rice (Oryza sativa L.). Glob. J. Plant Ecophsiol. 3(1): 1-6.
Jambhulkar, N.N. and L.K. Bose. 2014. Genetic variability and association of yield attributing traits with grain yield in upland rice. J. Plant. Breed. Genet. 46(3): 831-838. https://doi.org/10.2298/GENSR1403831J
Ketan, R. and G. Sarkar. 2014. Studies on variability, heritability, genetic advance and path analysis in some indigenous aman rice (Oryza sativa L.). J. Crop Weed, Vol. 10(2): 308-315.
Lingaiah, N. 2015. Genetic variability, heritability and genetic advance in rice. Asian J. Environ. Sci. 10(1): 110-112. https://doi.org/10.15740/HAS/AJES/10.1/110-112
Naseem, I., A.S. Khan and M. Akhter. 2014. Correlation and path coefficient studied of some yield related traits in rice (Oryza sativa L.). Int. J. Sci. Res. 4: 2250-3153.
Naseer, S., M. Kashif, H.M. Ahmad, M.S. Iqbal and Q. Ali. 2015. Estimation of genetic association among yield contributing traits in aromatic and non-aromatic rice (Oryza sativa L.) cultivars. Life Sci. J. 12(4): 68-73.
Ogunbayo, S.A., D.K. Ojo, K.A. Sanni, M.G. Akinwale, M.G. Toulou, B. Shittu, A. Idehen, E.O. Popoola, A.R. Daniel and G.B. Gregoria. 2014. Genetic variation and heritability of yield and related traits in promising rice genotypes. J. Plant Breed. Crop Sci. 6(1): 153-159.
Panse, V.G. and P.V. Sukhatme. 1965. Statistical methods for agriculture workers. Indian Council of Agric. Res. New Delhi: 381.
PBS. 2016. In: Agriculture Statistics of Pakistan 2015-16. Ministry of Food and Agriculture, Pak. Bureau Stat. GoP. Islamabad.
Raffi, M.Y., M.Z. Zakiah, R. Asfaliza, M.D. Iffahhaifaa, M.A. Latif and M.A. Malek. 2014. Grain quality performance and heritability estimation in selected F1 rice genotypes. Sains Malaysiana. 43(1): 1-7.
Sanghera, G.S., C. Subhash, Kashyap and G.A. Parray. 2013. Genetic variation for grain yield and related traits in temperate red rice (Oryza sativa L.) Ecotypes. Not Sci. Biol. 5(3): 400-406. https://doi.org/10.15835/nsb539088
Sarvan, T., N.R. Rangare, B.G Suresh and S. Ramesh kumar. 2012. Genetic variability and character association in rainfed upland rice (Oryza sativa L.), J. Rice Res. 5(1).
Singh, R.K. and B.D. Chaudhary. 1985. Biometrical methods in quantitative genetic analysis. Kalyani Publishers, N. Delhi, India.
S.U. Ajmal, N. Zakir and M.Y. Mujahid. 2009. Estimation of genetic parameters and character association in wheat. Jr. of Agric. and Bio. Sci. 1: 15-18.
Tiwari, G.C. 2015. Variability, heritability and genetic advance analysis for grain yield in rice. Int. J. Eng. Res. Appl. Vol. 5(4): 46-49.
Yadav, S.K., P. Pandey, B. Kumar and B.G. Suresh. 2011. Genetic architecture, inter-relationship and selection criteria for yield improvement in rice (Oryza sativa L.). Pak. J. Biol. Sci. Vol. 14(9): 540-545. https://doi.org/10.3923/pjbs.2011.540.545
To share on other social networks, click on any share button. What are these?


