
Gender Inequality in Schooling among Children and the Implications for Livelihood of Farming Households in Kwara State, Nigeria


Research Article
Gender Inequality in Schooling among Children and the Implications for Livelihood of Farming Households in Kwara State, Nigeria
Raphael Olanrewaju Babatunde, Adeyemi Esther Omoniwa and Miriam Ukemenam
Department of Agricultural Economics and Farm Management, University of Ilorin, Ilorin, Nigeria.
Abstract | Despite several investments programmes by the Nigerian Government and development institutions over the years to bridge the gender gap in schooling among children and increase enrolment in schools, most children are still found outside the walls of the classroom especially in rural areas. This research assessed how inequality in gender as it regards schooling among children affects the income as an indicator of livelihood of farming households in Kwara state, Nigeria. A sampling technique comprising of three stages was used to randomly select 200 farming households in the study area. Data were collected using questionnaire and were analyzed using the Gini-coefficient and the Ordinary Least Square method. The result showed an overall gini-coefficient for gender inequality in schooling of 0.35, with the value for boys and girls at 0.35 and 0.49 respectively. Mother’s education, age of the household heads, marital status, dependency ratio, farm size and the average time spent by the children on the farm were found to significantly influence children’s access to schooling. While increase in schooling cost, average years of schooling of the children affects the farm income. It was thus recommended that parents should be sensitized on the future benefits of sending their children to school. More so, credits should be made more accessible to farming households. This might help in the establishment of mechanized farm system thus reducing the need for manual labour and improving the children’s opportunities of schooling.
Received | Febraury 13, 2016; Accepted | August 11, 2018; Published | September 10, 2018
*Correspondence | Raphael Olanrewaju Babatund, Department of Agricultural Economics and Farm Management, University of Ilorin, Ilorin, Nigeria; Email: esteromotade@yahoo.ca
Citation | Babatunde, R.O., A.E. Omoniwa and M.Ukemenam. 2018. Gender inequality in schooling among children and the implications for livelihood of farming households in Kwara State, Nigeria. Sarhad Journal of Agriculture, 34(3): 662-670.
DOI | http://dx.doi.org/10.17582/journal.sja/2018/34.3.662.670
Keywords | Inequality, Gender, Schooling, Asset and Income
Introduction
Education is widely acknowledged to be of immense benefit to individuals thereby promoting national development. It is one of the key indices of sustainable development as it helps in improving a person’s productive capacity and reduces some adverse attributes of life. These include prolonged child labour and empowerment of rural dwellers (FAO and UNESCO, 2003). Gender as an important factor shapes the expectations of a person particularly children as well as how they are treated. Thus education should not be gender biased but aimed at empowering both girls and boys to face life challenges (European Commission, 2010). The occurrence of gender disparities in education amongst children in the rural areas has attracted the attention of researchers over time. Therefore, this article sought to assess the extent of gender inequality in schooling amongst children and its effect on the income accruable to the households of farmers in Kwara state, Nigeria. According to USAID (2008), educating female and male children alike has the capacity of producing same increases in their later income while expanding their choices and future opportunities. However, educating girls has been found to produce even additional benefits to the society as a whole. These include increase in the rate of work completion and subsequently incomes as well as improved survival rates for infants and health outcomes of children.
One of the Sustainable Development Goals (SDGs) that was recently adopted by the United Nations is the mandate to put an end to all forms of inequality (UNDS, 2015) one of which is gender inequality in schooling. This might be as a result of a report by UNESCO (2008) which stated that despite several reports of steady improvements in recent years, many countries are still greatly affected. In 2005, out of 181 countries only 59 had achieved gender equality with an index of between 0.97 and 1.03 in the gross enrolment rates (GER) for both primary and secondary education. A lot of those that have made reasonable progress are those in those in the developed world and those in transition. While for those in sub-Saharan part of Africa, the situation is still threatening with rather little progress. The female GER in countries such as Afghanistan, Pakistan and Yemen as at 2008 was about 80% of the male GER (World Bank, 2011).
Inequality has been referred to as the measure with which the allocation of basic facilities generated within an economy is shared among its residents (Society for International Development, 2004). Inequality in schooling therefore, can be said to be the limit to which distribution of education and the gains derived therewith are to the advantage of specific group of people within an economy (Mulongo, 2013). According Burkam et al. (2002), a gap in education is created when schools serving students from poor households do not often receive adequate resources and thus face greater difficulties attracting qualified teachers. It can be said therefore that gender equality; that is both females and males having equal access to all the levels (primary, secondary and tertiary) of education is yet to be achieved.
However, the rapid growth in population particularly in Nigeria over the last decade has put serious strain on the available resources within the country. The burden of education particularly has become quite great as children below 15 years represent 45% of the populace. Some reports also have it that 40% of children of at most 11 years in Northern Nigeria do not attend primary school most of which are girls (NCF, 2012). Also UNICEF (2005) have a report with an estimate of about 4.7 million children who are still out of school.
In Nigeria, several programmes have been put in place with the aim of improving access to education thereby reducing the level of inequality presently in favour of the male-folks. An example of such programme according to Igbinedion (2011) is the Universal Primary Education (UPE) which was put in place in the year 1977. The scope was however extended to non-formal sector in 1992 and particularly to track equity (UNESCO, 1998). Another is the Universal Basic Education (UBE) introduced in September 1999. The objective of this particular one included the provision of free education for every child of school age regardless of the child’s gender. However, ascertaining whether these initiatives are meeting or have met their target goals requires more empirical evidence.
It is common knowledge that most children from farming households are absent from school mainly because they are needed to help with work either home or on the farm thereby providing extra cash to the respective families. This can be credited to the fact that some of these households do not have the where withal to pay the other charges associated with school enrolment. These include the cost of notebooks, textbooks, foot wares and uniforms among others. For others, it is the cost of transportation since most rural communities have the distance to the nearest school as a major barrier (Sinclair and Trah, 1991). Another cause of inequality in schooling, especially in the Northern Nigeria is cultural bias such that even those who are enrolled do not finish the primary stage (Fakrogha, 2014). According to UNICEF (2008), it was reported that 30% of pupils enrolled drop out at the primary school level and only about 54% proceed to the junior secondary level. Some of the reasons for this are child marriage for the girls, economic difficulties by various families and in other cases it is child labour. The situation cannot be said to be too different in Kwara state which has also recorded low girls’ enrolment when compared to the boys with an estimated 48.6% girls’ enrolment compared to 51.4% boys’ enrolment in primary school. For secondary school, enrolment was 45.6% for girls compared to 54.4% for boys in 2006 (NBS, 2010). This depicts the most recent information on the prevalence of gender inequality in schooling available for Kwara state. Thus there is need to investigate more on the current trend of inequality in schooling among children of farming households.
Also, the World Development Report of 2012 also have it that gender equality has the capacity to improving the productive ability of this present generation as well as the resultant effect of those in the future. Most economists and international development agencies are of the view that educating girls will not only enhance their wellbeing but also promote sustainable growth and development of the entire nation (Glewwe and Kremer, 2006).
Several literatures including that of Morrison, Raju and Sinha (2007) have concluded that ensuring that the girl-child have access to and can afford quality education is good economics. This they attributed to the fact that it improves the efficiency, enhances growth rate and helps to reduce social inequality. Also, Akanbi (2012) in another study concluded that the slow progress made regarding gender gap might be attributed to practices emanating from the culture of gender preference. More so, the tradition of patriarchal inheritance has left some families wishing never to have a girl-child as she is regarded as a minor.
Materials and Methods
Study area
The study was conducted in Kwara state, Nigeria. Kwara state a population stands at 2.4 million people comprising 70% peasant farmers (KWSG, 2006). It was selected based on the report which placed the state as the sixth poorest in Nigeria (LSMS, 2004). Also the state is known to have a poor level of education which invariably affects the wellbeing of rural households in the state (NPC, 2008). According to agro-ecological features, the state is divided into four. Zones A, B, C and D.
Educational description of kwara state
Kwara State comprises several ethnic groups occupying both rural and urban settlements. Like Nigeria, it has the burden of educationally disadvantaged groups among which are some local government areas, the girl-child and possibly boy-child groups too. There are over 220 public secondary schools, over 1000 primary schools, three colleges of education, one polytechnic under the management of the state government (Ijaiya, 2004). In the Kwara state educational system, there is the primary education cycle of six years, junior and senior secondary cycles of three years each and the tertiary cycle of 3 to 4 years.
According to the Core Welfare Indicators Questionnaires (CWIQ) Survey carried out in 2006, gender youth literacy showed that more male (87.8%) were literate than their female counterpart (71.7%). It stated that about 84% of primary school children in the state had access to schooling with those in the urban areas (95.3%) having more access than those in the rural areas (77.7%). Also, the primary school net enrolment in the state was 78.6% with the urban areas contributing the largest (82.4%) and the rural areas contributing 76.4%.
Data collection and sampling techniques
A multistage sampling technique comprising of three stages was used to randomly select 200 households from which primary data was collected through the use of a standard questionnaire and one-on-one discussions where necessary. In the first stage, there was a random selection of two (2) out of the 16 local government areas present in the state. In the second, five (5) communities were randomly selected from the selected local government areas, to give 10 selected communities. In the final stage, it was the random selection twenty (20) households from each of the communities to give 200 farming households.
Tools of analysis
The data collected was analysed using the Gini Coefficient, Ordinary Least Square (OLS) Regression and the Cobb-Douglas function and Semi-Log function.
Descriptive statistics
Descriptive statistics using percentages and frequency Table was used to analyze the socio-economic characteristics of the respondents sampled for this study. The descriptive statistics is a statistical technique that summarizes or describes a set of data.
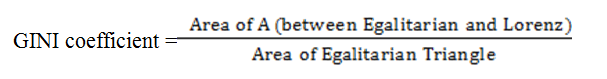
Gini coefficient
The Gini coefficient is often used as a measure inequality in distributions of various indicators of development. It ranges from 0 which represents perfect equality to 1 perfect inequality. Gini coefficient for inequality in schooling can be calculated using enrolment or attainment data. For this study, the indicator is the average years of schooling for the boy-child and the girl-child respectively. The mathematical representation is given as
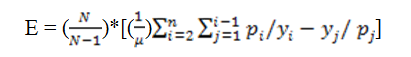
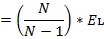
Where,
E = the coefficient based on how the educational attainment was distributed; EL = the coefficient based on how the educational attainment was distributed for large samples; μ= mean years of schooling for the sampled population; Pi and Pj = the fractions of population with specific years of schooling; yi and yj= years of schooling at the different educational levels attained so far; N is the total number of individuals in the sampled population. n = number of levels in attainment data, for this study n is equal to 7.
The formula for calculating the years of schooling at the seven levels of education:
Illiterate: y1= 0
Partial-Primary: y2= y1 + 0.5Cp = 0.5Cp
Complete-Primary: y3= y1 + Cp = Cp
Partial-Secondary: y4 = y3 + 0.5Cs = Cp + 0.5Cs
Complete-Secondary: y5= y3 + Cs = Cp + Cs
Partial-Tertiary: y6= y5 + 0.5Ct = Cp + Cs + 0.5Ct
Complete-Tertiary: y7= y5 + Ct =Cp+ Cs + Ct
Where,
Cp is the cycle of the primary education (6 years); Cs is the cycle of the secondary education (6 years); and
Ct is the cycle of the tertiary education (4 years).
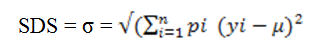
The Average Years of Schooling (AYS) and the Standard Deviation of Schooling (SDS) are calculated using the respective formulae below:

Ordinary least square
To identify the factors that determine children’s access to education among farming households the Ordinary Least Square Analysis was employed. The OLS regression model is given as
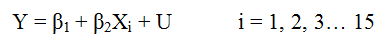
Where;
Y =Average years of schooling of both male and female children in the household; β = vector of unknown coefficients.
The predictors are:
X1 = Age of Household head (years);X2 = Marital status (1= Married, 0 = otherwise);X3= Religion; X4= Household size (Adult Equivalent); X5= Dependency ratio; X6= Household Asset index; X7= Years of schooling of the father; X8= Years of schooling of the Mother; X9= Primary occupation of household head (Farming =1, 0 otherwise); X10= Cost of schooling (Naira); X11= Average hours spent by children in farm work (per week); X12= Distance to school (Km); X13= Household monthly per capita income (Naira); X14Farm size (hectares); X15= Secondary occupation of household heads; U= Error term.
The household asset index was constructed using the Principal Component Analysis (PCA). The components are derived from variance and correlation of variables of the household assets. These were then used to explain the variability that exists between the variables extracted and rotated into minimal components. From each of the component loadings, the variable with the highest communality was picked to represent the components. Therefore 11 variables were selected based on this criterion to represent the 11 principal components extracted; television, floor, hoe, generator, building, goats, carpet, and fan, grinding machine, cutlass and mattress. These components make up the household asset index. So also, the dependency ratio was calculated as the number of dependents (any child who is less than 15 years old and any adult who is greater than 65 years old) to the working population (anyone from 15 to 65 years old) within a household.
The effect of children’s schooling on the livelihood using household income as the indicator was estimated also with the OLS model. Three major forms of household income were considered in this study namely total income, farm income and off-farm income. Two major functional forms of the model namely Cobb-Douglas and the Semi-log forms were used. For total income and farm income, Cobb-Douglas function was used, since all households reported non-zero income values for these two categories. For off-farm income, semi-log model was used because some households recorded zero income values.
The total household income was derived from different sources such as farming and off-farm activities. The farm income constitutes about 30% of the total income which may be due to the poor agricultural season experienced by the farmers. The remaining 70% of the total income are gotten from off-farm activities (in which 60% of the households engage in). These off-farm activities include trading, transportation crafts, fishing, and hunting and remittance income among others. Household incomes are used for various purposes in the house among which are expenses on consumption (either food or non-food), investments (tangible or non-tangible) and savings. Since education make up a part of the expenses from income, it is likely to have either a direct or indirect effect on the household income. The estimation of this is given in the Table 2. The implicit form is specified as:
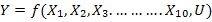
Where;
Y = Total Household Income, Farm Income and Off-farm Income respectively.
The predictors are defined as follows:
X1= Age of Household head (years); X2= Household size (Adult Equivalent); X3= Years of schooling of the Household head; X4= Primary occupation of household head (Farming =1, 0 otherwise); X5= Cost of schooling (Naira); X6= Average hours spent by children in farm work (per week); X7= Farm size (hectares); X8= Value of Household Assets (N); X9= Farming Experience (Years); X10= Children’s average years of schooling; U= Error term.
Results and Discussion
Socioeconomic characteristics
Table 1 shows the descriptive statistics summary of respondent characteristics. The table shows that the average age of the household heads was 46years while that of the children was 12 years. The mean years of schooling for the household heads was 8 years while that of the mothers was estimated to be 4 years of schooling. This goes to show that even among parents with regards to gender there exists some degree of inequality in education. This implies that although on the average both male and female are literates, the male are more schooled than the female. For the children, the average years of schooling was 8 years, with the male children having an average of 7 years and the female 6 years. Although the figure for the children seems like an improvement from those of their parents, there is still a gap that needs to be bridged. The average monetary value of household assets was estimated at N552,689.90 with an average household size of 5 in adult equivalence. This is not too different from national average as put forward by National Bureau of Statistics (2006). Also, the average income was N8,803.82 for the households.
Table 1: Summary of statistics of Socio-economic characteristics.
| Characteristics | Mean | Standard deviation |
| Age of household heads (years) | 46.03 | 12.43 |
| Education of household heads (years) | 7.86 | 5.55 |
| Education of mothers (years) | 3.70 | 4.27 |
| Household size (AE) | 4.83 | 1.73790 |
| Household assets (Naira) | 552689.90 | 453672.00 |
| Household per capita income (Naira) | 8803.82 | 4353.92 |
| Household total expenditure (Naira) | 6,911.81 | 3006.47 |
| Age of children (years) | 12.02 | |
| Education of children (years) | 8.16 | |
| Education of boys (years) | 6.64 | |
| Education of girls (years) | 5.63 |
Source: Data Analysis, 2014; Note: The household characteristics were gotten from the 200 sampled households while the children characteristics were gotten from 1,028 children resident within the 200 households that were sampled.
Table 2: Gini decomposition of schooling inequality by gender.
| Gender | Average schooling (years) | Gini coefficient |
| Boys | 6.64 | 0.3546 |
| Girls | 5.63 | 0.4925 |
| Total | 8.15 | 0.3179 |
Source: Data Analysis, 2014.
Gender inequality in schooling among children
The Gini coefficient was used to measure the level of inequality in the average years of schooling. It was used to calculate the schooling gini coefficient for boys and girls respectively, these coefficients were then compared to determine the level of gender inequality in schooling among the children. The results are given Table 2. Table 2 presents the details of Gini decomposition for the children resident within the 200 household that were sampled. The overall gender inequality in schooling is 0.3545, for boys the value is 0.3528 while for girls the value is 0.4900. Comparing the values for boys and girls, it is evident that the value for girls is closer to 1
Table 3: Factors determining access to schooling among children using OLS regression (N=200).
| Variables | Total average schooling years | Boys average schooling years | Girls average schooling years |
| Age of household head (years) | 0.200***(6.31) | 0.126***(6.67) | 0.074*** (3.23) |
| Marital status (Married =1. 0, otherwise) | 2.332** (2.05) | 1.379**(2.03) | 0.953 (1.17) |
| Religion | 1.670 (1.55) | 0.198 (0.31) | 1.472* (1.90) |
| Household size (Adult Equivalent) | 1.221***(4.86) | 0.304** (2.02) | 0.918*** (5.08) |
| Household asset index | -0.431(-0.33) | 0.775 (0.99) | -1.206 (-1.28) |
| Dependency ratio | -0.900**(-2.25) | -0.392(-1.64) | -0.508*(-1.77) |
| Farm size(hectares) | -0.167*(-1.92) | -0.105**(-2.02) | -0.062(-1.00) |
| Years of Schooling of Household head | 0.137*(0.169) | -0.013(-0.28) | 0.151***(2.59) |
| Years of schooling of the mother | 0.069* (1.730) | 0.031(0.54) | 0.127(0.19) |
|
Primary occupation of household head (Farming =1, 0 otherwise) |
-0.431 (-0.33) | 0.409 (0.60) | -1.436* (-1.74) |
|
Secondary occupation of household head (Farming =1, 0 otherwise) |
-0.900** (-2.25) | 0.110 (0.97) | 0.101 (0.74) |
| Cost of schooling (naira) | -0.167* (-1.92) | 4.541E-06 (1.18) | 2.980E-06 (0.64) |
| Mean children farm hours | 0.137* (0.169) | -0.014**(-2.10) | -0.014* (-1.74) |
| Distance to school (Km) | 0.069*(1.730) | 0.032 (0.98) | -1.012 (-0.32) |
| Household per capita income (naira) | -0.431(-0.33) | -1.123E-04** (-2.09) | -1.191E-05(-0.18) |
| Constant | -0.900**(-2.25) | -7.617*(-1.72) | 1.659(0.31) |
|
R2 |
-0.167* | 0.434 | 0.315 |
| F | (-1.92) | 11.11 | 7.07 |
Source: Data Analysis, 2014; Note: *, **, *** Coefficients are significant at the 10%, 5%, and 1% level, respectively. The dependent variable is the average years of schooling for all children, only boys and girls only respectively.
Table 4: Effect of children schooling on household income (N=200).
| Variables | Total income | Farm income | Off-farm income |
| Cobb-Douglas function | Cobb-Douglas function | Semi-Log function | |
| Age of household head (years) | -0.297* (-1.80) | 0.277(1.18) | -26170.66(-0.54) |
| Household size (AE) | -0.562*** (-5.26) | -0.799***(-5.27) | -64842.65**(-2.08) |
| Household Assets (naira) | 9.36E-08*** (3.56) | 5.83E-08 (1.56) | 0.018693**(2.43) |
| Years of schooling of household head | 0.000 (0.06) | 0.005(1.53) | -441.1164(-0.60) |
| Farm size (hectares) | 0.046 (0.82) | 0.313***(3.95) | -21259.9(-1.31) |
| Farming experience (years) | 0.046 (0.69) | -0.062(-0.66) | 7530.494(0.39) |
| Primary occupation of household head (Farming =1, 0 otherwise) |
0.099***(2.64)
|
-0.242***(-4.53) | 64014.97***(5.81) |
| Cost of schooling (naira) | 0.099** (2.09) | 0.150**(2.22) | -4878.11(-0.35) |
| Mean children farm hours | -0.001(-0.19) | 0.001(0.21) | -1103.718(-1.29) |
| Children’s average years of schooling | -0.011(-0.19) | -0.145*(-1.86) | 4349.156(0.27) |
| Constant | 3.969***(12.58) | 2.869***(6.41) | 116883(1.27) |
|
R2 |
0.312 | 0.327 | 0.2814 |
| F | 8.44 | 9.02 | 7.29 |
Source: Data Analysis, 2014; Note: *, **, *** Coefficients are significant at the 10%, 5%, and 1% level, respectively. The dependent variable is the total household income from the particular source expressed in naira; AE: Adult Equivalent.
than that for boys, implying that there is inequality in schooling amongst the male and female children in the selected households with the male children having more advantage than the female children. This result is in consonance with that of Ganicott (2008) and National Bureau of Statistics (2009) for a related study.
Factors determining access to schooling among children
To examine the factors that determine the access to schooling by the children of the farming households, OLS model was used. The result is presented in Table 3. The results in Table 3 shows that the age of the household heads, marital status, household size, dependency ratio, farm size, household head’s and mother’s education and the mean time children spend working on the farm (hours) are significantly related to the average years of schooling of the children. This implies that percentage increase in the age of household heads, marital status, household heads’ and mothers’ education increases the children’s access to schooling by 20, 233.2, 122.1, 13.7 and 6.9% respectively. This can be attributed to the fact that children with parents who have secondary occupation is expected to have more access to schooling as their parents engage in other are able to complement their income from farming, thereby making them more capable to cater for their cost of schooling. The fact that the marital status of parents affects children access to schooling is logical in that households with the presence of both partners are better able to pull their financial resources, have better parent-children time as well as other parental non-monetary resources such as social contact that could enhance their child’s educational status. These results are not too different from those of Bredie and Beehary (1998) for the occupation of the parents. So also the result for mothers’ education can be substantiated by findings of several studies such as that of Woldehanna et al. (2005), Morrison, Raju and Sinha (2007) and UNESCO (2008).
On the other hand, a percentage increase in the dependency ratio, farm size and mean farm hours will result in 90, 16.7 and 2.8% decrease in access to schooling by the children respectively. This implies that the more dependants there are in a household, the more the financial burden of the household, hence the less the access to schooling of children in the households, because schooling is substituted for other pressing financial needs. This finding is in tandem with that of Jafarey and Lahiri (2002) for land asset which is a vital component of household asset index used in this article.
For boys, their access to schooling was determined by age of household heads, marital status, household size, farm size, mean hours spent by children in farm work and the household per capita income. For girls, access to schooling was determined by the age of household heads, education of household heads, religion, primary occupation of household heads, household size, and dependency ratio. This is especially so because the labour of the boy child is needed more for some farm work. From this result, it is seen that the girl child is more likely to be enrolled in school when there is adequate labour on the farm. Therefore, a large household enables the enrolment of the girl-child schools. Also, an educated household heads would prefer that their children are educated regardless of the gender as shown in Table 1. The result also showed that households headed by farmers are less likely to send their girl child to school. This may be due to the fact that the girl child is expected to help out in household chores resulting from the very low value placed on their education. These results can also be substantiated with that of Akanbi (2012).
Effect of children’s schooling on the income
As seen in Table 4, the household size is seen to have a negative effect on total household income, farm income and off-farm income. This may be because the income is expressed in per capita terms and most of household members in the study area are dependents (though adults but above 65 years of age), thereby making the contribution to income by all household members low. Likewise, households with older heads have low total income, which may be as a result of their inability to engage actively in other income yielding activities. Household assets also influence total income and off-farm income in a positive and significant way. This implies that a percentage increase in value household assets leads to an increase in total income by 9.36e-06 and off-farm income by 1.87% respectively. The farm size contributes positively to farm income implying that every additional hectare of land cultivated, leads to a rise in farm income by N0.313. It was however noted that participating more in farming activities was found to increase both total and off-farm income but decrease farm income. This negative impact on farm income probably may be as the result of the recent poor agricultural season which explains why most of the income realized by these households was from off-farm activities.
Furthermore, the cost of schooling was found to have a positive effect on both total and farm income. These imply that with an additional increase in the cost of schooling will result in N0.099 and N0.150 increase in the total and farm income respectively. The can be attributed to the case whereby the households put in more efforts into activities that will yield more income so as to buffer the effect of increased cost of schooling on the household. The average years of schooling of the children was negatively correlated with farm income, reducing farm income by N0.145. This means that as the children advance in school, more of their time is spent in school and less on the farm, reducing their contribution on the farm hence the total farm income. This result confirms the negative relationship between the household per capita income and total average years of schooling in Table 3. These results are not too different from those of Morrison (2002) and Action Aid (2003) particularly for the cost of schooling,
Conclusions and Recommendations
This article concludes that although inequality amongst children is reduced, it still exists in favour of the boy-child and this calls for urgent attention to avoid future problems. However, household asset index, dependency ratio and farm size were some of the factors reducing children’s access to schooling. While the average number of years the children spent schooling was found among others to a significant effect on the income of the household. It was therefore recommended that there is need to:
- 1. Educate parents in the rural areas more on the importance of sending their children to school particularly their girl child. This is because such investments would not only improve the livelihood of the children in the short run, it will also enable them compete intellectually with their urban counterparts in future employments, making better decisions on how to effectively and efficiently manage their farms to increase productivity and hence income.
- 2. Efforts should also be made to engage these women in adult education so as to empower them to make positive contributions to the mental and general welfare of their children. In the same regard, we must see to it that young girls who are to be future mothers acquire quality education to enable them impact positively in their future society.
Author’s Contribution
Raphael Olanrewaju Babatunde: Presented the concept, supervisoed the study and reviewed the manuscript.
Adeyemi Esther Omoniwa: Drafted teh manuscript, reviewed the data and final manuscript.
Miriam Ukemenam: Collected and analysed the data and interpreted it.
References
Action Aid. 2003. Transforming education for girls in Nigeria and Tanzania”. Action Aid
Akanbi, G.O. 2012. Gender inequality in basic educationin sub-saharan Africa: A Conspiracyof Culture, Poverty, Wars andHIV/AIDS; Eur. J. Humanit. Soc. Sci. Vol. 12, No.1 (special issue), 2012.
Bredie, J.W.B. and G.K. Beeharry. 1998. ‘School enrolment decline in sub-saharan Africa: beyond the supply constraint’, World Bank Discussion Paper No. 395, Washington D.C.: The World Bank.
British Council of Nigeria. 2012. Gender in Nigeria Report. 2012; Improving the Lives of Girls and Women in Nigeria- Issues, Policies and Action.
Burkam, D. 2002. Inequality at the starting gate: Social background differences in achievement as children begin school. Accessed on 15/12/2013.
Chikaire, J., F.N. Nnadi, F.C. Anaeto, N.O. Anyoha and N. Ejiogu-Okereke. 2012. Investing in sound foundation education: A recipe for food security and poverty reduction in nigeria.science education development institute. 2012 Volume 2 (1) Jan: 47 – 62.
Emetarom, U.G. 2000. Analysis of gender access and inequality in school enrolment: Implication for the Universal Basic Education (UBE) programme in Nigeria. Proceedings of the 15th Annual Congress of the Nigerian Academy of Education, Univ. Benin 6-9th November, pp. 320-333.
European Commission 2010. Gender differences in educational outcomes: Study on the measures taken and the current situation in Europe. Education, Audiov. Cult. Exec. Agency.
Fakrogha, E. 2014. Equal educational opportunities for The Nigerian Child Knowledge Review Volume 31 No. 2, December, 2014.
FAO and UNESCO 2003. Education for rural development: towards new policy responses. International institute for educational planning. FAO ISBN: 95-5-104983-1, UNESCO ISBN: 92-803-1220-0
Gannicott, K. 2008. Kwara State Education Sector Analysis; second draft March, 2008.
Glewwe, P. and M. Kremer.2006.“Schools, Teachers and education outcomes in developing countries,” In Handbook of the economics of education, ed. by Eric Hanushek et al., North Holland.
Jafarey, S. and Lahiri, S. 2002. ‘Will trade sanctions reduce child labour? The role of credit markets’. J. Dev. Econ. Vol. 68: pp. 137-56. https://doi.org/10.1016/S0304-3878(02)00009-3
Ijaiya, N.Y.S. 2004. Re-Engineering educational quality management for quality education in kwara state, Nigeria: Int. J. Educ. Manage. (IJEM), vol. 3.
Kwara State Nigeria Ministry of Education. 2006. Educational Statistics Ilorin: Planning. Res. Stat. Dep. pp: 3-9.
LSMS. 2004. Nigerian living standard measurement survey 2004 report. www.nigerianstat.gov.ng/nada/index.php/catalog/28/download/35
Morrison, A., D. Raju and N. Sinha. 2007. Gender equality, poverty and economic growth. Policy Research Working Paper. The World Bank, Washington. At: http://www.development.wne.uw.edu.pl/uploads/Courses/DW_additional_gender.pdf.
Mulongo, G. 2013. Inequality in accessing higher education in Kenya; Implications for economic development and well-being. Int. J. Humanit. Soc. Sci. Vol. 3 No. 16: 49.
National Population Commission (NPC). 2008. Nigeria education data survey report. Abuja.
Naija Child. Found. 2012. Nigerian National Bureau of Statistics (NBS). 2006. retrieved from www.nigerianstat.gov.ng
National Bureau of Statistics (NBS). 2009. Profile of women and men in Nigeria. At: www.nigerianstat.gov.ng
National Bureau of Statistics. 2010. Estimate. www.nigerianstat.gov.ng/download/33
Society for International Development. 2004. Pulling Apart; Facts and figures on inequality in Kenya. Nairobi. Soc. Int. Dev. https://www.sidint.net/sites/www.sidint.net/files/docs/pulling-apart.pdf
UNESCO. 1998. The State of Education in Nigeria UNESCO, Lagos office: Nigeria. www.unesdoc.unesco.org/images/0012/001230/123095Eo.pdf
UNESCO. 2008. Education for all. global monitoring report. UNESCO, Paris. http://unesdoc.unesco.org/images/0015/001547/154743e.pdf
United Nations Developmennt Summit Report. 2015. http://www.who.int/mediacentre/events/meetings/2015/un-sustainable-development-summit/en/
Woldehanna, T., N. Jones and B. Tefera. 2005. Children’s educational completion rates and achievement: Implications for Ethiopia’s second poverty reduction strategy (2006-10). London, UK: Young Lives, Save the Children UK.
World Bank. 2011. Gender and development report. www.siteresources.worldbank.org/.../23004019/DC2011-0011(E)WDR2012_Gender.pdf
World Development Report 2012. Gender and Development, Washington, DC, World Bank.


