

Fitting Nonlinear Growth Models on Weight in Mengali Sheep through Bayesian Inference


Fitting Nonlinear Growth Models on Weight in Mengali Sheep through Bayesian Inference
Farhat Iqbal1, Mohammad Masood Tariq2,*, Ecevit Eyduran3, Zil-e-Huma4, Abdul Waheed5, Farhat Abbas2, Muhammad Ali2, Nadeem Rashid2, Majed Rafeeq2, Asadullah2 and Zahid Mustafa2
1Department of Statistics, University of Balochistan, Quetta, Pakistan
2Centre of Advanced Studies in Vaccinology and Biotechnology, University of Balochistan, Quetta, Pakistan
3Igdir University, Faculty of Agriculture, Department of Animal Science, Igdir, Turkey
4Department of Zoology, Sardar Bahadur Khan Women’s University, Quetta, Pakistan
5Faculity of Veterinary Sciences, Bahauddin Zakariya University, Multan, Pakistan
ABSTRACT
This article deals with the Bayesian analysis as an alternative to the classical approach for estimating the body growth of Mengali sheep breed of Balochistan, Pakistan. The parameters mature weight, integration constant, maturity rate and their credible intervals of four widely-used nonlinear sigmoidal growth models were estimated through Bayesian inference. Gompertz, Logistic, Brody and Von Bertalanffy models were fitted to average monthly body weight data of (n = 412) Mengali sheep from birth to 24 months of age for both sexes (male and female) and type of births (single and twin). The overall goodness of fit was checked by calculating Deviance Information Criteria (DIC) and the square of correlation (R2) between observed body weight and the predicted value’s marginal density means. The DIC and R2 values of the models ranged from 31.2 to 59.3 and 0.9702 to 0.9977, respectively. Our results revealed the superior performance of the Brody model in terms of lower DIC and higher R2 values for male, female, single and twin birth sheep data, thus providing the overall best fit than the competing nonlinear growth models. The findings of this study indicate the potential of fitting complex nonlinear functions to weight-age relationship of animal data via Bayesian approach.
Article Information
Received 30 June 2018
Revised 12 August 2018
Accepted 04 September 2018
Available online 29 January 2019
Authors’ Contribution
FI and MMT collected the data and conducted the research. EE, ZH, AW and FA analysed the data. MA, NR and MR wrote the manuscript. Assadullah and ZM editing the manuscript.
Key words
Mengali sheep, Nonlinear models, Body weight, Growth rate, Bayesian, Model fitting.
DOI: http://dx.doi.org/10.17582/journal.pjz/2019.51.2.459.466
* Corresponding author: tariqkianiraja@hotmail.com
0030-9923/2019/0002-0459 $ 9.00/0
Copyright 2019 Zoological Society of Pakistan
Introduction
Sheep is considered as one of the major livestock resources and a small ruminant in improving rural economy. Increase in body weight of sheep with age also known as growth is of primarily economic significance. Many nonlinear functions have been used to describe the sigmoidal relationship between body growth of sheep and age. Among these, the three parameters Gompertz (Laird, 1965), Logistic (Nelder, 1961), Brody (Brody, 1945) and Von Bertalanffy (Bertalanffy, 1957) functions are commonly used in modelling the growth in weight of animals with age. These nonlinear growth models are often preferred over linear models because of their sigmoid form (Tariq et al., 2013). Using these models, large volumes of information can be condensed into a small set of parameters for easy biological interpretations (da Silva et al., 2012). These models can describe the weight gain and evaluate some interesting biological parameters, such as the mature weight, the rate of maturing and the rate of gain.
There are many earlier studies that have successfully applied these and other growth curves in modelling the weight-age relationship of various species of animals. Akbas et al. (1999) for the growth in Kivircik and Daglic male lambs; Tekel et al. (2005) in Awassi lambs; Kor et al. (2006) in Akkeci female white goats; Karakus et al. (2008) in Norduz male lambs; Kucuk and Eyduran (2009) in Akkaraman and German black headed x Akkaraman cross breed lambs; Keskin et al. (2009) in Konya Merino sheep; Kum et al. (2010) in Norduz female lambs; Daskiran et al. (2010) in Norduz female and male sheep; Kopuzlu et al. (2014) in Hemsin male and female sheep and Hojjati and Hossein-Zadeh (2017) in Mehraban sheep are few among those studies. Different nonlinear functions were also used by Tariq et al. (2011, 2013) for estimating the growth curve and parameters in Mengali sheep of Balochistan.
These growth curves are mainly fitted using nonlinear regression. The classical method of maximum likelihood is mostly employed that treats the parameters of growth models fixed constants and estimates the unknown parameters using iterative algorithms. As an alternative to the classical method of estimation, the Bayesian methodology has recently gained attention of researchers as a precious tool for the estimation of the unknown parameters of different nonlinear functions. In the Bayesian approach, the parameters of the model are random variables and inference is made on parameters using their posterior distributions. In the Bayesian framework, the inference on the parameters is made on their posterior distribution without the assumption of normality of the studied data. It considers the uncertainty of the parameters under study and, in general, produces accurate estimates along with the credible intervals. In the past, this approach had been avoided by many previous researchers especially in animal science because of greater computational cost and difficulties in programming (Zhang et al., 2007). However, recent advancements in computing and efficient Markov Chain Monte Carlo (MCMC) methods have made it a popular choice among researchers from various disciplines as an alternative to classical approach.
To the best of our knowledge, the Bayesian approach has not yet been implemented for the estimation of parameters of nonlinear growth curve for Mengali sheep breed of Balochistan. Therefore, this study aims to fill this gap by fitting the Gompertz, Logistic, Brody and Von Bertalanffy models to the Mengali sheep data from birth to two years of age through Bayesian inference as a reliable approach. The Bayesian approach is important to accurately determine appropriate slaughtering age and feed amount of the Mengali sheep.
Materials and methods
Data
The data on weight in kilogram (kg) of 412 Mengali sheep of Balochistan from birth to 24 months (two years) of age were obtained from Center of Advanced Studies in Vaccinology and Biotechnology, University of Balochistan, Quetta. The present data were not obtained in experimental conditions. The weight-age data set consist of 206 males and 206 females; 339 single and 73 twin birth sheep. The sheep records were measured at birth weight, 1st, 2nd, 3rd, 4th, 6th, 9th, 12th, 18th, and 24th months of age. The animals were weighed with sensitivity scale of 50 g. The weight-age relationship for Mengali sheep was described using average body weights of these sheep in each period.
Statistical analysis
Several nonlinear growth models are used in the current study. Considering the model:
Where, yj is the observed body weight of jth animal, n is the total number of animals, tj is the time at which jth observation was recorded, Ԑj is the error term that is distributed normally with mean 0 and variance σ2. In the above model, fi (.) is one of the four different type of growth curves with i = 1,2,3,4 for the Gompertz, Logistic, Brody and Von Bertalanffy functions, respectively and βi is the vector of unknown parameters for the corresponding curve. Let βi = (β1, β2, β3)′ be the unknown vector of parameters, the nonlinear models employed to fit growth data of Mengali sheep are described as:
Gompertz Model

Logistic Model

Brody Model

Von Bertalanffy Model
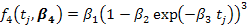
In the above models, tj is the time in days, parameter β1 is the asymptotic or mature weight of the adult animal as age approaches infinity, parameter β2 is the constant related to the birth weight of the animal and parameter β3 is the maturity index of growth rate relative to the mature weight of the adult animal.
Bayesian inference was employed to obtain the joint posterior distribution for the unknown parameters of each growth model separately for male and female sheep and singles and twin sheep. Based on the lowest deviance information criteria (DIC) and higher R2 values, the best model that fits the data best and describes the body weight-age relationship for both sexes (male and female) and type of births (single and twin) was obtained. All statistical analysis was conducted using the R program (R Development Core Team, 2014). The JAGS program (Plummer, 2003) was used to obtain the posterior samples of the parameters of models through R2 JAGS package of Su and Yajima (2015). Non-informative prior distributions were used for the parameters of each growth curve and for the precision parameter. More specifically, we used a normal distribution with mean 0 and standard deviation 0.001 for each parameter, i.e., βi~N(0,1002) and a gamma distribution for the precision parameter, i.e., Ga(0.001, 0.001). Using MCMC, a total of 50,000 samples were generated discarding initial 10,000 as a burn-in period. After a thinning of every 10th sample, a sample of 4000 was used for the posterior analysis. Through CODA program (Best et al., 1995) and Geweke convergence criteria (Geweke, 1992), the convergence of MCMC chains was verified. The MCMC chains showed good mixing performance and fast convergence.
Various measures exist to select the model that best fit the data among the competing models. The DIC that compares the overall predictive ability for model assessment was used in the Bayesian approach. The DIC is a measure of complexity of the models and the model with the smallest DIC is considered to fit the data better. If the difference in DIC of competing models is small then relying only on the value could be misleading (Spiegelhalter et al., 2002). Therefore, we adopt the following criteria to check the significance of DIC; if the difference of DIC between two models is less than 3 it is considered not significant whereas a difference of 3 and more is considered significant (Spiegelhalter et al., 2002). Besides, the square of the correlation between observed body weight and the predicted value’s marginal densities means, also known as coefficient of determination (R2) was also calculated. High values of R2 (close to unity) indicate accurate fit to the observed weight.
Results and discussion
Table I presents the DIC values for each growth curve fitted via Bayesian approach to average weight of Mengali sheep from birth to two years of age for both sexes and type of births. The difference in DIC values, of the best fit model (having the lowest DIC), with other models are also reported. The results reflected that the Brody growth model fit the data better than the other candidate nonlinear models. The values of DIC for the Brody model were found the lowest for all four cases (male, female, single and twin birth data). The difference between DIC values were found greater than 10 points for most of the cases, indicating high significant difference between the models fit. Both the Von Bertalanffy and Gompertz models followed the Brody model in terms of better fit. Though, the difference between these two models was not found significant.
For each model, the values of R2 are also reported in Table I. For the Brody model, the R2 values were 0.9963, 0.9967, 0.9965 and 0.9977 for male, female, single and twin, respectively. These values were found higher than all other nonlinear growth models indicating the superior fit to observed body weight by the Brody model. The Von Bertalanffy model was also found to provide a good fit to the data based on higher R2 values compared to the Gompertz and Logistic models.
Table II shows the estimates of median, mean along with their standard deviations (SD) and 95% Bayesian confidence intervals also known as credible intervals for each parameter of the four growth models fitted to male and female sheep data. These estimates are obtained from the posterior distributions of parameters. The SDs of the posterior distribution are similar to the approximate estimates of the standard error of the parameters. The median and mean estimates of parameters were found to be close to each other in all cases. Higher SDs of the parameter estimates were observed for the logistic function through Bayesian analysis. The 95% Bayesian confidence intervals include the estimated parameters in all cases showing the advantage of the Bayesian approach for modelling the complex nonlinear functions, particularly is small data sets where the classical method often fail to converge.
Table I.- Comparison of various growth curves for body weight of Mengali sheep.
|
Model |
DIC |
Comparison |
Difference |
R2 |
|
Male |
||||
|
Gompertz |
50.9 |
Gompertz – Brody |
11.6* |
0.9821 |
|
Logistic |
59.3 |
Logistic – Brody |
20.0* |
0.9702 |
|
Brody |
39.3 |
– |
– |
0.9963 |
|
Von Bertalanffy |
49.7 |
Von Bertalanffy – Brody |
10.4* |
0.9756 |
|
Female |
||||
|
Gompertz |
43.7 |
Gompertz – Brody |
12.5* |
0.9862 |
|
Logistic |
57.7 |
Logistic – Brody |
26.5* |
0.9723 |
|
Brody |
31.2 |
– |
– |
0.9967 |
|
Von Bertalanffy |
41.0 |
Von Bertalanffy – Brody |
9.8* |
0.9771 |
|
Single |
||||
|
Gompertz |
46.7 |
Gompertz – Brody |
12.9* |
0.9842 |
|
Logistic |
59.1 |
Logistic – Brody |
25.3* |
0.9707 |
|
Brody |
33.8 |
– |
– |
0.9965 |
|
Von Bertalanffy |
45.2 |
Von Bertalanffy – Brody |
11.4* |
0.9889 |
|
Twin |
||||
|
Gompertz |
46.8 |
Gompertz – Brody |
8.6* |
0.9896 |
|
Logistic |
55.5 |
Logistic – Brody |
17.3* |
0.9793 |
|
Brody |
38.2 |
– |
– |
0.9977 |
|
Von Bertalanffy |
46.5 |
Von Bertalanffy – Brody |
8.3* |
0.9932 |
*, Significant; DIC, Deviance Information Criteria; R2, coefficient of determination. Lowest values of DIC and R2 are in bold.
The estimate of asymptotic or mature weight of the adult animal is provided by the parameter β1 in all four equations. For male (female) sheep data, the highest estimated mature weight was 50.87 kg (41.51 kg) obtained from the Brody model, the lowest was 43.14 kg (37.06 kg) obtained from the Gompertz (Logistic) model (Table II). The difference between the largest and smallest mature weight was about 7.73 kg for male and 4.45 kg for female sheep. Moreover, the mature live weights of male Mengali sheep was found higher than that of female.
For single (twin) birth type data, the highest estimate mature weight was 46.01 kg (48.94 kg) again obtained from the Brody model, the lowest was 41.74 kg (41.17 kg) obtained from the Gompertz model (Table III). The difference between the largest and smallest mature weight in this case was about 4.27 kg for single birth and 7.77 kg for twin birth. The difference between the estimates of mature weights in both type of births was found similar indicating that birth types of Mengali sheep may not affect the asymptotic weight of animals.
The highest estimated values of the parameter β2 (also known as integration constant related to the proportion of growth after birth) were found 2.02 kg and 1.95 kg for male and female sheep, respectively. These values were observed for the Gompertz model which had lowest mature weights (43.14 kg) for female, indicating a negative correlation between parameters β1 and β2. The same values obtained for the Brody model were found 0.92 kg and 0.91 kg, respectively, for female and male sheep data. The negative correlation indicates that sheep that grow faster do not gain a large mature weight compared to those that mature more slowly in earlier life.
Table II.- Posterior summary statistics of parameters of the growth curves for male / female data.
|
Model |
Median |
Mean |
SD |
95% Credible Intervals |
||
|
2.5% |
97.5% |
|||||
|
Gompertz |
β1 |
43.495 / 38.257 |
43.136 / 38.271 |
1.566 / 1.659 |
39.153 / 34.988 |
44.926 / 41.650 |
|
β2 |
2.024 / 1.940 |
2.033 / 1.953 |
0.187 / 0.157 |
1.684 / 1.669 |
2.419 / 2.311 |
|
|
β3 |
0.007 / 0.007 |
0.007 / 0.007 |
0.001 / 0.001 |
0.006 / 0.005 |
0.009 / 0.009 |
|
|
Logistic |
β1 |
43.784 / 37.061 |
44.028 / 37.063 |
4.179 / 2.510 |
37.315 / 31.880 |
52.098 / 41.915 |
|
β2 |
1.568 / 1.526 |
1.598 / 1.638 |
0.280 / 0.786 |
1.132 / 1.142 |
2.212 / 2.385 |
|
|
β3 |
0.009 / 0.010 |
0.010 / 0.012 |
0.003 / 0.009 |
0.011 / 0.007 |
0.016 / 0.020 |
|
|
Brody |
β1 |
50.657 / 41.426 |
50.866 / 41.505 |
2.883 / 1.370 |
45.799 / 38.989 |
57.182 / 44.536 |
|
β2 |
0.920 / 0.911 |
0.921 / 0.911 |
0.018 / 0.016 |
0.887 / 0.881 |
0.931 / 0.944 |
|
|
β3 |
0.003 / 0.004 |
0.003 / 0.004 |
0.001 / 0.001 |
0.002 / 0.003 |
0.004 / 0.004 |
|
|
Von Bertalanffy |
β1 |
46.426 / 38.880 |
46.673 / 38.966 |
3.201 / 1.663 |
40.870 / 35.802 |
53.467 / 42.337 |
|
β2 |
0.5044 / 0.495 |
0.510 / 0.497 |
0.039 / 0.028 |
0.449 / 0.446 |
0.601 / 0.560 |
|
|
β3 |
0.005 / 0.006 |
0.005 / 0.006 |
0.001 / 0.001 |
0.004 / 0.004 |
0.007 / 0.007 |
|
SD, standard deviation.
Table III.- Posterior summary statistics of parameters of the growth curves for single / twin birth data.
|
Model |
Median |
Mean |
SD |
95% Credible Intervals |
||
|
2.5% |
97.5% |
|||||
|
Gompertz |
β1 |
41.865 / 41.323 |
41.741 / 41.172 |
1.715 / 1.903 |
38.085 / 36.960 |
44.604 / 44.408 |
|
β2 |
1.962 / 2.072 |
1.974 / 2.081 |
0.167 / 0.154 |
1.676 / 1.791 |
2.350 / 2.410 |
|
|
β3 |
0.005 / 0.006 |
0.007 / 0.006 |
0.001 / 0.001 |
0.005 / 0.005 |
0.009 / 0.008 |
|
|
Logistic |
β1 |
40.697 / 40.280 |
40.732 / 41.225 |
2.897 / 11.328 |
35.049 / 34.795 |
46.568 / 48.587 |
|
β2 |
1.549 / 1.633 |
1.619 / 1.656 |
0.522 / 0.250 |
1.159 / 1.242 |
2.326 / 2.225 |
|
|
β3 |
0.010 / 0.008 |
0.011 / 0.009 |
0.006 / 0.002 |
0.007 / 0.005 |
0.020 / 0.014 |
|
|
Brody |
β1 |
46.028 / 48.439 |
46.089 / 48.941 |
1.685 / 4.256 |
43.020 / 43.047 |
49.705 / 57.445 |
|
β2 |
0.915 / 0.925 |
0.915 / 0.926 |
0.016 / 0.016 |
0.885 / 0.896 |
0.949 / 0.962 |
|
|
β3 |
0.003 / 0.003 |
0.004 / 0.003 |
0.001 / 0.001 |
0.003 / 0.002 |
0.004 / 0.003 |
|
|
Von Bertalanffy |
β1 |
42.963 / 43.468 |
43.054 / 43.725 |
2.153 / 3.161 |
39.027 / 38.231 |
47.777 / 50.646 |
|
β2 |
0.499 / 0.515 |
0.502 / 0.518 |
0.032 / 0.037 |
0.447 / 0.461 |
0.575 / 0.595 |
|
|
β3 |
0.006 / 0.005 |
0.006 / 0.005 |
0.001 / 0.001 |
0.004 / 0.003 |
0.008 / 0.006 |
|
SD, standard deviation.
The maturity rate was estimated by the parameter β3 in all growth models. This parameter is taken as a measure of growth as it influences the growth speed. Large values of β3 indicate early maturing animals and vice versa. The Gompertz model estimated the highest maturity rate (0.006-0.007 kg) for all four cases indicating lower time to reach maximum growth. The lowest maturity rate value was obtained by the Brody model (0.003-0.004 kg) indicating a late maturity of animals. A negative correlation was observed between the mature weight and maturity rate of animals.
Though the parameters of all models were found significant, significant parameter estimates may not always guarantee a good fit. Table IV reveals the observed and estimated average weights of both sexes (male and female) of sheep from birth to two years of age for all four growth models. First, we noted that the estimated average weights for male sheep, obtained from the Brody model, were found very close to the observed weights from birth to two years of age. Though some weight values were slightly underestimated (180 and 540 days of age) and overestimated (60 days of age), the Brody model provided close estimates for the observed weights of male sheep. Same findings were observed for female sheep data where the Brody model outperformed other competing models in terms of producing accurate estimates of weights.
In case of type of births (single and twin), the Brody function was also found to provide accurate estimates of body weight, from birth to two years of age of Mengali sheep (Table V). At 30 and 180 days of age, this model underestimated the observed weight. A slight overestimation was noted at 60 days of age for single birth sheep data. For twin birth data, a small underestimation (over estimation) in weight was noted at 30 (60) days of age. But, again it was observed that the Brody model estimated the actual weight of twin birth data, for almost all days of age, better than other growth models used in this study.
Table IV.- Observed and estimated average weights of male / female sheep from various growth curves for one to 720 days of age.
|
Age (days) |
Observed weight (kg) |
Estimated weight (kg) |
|||
|
Gompertz |
Logistic |
Brody |
Von Bertalanffy |
||
|
1 |
3.60 / 3.56 |
5.73 / 5.50 |
7.47 / 6.09 |
4.17 / 3.82 |
5.54 / 5.05 |
|
30 |
8.05 / 7.91 |
8.29 / 7.84 |
9.35 / 7.99 |
8.19 / 7.64 |
8.36 / 7.72 |
|
60 |
11.77 / 10.49 |
11.32 / 10.57 |
11.63 / 10.36 |
11.98 / 11.19 |
11.46 / 10.69 |
|
90 |
15.54 / 14.36 |
14.57 / 13.47 |
14.24 / 13.13 |
15.43 / 14.37 |
14.69 / 13.71 |
|
120 |
19.70 / 18.51 |
17.88 / 16.39 |
17.13 / 16.18 |
18.57 / 17.21 |
17.88 / 16.65 |
|
180 |
24.82 / 22.00 |
24.16 / 21.89 |
23.35 / 22.51 |
24.05 / 22.03 |
23.85 / 21.96 |
|
270 |
29.01 / 26.30 |
31.66 / 28.38 |
32.02 / 30.16 |
30.58 / 27.53 |
31.19 / 28.12 |
|
360 |
35.23 / 31.81 |
36.57 / 32.62 |
38.00 / 34.28 |
35.51 / 31.48 |
36.48 / 32.37 |
|
540 |
40.23 / 35.92 |
41.15 / 36.56 |
42.82 / 36.69 |
42.07 / 36.34 |
42.46 / 36.52 |
|
720 |
47.01 / 39.15 |
42.56 / 37.78 |
43.80 / 37.02 |
45.83 / 38.85 |
44.99 / 38.10 |
Estimated weights close to observed weights are in bold.
Table V.- Observed and estimated average weights of single / twin birth sheep from various growth curves for one to 720 days of age.
|
Age (days) |
Observed weight (kg) |
Estimated weight (kg) |
|||
|
Gompertz |
Logistic |
Brody |
Von Bertalanffy |
||
|
1 |
3.62 / 3.39 |
5.87 / 5.20 |
6.80 / 6.65 |
4.06 / 3.74 |
5.42 / 4.97 |
|
30 |
8.20 / 6.91 |
8.37 / 7.22 |
8.77 / 8.18 |
8.12 / 7.02 |
8.24 / 7.21 |
|
60 |
11.49 / 9.67 |
11.28 / 9.60 |
11.21 / 10.03 |
11.90 / 10.17 |
11.39 / 9.75 |
|
90 |
15.42 / 12.98 |
14.39 / 12.18 |
14.03 /12.13 |
15.31 / 13.09 |
14.61 / 12.39 |
|
120 |
19.59 / 17.07 |
17.54 / 14.86 |
17.15 / 14.78 |
18.38 / 15.78 |
17.77 / 15.05 |
|
180 |
24.05 / 20.94 |
23.50 / 20.18 |
23.72 / 19.66 |
23.63 / 20.58 |
23.54 / 20.17 |
|
270 |
28.39 / 24.70 |
30.62 / 27.12 |
32.06 / 27.45 |
29.70 / 26.50 |
30.36 / 26.80 |
|
360 |
34.07 / 31.57 |
35.32 / 32.25 |
36.96 / 33.53 |
34.13 / 31.19 |
35.05 / 31.90 |
|
540 |
38.66 / 36.12 |
39.76 / 37.87 |
40.15 / 39.33 |
39.72 / 37.83 |
40.02 / 38.23 |
|
720 |
43.54 / 42.45 |
41.16 / 40.01 |
40.64 / 40.81 |
42.70 / 41.99 |
41.93 / 41.25 |
Estimated weights close to observed weights are in bold.
Figure 1 depicts the fit of the Brody growth curve to the actual weights of both sexes and type of births within the Bayesian context. It can be clearly seen from the Figure 1 that this model is accurate in predicting the actual body weights of Mengali sheep. The DIC and R2 values of the Brody function also indicated that this function fit the Mengali sheep data better than the competing nonlinear growth models (Table I). Moreover, the graphs also show that there are differences in the growth of both sexes but not in type of births. Hormonal and physiological differences between sexes may have been the result of higher weight in male sheep. Similar findings were also recorded for Dwarf sheep by Gbangboche et al. (2008) and for Norduz sheep by Daskiran et al. (2010).
Different growth models can be used for estimating and predicting the growth of different species of animal. These models have different structure and fit the data based on the characteristics of the obtained data i.e., genotype and environmental variation. Due to the non-existence of literature on modelling weight-age relationship of sheep data through the Bayesian approach, a comparative study seems difficult. However, using the frequentist approach, the Brody model was found as the best nonlinear model describing the body weight and age relationship in Daglic and Kivircik male lambs (Akbas et al., 1999) and in Morkarman and Awassi sheep (Bilgin et al., 2004). According to Esenbuga et al. (2000) and Bilgin and Esenbuga (2003), the Brody model was found to be adequate for describing the growth in Awassi, Morkaraman and Tushin sheep. The Brody model was selected as the best function for weight-age relationship of African Dwarf sheep by Gbangboche et al. (2008). Kopuzlu et al. (2014) reported the superior performance of the Brody curve for estimation of growth curve in male and female Hemsin sheep. Hojjati and Hossein-Zadeh (2017) also found the Brody model as the best for growth of Mehraban sheep.
On the other hand, Lewis et al. (2002) found the Gompertz model appropriate for Suffolk sheep whereas Topal et al. (2004) found that both the Gompertz and Von Bertalanffy model provided the best fit for growth of Morkaraman and Awassi breeds. Goliomytis et al. (2006) reported the Richards function for better fitting the body weight of Karagouniko sheep. Tariq et al. (2013) reported the better fit of Morgan-Mercer-Flodin model for the growth in Mengali sheep. Hossein-Zadeh (2015) compared various nonlinear models and found the Richards model as the best equation for describing the growth in males, females Shall lamb. Waheed et al. (2016) suggested the Gompertz model appropriate for modelling the growth in Thalli sheep.
It is again worth mentioning that all previous work, related to weight-age relationship of sheep, used the frequentist method for fitting various growth models. Our approach is different and novel in a sense that we employed the Bayesian inference for the estimation of the parameters of commonly used growth models for sheep data. Using the Bayesian approach, the Brody model was found to provide the best fit to the live body weight of Mengali sheep for both sexes and type of births.
Conclusion
For optimized management and efficient animal production, modelling growth curves of animal is of great importance. In this study, Bayesian inference was adopted to estimate the parameter of four nonlinear growth models (the Gompertz, Logistic, Brody and Von Bertalanffy) for the body weight of both sexes and type of births of Mengali sheep of Balochistan from birth to two years of age. Using non informative priors, the estimates of median, mean, standard deviation and credible intervals were obtained using Bayesian approach. Our results indicated that the Brody model outperformed the candidate models in terms of lower DIC values and better estimated values of average weights. The Bayesian approach incorporates the parameter’s uncertainty and is suitable for complex nonlinear functions. The findings of this study may allow researchers to select the model for weight-age relationship that not only best fit the data but adequately describe the body growth of animals. This study can be extended by using different priors for parameters of nonlinear models and by using other nonlinear functions in Bayesian framework.
Statement of conflict of interest
The authors declare no conflict of interest.
References
Akbas, Y., Taskin, T. and Demiroren, E., 1999. Comparison of several models to fit the growth curves of Kivircik and Daglic male lambs. Turk. J. Vet. Anim. Sci., 23: 537-544.
Bertalanffy, L.V., 1957. Quantitative laws in metabolism and growth. Q. Rev. Biol., 32: 217-230. https://doi.org/10.1086/401873
Best, N.G., Cowles, M.K. and Vines, S.K., 1995. CODA: Convergence diagnostics and output analysis software for Gibbs sampler output, Version 0.3. MRC Biostatistics Unit, Cambridge.
Bilgin, O.C. and Esenbuga, N., 2003. Parameter estimation in nonlinear growth models. J. Anim. Prod., 44: 81-90.
Bilgin, O.C., Esenbuga, N., Macit, M. and Karaoglu, M., 2004. Growth curve characteristics in Awassi and Morkaraman sheep, Part I: Comparison of nonlinear functions. Wool Tech. Sheep Breed., 52: 1-7.
Brody, S., 1945. Bioenergetics and growth. Reinhold, New York.
da Silva, L.S.A., Fraga, A.B., da Silva, F.D.L., Beelen, P.M.G., de Oliveira Silva, R.M., Tonhati, H. and Barros, C.D.C., 2012. Growth curve in Santa Ines sheep. Small Rumin. Res., 105: 182-185. https://doi.org/10.1016/j.smallrumres.2011.11.024
Daskiran, I., Kioncagul, S. and Bingol, M., 2010. Growth characteristics of indigenous Norduz female and male lambs. J. agric. Sci., 16: 62-69.
Esenbuga, N., Bilgin, O.C., Macit, M. and Karaoglu, M., 2000. Growth curves in Awassi, Morkaraman and Tushin Lambs. Ataturk Univ. J. Agric. Facul., 31: 37-41.
Gbangboche, A.B., Glele-Kakai, R., Salifou, S., Albuquerque, L.G. and Leroy, P., 2008. Comparison of non-linear growth models to describe the growth curve in West African Dwarf sheep. Animal, 2: 1003-1012. https://doi.org/10.1017/S1751731108002206
Geweke, J., 1992. Evaluating the accuracy of sampling-based approaches to calculating posterior moments. In: Bayesian statistics 4 (eds. J.M. Bernardo, J.O. Berger, A.P. Dawid and A.F.M. Smith). Oxford University Press, Oxford, pp. 169-193.
Goliomytis, M., Orfanos, S., Panopoulou, E. and Rogdakis, E., 2006. Growth curves for body weight and carcass components, and carcass composition of the Karagouniko sheep, from birth to 720 d of age. Small Rumin. Res., 66: 222-229. https://doi.org/10.1016/j.smallrumres.2005.09.021
Hojjati, F. and Hossein-Zadeh, N.G., 2018. Comparison of nonlinear growth models to describe the growth curves of Mehraban sheep. J. appl. Anim. Res., 46: 499-504. https://doi.org/10.1080/09712119.2017.1348949
Hossein-Zadeh, N.G., 2015. Modeling the growth curve of Iranian Shall sheep using non-linear growth models. Small Rumin. Res., 130: 60-66. https://doi.org/10.1016/j.smallrumres.2015.07.014
Karakus, K., Eyduran, E., Kum, D., Ozdemir, T. and Cengiz, F., 2008. Determination of the best growth curve and measurement interval in Norduz male lambs. J. Anim. Vet. Adv., 7: 1464-1466.
Keskin, I., Dag, B., Sariyel, V. and Gokmen, M., 2009. Estimation of growth curve parameters in Konya Merino sheep. S. Afr. J. Anim. Sci., 39: 163-169. https://doi.org/10.4314/sajas.v39i2.44390
Kopuzlu, S., Sezgin, E., Esenbuga, N. and Bilgin, O.C., 2014. Estimation of growth curve characteristics of Hemsin male and female sheep. J. appl. Anim. Res., 42: 228-232. https://doi.org/10.1080/09712119.2013.842479
Kor, A., Baspina, E., Karaca, S. and Keskin, S., 2006. The determination of growth in Akkeci (white goat) female kids by various growth models. Czech J. Anim. Sci., 51: 110-116. https://doi.org/10.17221/3917-CJAS
Kucuk, M. and Eyduran, E., 2009. The determination of the best growth model for Akkaraman and German Blackheaded Mutton x Akkaraman B1 crossbreed lamb. Bulg. J. agric. Sci., 15: 90-92.
Kum, D., Karakus, K. and Ozdemir, T., 2010. The best nonlinear function for body weight at early phase of Norduz female lambs. Trakia J. Sci., 8: 62-67.
Laird, A.K., 1965. Dynamics of relative growth. Growth, 29: 249-263.
Lewis, R.M., Emmans, G.C., Dingwall, W.S. and Simm, G., 2002. A description of the growth of sheep and its genetic analysis. Anim. Sci. J., 74: 51-62.
Nelder, J.A., 1961. The fitting of a generalization of the logistic curve. Biometrics, 17: 89-110. https://doi.org/10.2307/2527498
Plummer, M., 2003. JAGS: A program for analysis of Bayesian graphical models using Gibbs sampling. Available at: http://citeseer.ist.psu.edu/plummer03jags.html
R Core Team R, 2014. A language and environment for statistical computing. R Foundation for Statistical Computing, Vienna, Austria.
Spiegelhalter, D.J., Best, N.G., Carlin, B.P. and van der Linde, A., 2002. Bayesian measures of model complexity and fit. J. R. Stat. Soc. Ser. B, 64: 583-640. https://doi.org/10.1111/1467-9868.00353
Spiegelhalter, D.J., Thomas, A., Best, N.G. and Lunn, D., 2003. WinBUGS user manual, version 1.4. MRC Biostatistics Unit, Cambridge.
Su, Y.S. and Yajima, M., 2015. R2jags: A package for running “JAGS’ from R, version 0.05-03. Available at: https://github.com/cran/R2jags
Tariq, M.M., Bajwa, M.A., Waheed, A., Eyduran, E., Abbas, F., Bokhari, F.A. and Akbar, A., 2011. Growth curve in Mengali sheep breed of Balochistan. J. Anim. Pl. Sci., 21: 5-7.
Tariq, M., Iqbal, F., Eyduran, E., Bajwa, M.A., Huma, Z.E. and Waheed, A., 2013. Comparison of non-linear functions to describe the growth in Mengali sheep breed of Balochistan. Pakistan J. Zool., 45: 661-665.
Tekel, N., Sireli, H.D., Elicin, M. and Elicin, A., 2005. Comparison of growth curve models on Awassi lambs. Ind. Vet. J., 82: 179-182.
Topal, M., Ozdemir, M., Aksakal, V., Yildiz, N. and Dogru, U., 2004. Determination of the best nonlinear function in order to estimate growth in Morkaraman and Awassi lambs. Small Rumin. Res., 55: 229-232. https://doi.org/10.1016/j.smallrumres.2004.01.007
Waheed, A., Eyduran, E., Tariq, M.M., Ahma, S., Hameed, T. and Bukhari, F.A., 2016. Comparison of the non-linear model defining the growth of Thalli sheep under desert conditions. Pakistan J. Zool., 48: 423-426.
Zhang, Z., Hamagami, F., Wang, L., Nesselroade, J.R. and Grimm, K.J., 2007. Bayesian analysis of longitudinal data using growth curve models. Int. J. Behav. Develop., 31: 374-383. https://doi.org/10.1177/0165025407077764
To share on other social networks, click on any share button. What are these?


