
Evaluation of Novel Anti-VEGF Molecules in the Animal Model of Human Lung Cancer


Evaluation of Novel Anti-VEGF Molecules in the Animal Model of Human Lung Cancer
Sanjukta Chakrabarti1, Colin J. Barrow2, Rupinder K. Kanwar3, Venkata Ramana1*, Rakesh N. Veedu4,5 and Jagat R. Kanwar3*
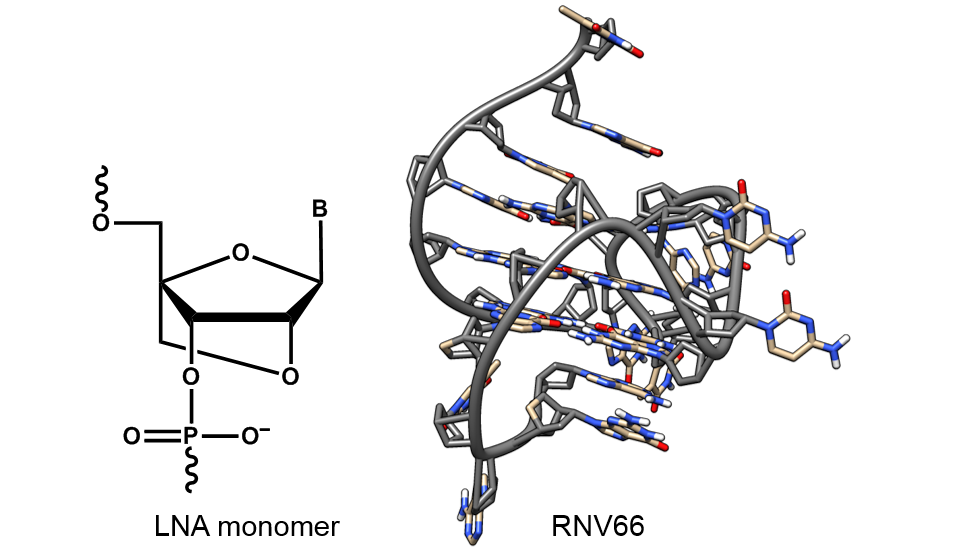
Structure of the aptamer, RNV66 (Edwards, S.L. et al. Chemical Communications; 2015) LNA stands for locked nucleic acid. It is a novel class of high-affinity RNA analogue in which the ribose ring is locked by a methylene bridge to 3’-endo conformation, giving it very high thermal stability. The aptamer RNV66 contains 3 LNA bases.
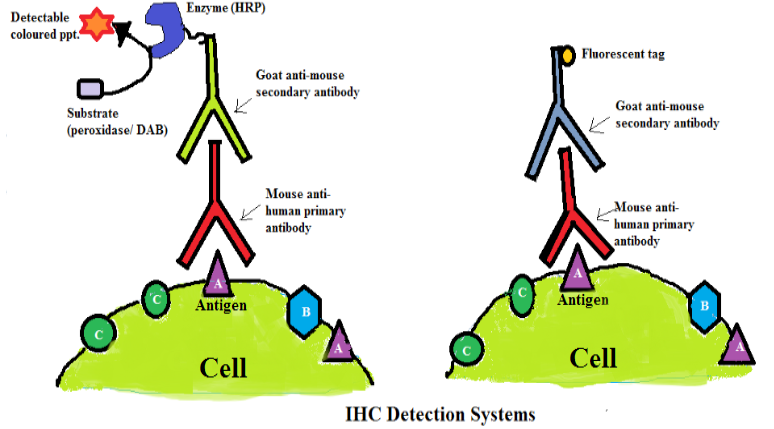
Immunohistochemistry scheme with different methods of antigen detection.

Tumor growth curve in response to anti-angiogenic treatment
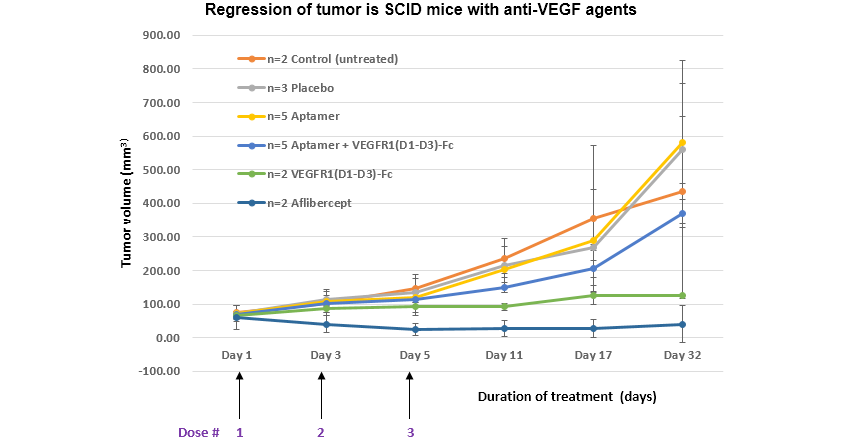
Plot of mean tumor volume in SCID mice versus duration of treatment with 15 mg/kg dose of anti-VEGF molecules.

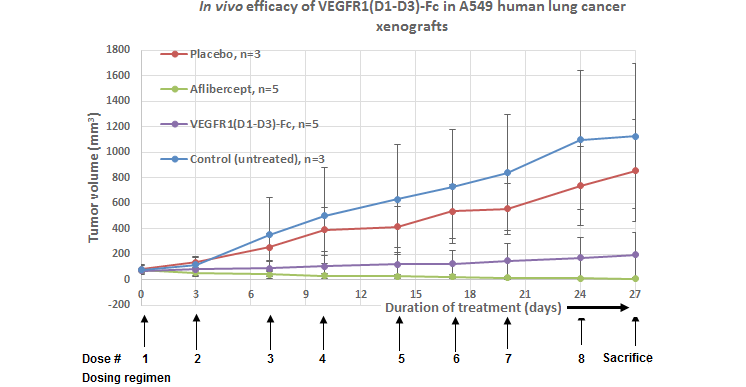
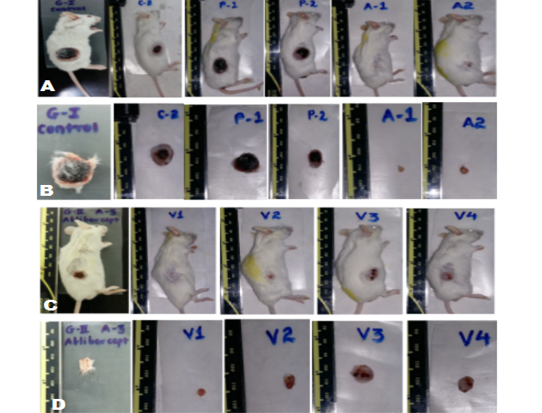
In vivo therapeutic efficacy of VEGFR1(D1-D3)-Fc to reduce xenograft tumor in SCID mice model.

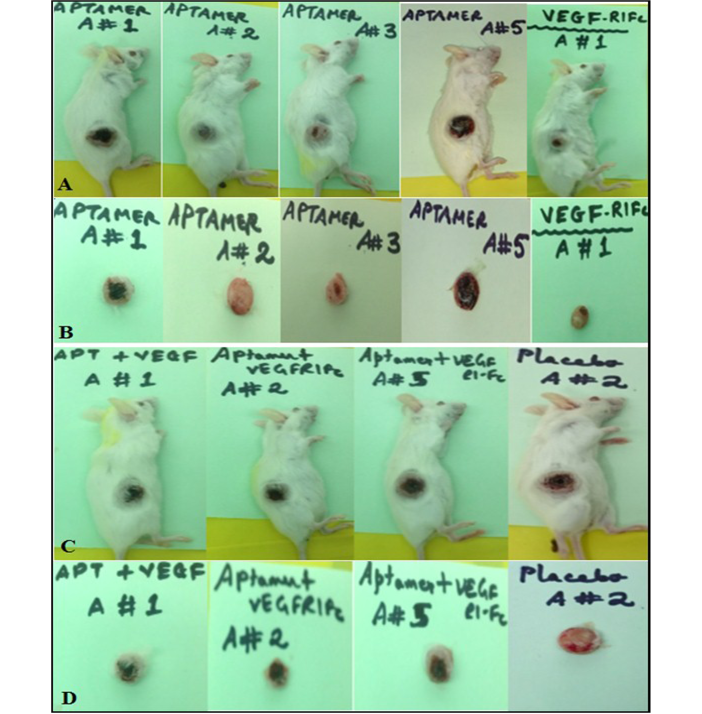
In vivo therapeutic efficacy of aptamer, RNV66 to reduce xenograft tumor in SCID mice model.

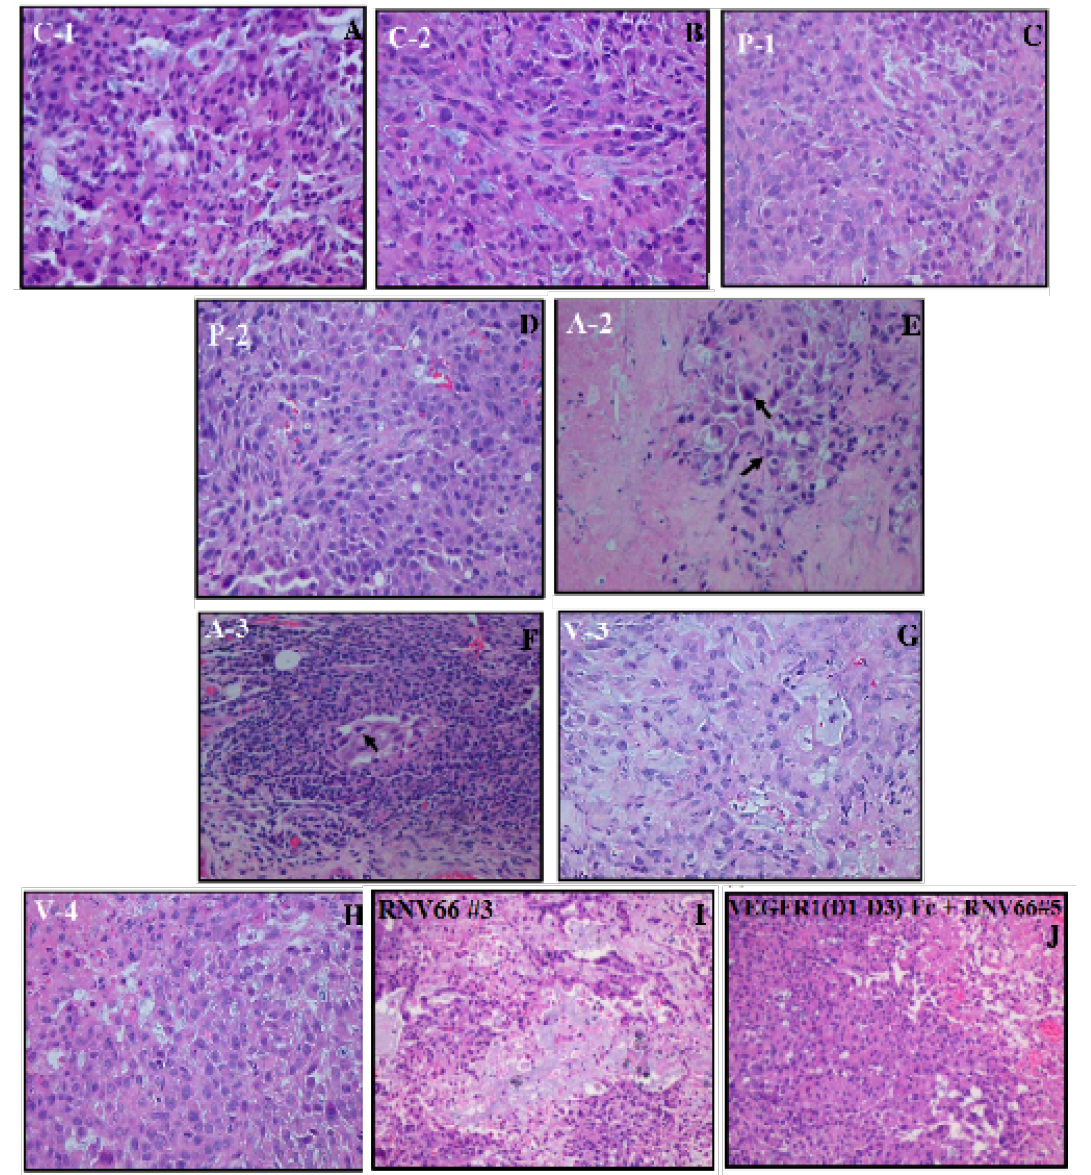
Representative images of histological sections of tumors.
(A, B) Images of C-1 and C-2 which represent sections from control (untreated) tumors; (C, D) Images of P-1 and P-2 which represent
placebo-treated tumors; (E, F) Images of A-3 and A-4 which represent aflibercept-treated tumors; (G, H) Images of V3 and V-4 which represent
VEGFR1(D1-D3)-Fc-treated tumors. (I) Image of RNV66#3, which represents aptamer-treated tumor in animal#3; (J) Image of
VEGFR1(D1-D3)-Fc and RNV66# 5, which represents animal#5 which received a combination of VEGFR1(D1-D3)-Fc and aptamer, as
treatment. Arrow heads indicate tumor cells in a pool of normal cells

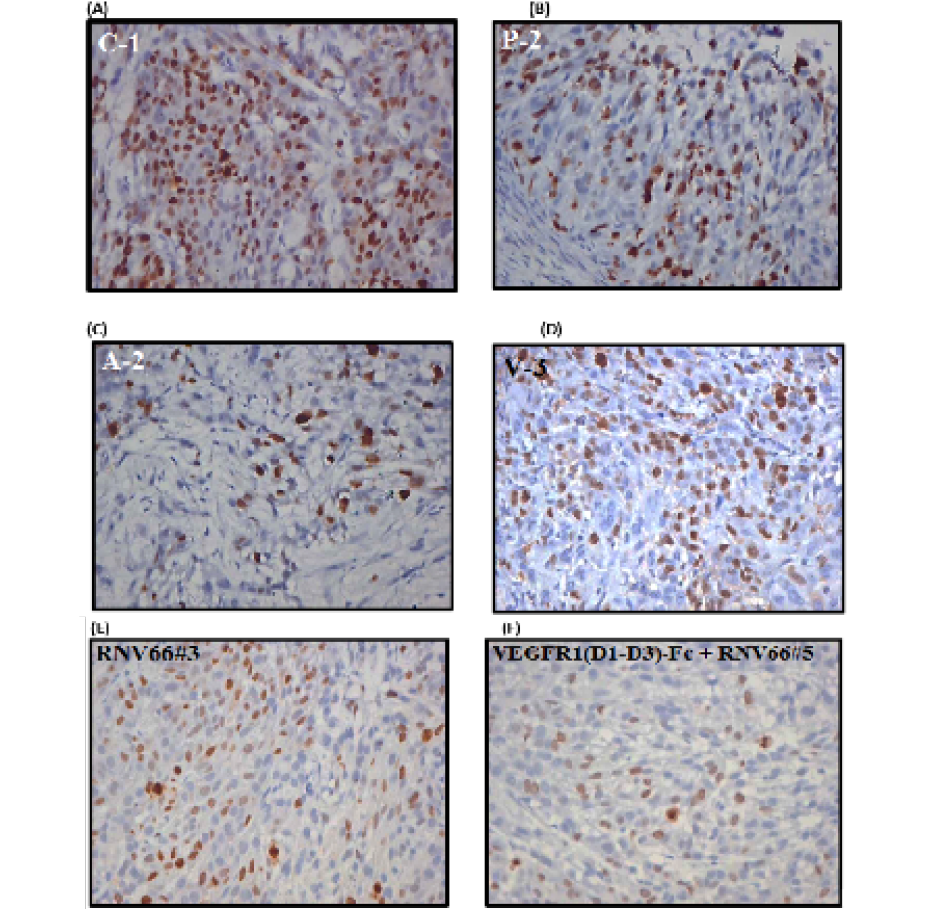
Ki-67 staining of tumor sections.

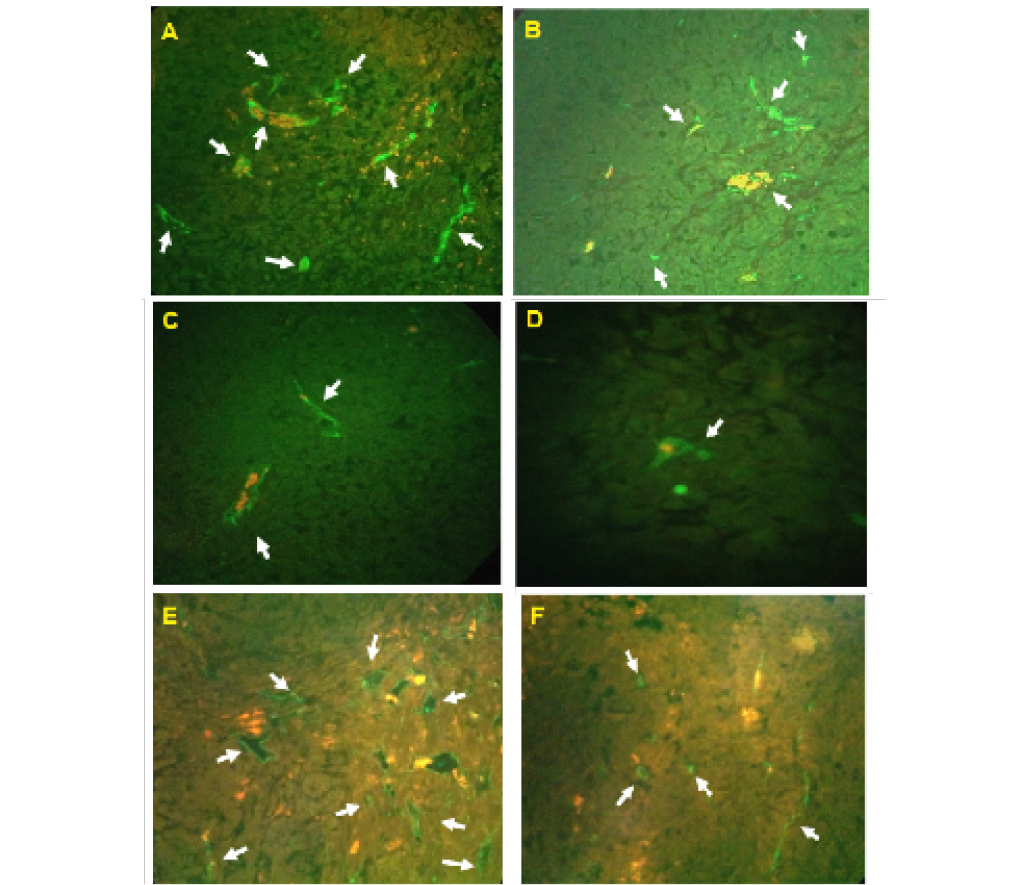
Representative images of immunofluorescence staining of CD31 in mouse vasculature in tumor sections.
(A) Untreated control (B) Placebo-treated (C) VEGFR1(D1-D3)-Fc-treated (D) Aflibercept-treated (E) RNV66-treated (F) VEGFR1(
D1-D3)-Fc plus RNV66-treated tumor. All images were captured in high power field, under 40 x magnification. Scale bar=100μm.

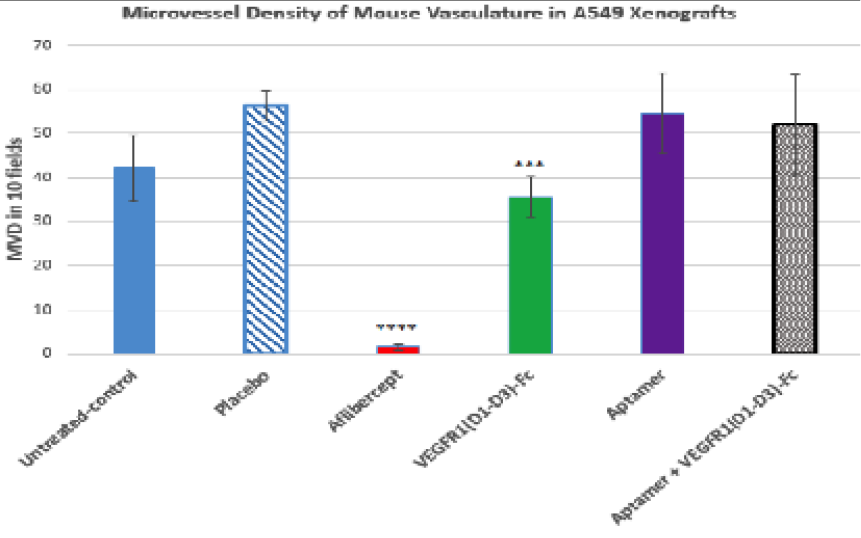
Graph showing microvessel density (MVD)
of tumor vasculature.
***, p≤0.001; ****, p≤0.0001


