

Estimation of Honey Production in Beekeeping Enterprises from Eastern Part of Turkey through Some Data Mining Algorithms


Estimation of Honey Production in Beekeeping Enterprises from Eastern Part of Turkey through Some Data Mining Algorithms
Adem Aksoy1, Yakup Erdal Ertürk2, Selim Erdoğan3, Ecevit Eyduran3 and Mohammad Masood Tariq4,*
1Department of Agricultural Economics, Agricultural Faculty, Atatürk University, Erzurum, Turkey
2Department of Agricultural Economics, Agricultural Faculty, Igdir University, Igdir, Turkey
3Department of Business, Faculty of Economics and Business Administration, Igdir University, Igdir, Turkey
4Centre of Advanced Studies in Vaccinology and Biotechnology, University of Balochistan, Quetta, Pakistan
ABSTRACT
The aim of this study was to develop a honey production model for 180 beekeeping enterprises at Agri, Kars and Erzurum provinces of Turkey and to identify factors affecting honey production through CART, CHAID and MARS data mining algorithms, which are more flexible compared to classical approaches. Several potential predictors in the survey were age of enterprise, province of enterprise (Agri, Kars and Erzurum), educational level, membership status of enterprise to an association of beekeepers (member and nonmember), other activities except for beekeeping (yes and no), number of full beehives, bee race (Caucasian, Carniolan, Italian and Crossbred), and frequency of changing queen bee. MARS outperformed multiple linear regression, and CART in honey yield per hive. No solution for CHAID was generated. In CART algorithm, the highest honey yield per hive (51.250 kg) was obtained from the 33.5 or younger enterprises that performed only beekeeping activity. The four most influential predictors in the MARS were age of enterprise (100%), number of full beehives (100%), other races (97%), and other works except for beekeeping (90%). The best performance order was MARS (r=0.920) > CART (r=0.619) > multiple linear regression (r=0.286), which indicated that MARS outperformed other approaches. MARS reflected that the main and interaction effects of socioeconomic (age of enterprise, province of enterprise, educational level, membership status, other works except for beekeeping and number of full beehives), biological predictors (bee race and frequency of changing queen bee) affected honey yield per hive. As a result, it is recommended that the effect of socioeconomic and biological predictors on the yield should be assessed jointly for further studies.
Article Information
Received 14 January 2018
Revised 02 March 2018
Accepted 28 March 2018
Available online 21 September 2018
Authors’ Contribution
AA conceived, designed the study and collected the data. EE statistically analysed the data. YEE and MMT interpreted data and wrote the article. SE helped in interpreting the data.
Key words
Beekeeping enterprise, Honey yield, Production economics, Data mining, MARS.
DOI: http://dx.doi.org/10.17582/journal.pjz/2018.50.6.2199.2207
* Corresponding author: [email protected]
0030-9923/2018/0006-2199 $ 9.00/0
Copyright 2018 Zoological Society of Pakistan
Introduction
Honey, which is essential for maintaining healthy nourishment and body functions of the humans, is a natural food generated by honeybees from nectar of plants or secretion of flowers, and contains 80-85% carbohydrates, 15-17% water, % 0.3 protein and trace amounts of amino acids and vitamins (Okpokiri et al., 2015). The honeybee is a notable pollinator for agricultural crops and wild grown plants in nature and the perfect organism is liable for one-third of herbal food production through pollution operation (Klein et al., 2007). There are many advantages of beekeeping activity i.e. extra revenue in shorter time period, satisfying the daily needs of the enterprise’s family, contributing to the pollination and the effective use of family labor (Karadas and Kadirhanogullari, 2017), the conservation of biodiversity (Al-Ghamdi et al., 2017). In addition, honey production is unescapable for not only producing healthy and intelligent next generations but also developing rural development. Due to these reasons, more studies should be conducted to ensure the sustainability of the honey related productions. Several effective predictors affecting the profitability of enterprises i.e. queen quality, floral composition, technology type, ecological conditions, beehive type, queen’s age, and managerial applications in regard to honey yield per beehive should be taken into consideration (Al-Ghamdi et al., 2017).
Many previous studies have evaluated the beekeeping enterprises (Karadas and Kadirhanogullari, 2017) in terms of characterization of socioeconomic factors (Poornima, 2014; Adgaba et al., 2014; Castellenos-Potenciano et al., 2015), determination of the economic analysis (Kezic et al., 2008; Marinkovic and Nedic, 2010) and efficiency (Makri et al., 2015) through classical statistical approaches i.e. chi-square, multiple linear regression and principle component analyses. Aksoy et al. (2017) found influential factors (enterprise’s age, number of beehives, bee race, beekeeping type and variable cost) regarding to honey yield per beehive. Dinka and Kumsa (2016) determined the influential predictors for honey production of enterprises in Ethiopia. Okpokiri et al. (2015) reported data on profitability of honey production and the related influential predictors in Nigeria through multiple linear regression (enterprise’s age, revenue, cooperative membership, credit access, household size and experience) and Cobb Douglas production function (labor, capital, rent, and distance to enterprise unit) analyses. Abuje et al. (2017) examined the effect of number of beehives, credit status, extension service, honey harvesting technique, hive location and position, enterprise’s experience, gender membership status and education level on honey yield per hive for small-scale beekeeping enterprises of Kenya. Mujuni et al. (2012) studied honey yield per hive from different hive types for the beekeeping enterprises in Western Uganda and examined the adaptation level of the beekeepers to the relevant technology. Masuku (2013) ascertained predictors (colony size and enterprise’s experience) which affected total honey production for small beekeepers in Swaziland. Al-Ghamdi et al. (2017) presented the data on the profitability and productivity of honey production amount in traditional and box beehives. The effect of hive type on honey production was reported by Vural and Karaman (2010). Castellenos-Potenciano et al. (2015) handled beehive number, total working time in apicultural activity etc. together with honey production. Kezic et al. (2008) addressed number of hives and enterprises, average of honey yield per beehive, revenue etc. However, the effect of socio-economic and biological factors on honey production has not yet been inspected conjointly through both routine statistical approaches, and especially powerful non-parametric data mining approaches.
For estimation of honey production per hive, Karadas and Kadirhanogullari (2017) evaluated the effect of the influential factors selected by Exhaustive CHAID (number of full beehives, annual working period, the control number of beehives in summer season), CART (number of full beehives, annual working period, and enterprise’s age) and MARS (number of full beehives, autumn and spring feeding, annual working period, enterprise’s educational degree, enterprise’s age, frequency of changing queen, and time spent in plateau) data mining algorithms on the honey yield per beehive, a prominent factor influencing the profitability of beekeeping enterprises. In apicultural production, more reported data on the characterization of statistically important predictors influencing honey production, which is of economically prominent importance, are needed yet with the support of the aforementioned artificial intelligence algorithms which solve most complexed regression problems in applied scientific fields.
Thus, the main objective of this work was to develop a honey production model for beekeeping enterprises at Agri, Kars and Erzurum Provinces of Turkey and to recognize influential factors in honey production through MARS and CHAID data mining algorithms.
Materials and methods
Data collection and sampling
The current questionnaire study was conducted on 180 beekeeping enterprises at Agri, Kars and Erzurum provinces of Turkey so as to identify influential factors on the honey production based on MARS and CHAID data mining algorithms. The proportional sampling method was used for estimating suitable sample size in enterprises therein, as described by Aksoy et al. (2017).
Study area
Agrı, Erzurum and Kars provinces in the Eastern Anatolia Region of Turkey are among the most popular provinces in apiculture. The flowering period in this Region starts in the middle of April month and plentiful nectar sustains from the second week of July to the end of August, which is harvest time in the region (Ahmet and Demir, 2005).
The handled predictors
To predict honey production as a response variable, several potential predictors in the survey were recorded such as age of enterprise, province of enterprise (Agri, Kars and Erzurum), enterprise’s educational level, membership status of enterprise to association of beekeepers (member and nonmember), other activities except for beekeeping (yes and no), number of full beehives, bee race (Caucasian, Carniolan, Italian and Crossbred), and frequency of changing queen bee. Descriptive statistics of the response variable and the predictors are summarized in Table I.
Table I.- Descriptive statistics of the handled variables.
|
Variables |
Mean±SD |
|
|
Honey yield per beehive (kg) |
11.25±8.45 |
|
|
Age of the enterprise (year) |
48.90±11.00 |
|
|
Number of full beehives |
168.1±138.6 |
|
|
Province* |
Freq. (%) |
|
|
Agri* |
54 (30.0) |
|
|
Erzurum |
72 (40.0) |
|
|
Kars |
54 (30.0) |
|
|
Educational level* |
Freq. (%) |
|
|
Literate-illiterate |
8 (4.4) |
|
|
Primary-Secondary School |
78 (43.3) |
|
|
High School |
62 (34.4) |
|
|
Bachelor |
32 (17.8) |
|
|
Membership status* |
Freq. (%) |
|
|
Member |
168 (93.3) |
|
|
Non-Member |
12 (6.7) |
|
|
Other works except for beekeeping* |
Freq. (%) |
|
|
Available |
145 (80.6) |
|
|
Unavailable |
35 (19.4) |
|
|
Frequency of chancing Queen bee* |
Freq. (%) |
|
|
Up to 2 years |
121 (67.2) |
|
|
Longer than 2 years |
59 (32.8) |
|
|
Bee race* |
Freq. (%) |
|
|
Caucasian race |
151 (83.9) |
|
|
Other races (Carniolan, Italian and Crossbred) |
29 (16.1) |
|
*Number of enterprises.
Statistical analysis
Multiple linear regression analysis was also specified by using the following formula:

Where, Y is a response variable (honey yield per hive), β0 is an intercept, βi is the ith parameter, Xi is the ith predictor (independent variable) and ε is a random error.
The regression parameters were estimated with the ordinary least squares method and the assumptions underlying the multiple linear regression model were confirmed (the normal distribution of residuals using the Shapiro-Wilk W test, the lack of residual autocorrelation using the Durbin-Watson test and the residual homoscedasticity using the F test). Within the scope of a general linear model, all predictors studied here were handled.
The tree-based method used for the predicting honey yield per hive was CART algorithm (Breiman et al., 1984). In the construction of the tree diagram, pruning according to variance was activated as a stopping rule in IBM SPSS software and the minimum parent and child node size was considered 4:2 as an additional stopping criterion. Moreover, a 10-fold cross-validation with a one-standard error rule was used in order to obtain the most optimum regression tree structure with appropriate complexity and apply to the training data set.
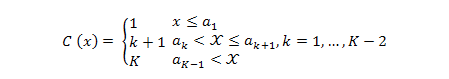
CHAID algorithm just utilizes nominal or ordinal predictors and therefore continuous predictors are converted into ordinal predictors prior to specifying the following algorithm. For a given set of break points a1, a2….., aK-1 (in ascending order), a recognized x is mapped into category C (x) herein below:
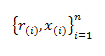
When K is the chosen number of bins, for the approximation of the break points xi frequency weights are unified in calculating the ranks. In the case of being ties, the average rank is used. The rank and the respective values in ascending order can be designated as:
For k = 0 to (K−1), set:
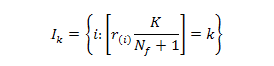
Where, x displays the floor integer of x. If Ik is not empty, ik=max {i : i ϵ Ik}. The adjustment is performed for the break points by equalizing to the x values respective to the ik, not including the largest (Breiman et al., 1984).
Bonferroni adjustment was made for CHAID algorithm so as to estimate adjusted P values of F values. The CHAID tree based algorithm with an automatically pruning process in removing unnecessary nodes in the decision tree uses F significance test (Ali et al., 2015). A ten-fold cross-validation is accepted in the current investigation. MARS was specified to produce a powerful prediction model detecting the predictors and their interaction effects that affect dependent continuous variable (honey production).
Finally, the statistical notation of the MARS data mining algorithm can be written as follows:

Where, ý is the predicted value of the response variable (honey production), β0 is a constant, hkm (Xv(k,m)) is the basis function, where v(k,m) is an index of the predictor used in the mth component of the kth product and Km is the parameter controlling the order of interaction.
The maximum number of basis functions in the current analysis was 200 and the 5th-order interactions were considered based on ensuring the smallest GCV. Afterwards building the most complex MARS model, the basis functions that could not provide contribution much to the model quality performance were removed in the solution process of the so-called pruning, depending upon the generalized cross-validation error (GCV) (Koronacki and Ćwik, 2005):

Where, n is the number of training cases, yi is the observed value of a response variable (honey production), yip is the predicted value of a response variable and M (λ) is a penalty function for the complexity of the model with λ terms.
The model quality (goodness of fit) criteria for establishing their predictive accuracy of the MARS algorithms are expressed as follows:
Coefficient of Determination

Standard Deviation Ratio

Pearson correlation coefficient between actual and predicted values in honey production (kg) (Koc et al., 2017). Where, Yi is the observed honey production (kg) value of ith enterprise, Ȳi is the predicted honey production (kg) of ith enterprise, Ȳ is the average of the honey production (kg) obtained by all the enterprises, εi is the residual value of ith enterprise, έ is the average of the residual values, k is number of terms in the MARS model, and n is the number of total enterprises. The residual of each enterprise is εi = Yi - Ŷi (Aytekin et al., 2018).
The MARS model that has the lowest GCV, SDRATIO and the greatest coefficient of determination (R2) and Pearson coefficient (r) between observed and predicted values in honey yield per hive was considered as the best one. MARS and multiple linear regression analyses were done through the package ‘earth’ of R software. CART and CHAID analyses were performed with the IBM SPSS 23 software.
Results and discussion
Age of enterprise (52), number of full beehives (66), time period spent in the plateau (118 days), and working period of the enterprise in beekeeping activity (64 days) were averagely estimated by Karadas and Kadirhanogullari (2017) working on 85 enterprises in only Igdir Province of Turkey. In the present survey containing Agri, Erzurum and Kars provinces of Turkey, age of enterprise (48.90) and number of full beehives (168.1) were found. Al-Ghamdi et al. (2017) admitted the age (46.6, 45.3 and 48.1), and experience (19, 14 and 20.5 years) in Saudi Arabia for beekeeping enterprises who had traditional hive, box hive, and traditional-box hives. Kiros and Tsegay (2017) found average age of the enterprise (40.2) and average enterprise’s experience of 13.5 years for beekeepers of the Ethiopia.
Table II.- ANOVA table of multiple linear regression for honey per hive yield.
|
Df |
SS |
MS |
F value |
Prb(>F) |
|
|
Province of enterprise |
2 |
4.9 |
2.43 |
0.0348 |
0.96584 |
|
Age of enterprise |
1 |
314.7 |
314.69 |
4.5013 |
0.03533* |
|
Educational level |
3 |
243.9 |
81.30 |
1.1629 |
0.32556 |
|
Membership status |
1 |
42.0 |
42.05 |
0.6014 |
0.43912 |
|
Other works |
1 |
329.3 |
329.26 |
4.7098 |
0.03139* |
|
Bee race |
1 |
4.2 |
4.22 |
0.0603 |
0.80625 |
|
Frequency of chancing queen |
1 |
68.8 |
68.80 |
0.9842 |
0.32260 |
|
Number of full hives |
1 |
39.6 |
39.57 |
0.5660 |
0.45289 |
|
Residuals |
168 |
11744.8 |
69.91 |
*P<0.05
The prediction of honey yield per hive as an indicator of productivity in beekeeping enterprises was made based on multiple linear regression, MARS, CART and CHAID algorithms. No solution on the prediction was made for tree-based CHAID algorithm. As a classical approach, multiple linear regression allowed us to predict honey yield per hive with much smaller predictive accuracy of 0.286 r (P<0.01), 0.082 R2, 0.022 Adjusted R2 and 0.96 SD ratio. ANOVA table of multiple linear regression for honey per hive yield is presented in Table II. Among the evaluated predictors, only two ones i.e. “age of enterprise” and “other works except for beekeeping” was significant (P<0.05). Masuku (2013) addressed that experience of the enterprise (P<0.05) and colony size (P<0.01) had an important impact on total honey production with the predictive accuracy of 0.824 R2 but production cost, family size, age and gender of enterprise affected the production insignificantly.
As a sophistical approach, the prediction model constructed by MARS algorithm permitted us to predict honey yield per hive with much better predictive accuracy of 0.920 r (P<0.01), 0.846 R2 compared with the estimates of Karadas and Kadirhanogullari (2017) in the MARS. SD ratio of the MARS was found as 0.393, indicating that the MARS model produced a good fit. The current SD ratio estimate in the predictive performance was found better than those estimated by Karadas and Kadirhanogullari (2017) for Exhaustive CHAID (0.610), CHAID (0.639), CART (0.667), MARS (0.408), Multilayer perceptron (MLP) (0.463) as a type of ANNs, respectively as a result of small sample size. Karadas and Kadirhanogullari (2017) declared that the significance order of the Pearson correlation coefficients between observed and predicted values in honey yield per hive was MARS (0.913) > ANN (0.885) > Exhaustive CHAID (0.786) > CHAID (0.769) > CART (0.744), (P<0.01), which were found lower than the present MARS result (0.920). In the MARS algorithm, significant main and interaction effects of number of full beehives, feeding in autumn and spring seasons, working period in beekeeping, enterprise’s educational level, age of enterprise, frequency of changing queen bee and time period spent in plateau were significant, which was different from basis function terms and the respective coefficients of influential predictors in the present MARS predictive model. When evaluating the present and earlier results, it could be concluded that socioeconomic and biological predictors should be considered simultaneously for honey yield per hive trait. Abuje et al. (2017) mentioned that information on socioeconomic factors was important in beekeeping activity.
The higher predictive performance of the MARS algorithm was noted by Karadas and Kadirhanogullari (2017), which was almost in line with the present MARS result. No information on evaluating relative importance of the predictors was found in the previous study contrarily to our study.
The present estimate of 11.25 kg in honey yield per hive from the Eastern part of Turkey was higher compared with the estimate (9.777 kg) recorded by Karadas and Kadirhanogullari (2017) in Igdir province of Turkey, whereas the present value was lower than those reported by several earlier authors i.e. Gebretsadik et al. (2016) (13.6 to 22.04 kg) in Ethiopia, Haftu et al. (2015) (22.6 kg) in Northern Etiophia, Kumova and Korkmaz (2000) (15.4 kg) in the Mediterranean Region of Turkey, Marinkovic and Nedic (2010) in Serbia, and Castellenos-Potenciano et al. (2015) (29 kg) in Mexico Gulf, Kiros and Tsegay (2017) (approx. 7.0 kg) per traditional hive in Oromiya Regional State, Ethiopia. Vaziritabar and Esmaeilzade (2016) estimated it for traditional log hive (10.36 kg), Iranian top bar hive (15.46 kg), Iranian longs troth hive (30.09 kg), wooden open floor hive (40.71 kg) and Polystyrene open floor (45.09 kg) in Karaj state of Iran. Conradie and Nortjé (2008), in a study conducted in South Africa, recorded more than twice as 25.1-26.9 kg. Al-Ghamdi et al. (2017) found it much lower for box hive (6.6 kg), traditional hive (3.7 kg) with the mean of 4.8 kg in Saudi Arabia in comparison with the yield amount in our study. Mujuni et al. (2012) obtained lower averages in the honey yield per hive for traditional (6.2 kg), top bar (4.5), Johnson (3.3 kg) and Langstroth (9.1 kg) beehive types when compared with the present estimate of 11.25 kg. Kiros and Tsegay (2017) obtained higher yield of 16.2 kg per transitional hive and 22 kg per frame hive in Ethiopia. Kinati et al. (2013) reported an average of 7.20 kg per traditional hive, 14.70 kg per transitional hive, and 23.37 kg per movable hive in honey yield for the beekeeping enterprises in South Western Ethiopia. The variation was attributable to floral composition, type and number of hive, age and quality of queen bee, size of bee colony, frequency of changing queen bee, bee race, climate conditions, and socio-economic factors (age, experience, and educational level of the enterprise) etc.
Karadas and Kadirhanogullari (2017) revealed that number of full beehives, working period in apiculture during year and control frequency of beehives in summer affected honey yield per hive in regression tree diagram constructed by the Exhaustive CHAID algorithm with the predictive accuracy of 0.63 R2, but they reported that number of full beehives, working period in apiculture during year and age of the enterprise were influential predictors for honey yield per hive in tree-based CART algorithm with the predictive performance of 0.55 R2. These earlier results were not in agreement with those reported in our present study. Because, no results for CHAID algorithm was found in the present survey. The algorithm had only root nodes.
The variation is ascribable to the dissimilarity in sample size, predictors, the level of the categorical predictors, interaction effects etc.
Abuje et al. (2017) acknowledged that, in regression analysis based on the Cob Douglas function, number of beehives, enterprise’s educational level, price per kg, gender of the enterprise, credit status, membership status, extension services, and harvesting method were significant predictors affecting honey yield per hive (P<0.05) with the predictive accuracy of 0.5608 R2, which was lower than the present estimate in the MARS model, but higher than that found in the multiple linear regression studied here. Abuje et al. (2017) notified that usage of more hives, higher educational level, enriched producer prices, available credit, extension service, membership, and harvesting method would be expected to increase honey yield, which was not in line with the current results reported for the CART.
The visual result of CART algorithm applied for predicting honey yield per hive as an indicator of the productivity of beekeeper enterprises is displayed in Figure 1. The correlation coefficient between the measured and the predicted values in honey yield per hive was found as 0.619 (P<0.01) for CART tree-based algorithm. Coefficient of determination as a goodness of fit criterion was 0.383 (R2) for the tree-based algorithm. Besides, SD ratio, the rate of residuals’ standard deviation to standard deviation of the observed values, was estimated 0.785, which showed a poor fit, as also reported by Grzesiak and Zaborski (2012), in the prediction of honey yield per hive from predictors i.e. number of full hives, other works, age and educational level of the enterprise, selected by the CART. The highest normalized importance among the predictors was age of the enterprise (100%), means that it is a predictor that contributed mostly to the tree diagram. In the CART regression tree structure, Node 0, as a root node, was split into two smaller subgroups i.e. Node 1 (the enterprises of 34.5 ages or younger) and Node 2 (the enterprises older than 34.5 ages) according to age of the enterprise with the averages of 16.772 kg vs. 10.631 kg in honey yield per hive. The normalized significance order of predictors in the CART was age of enterprise (100%), other works (58.9%), number of full hives (57.6%), bee race (36.0%), province (25.9%), educational level (20.4%) and membership status (1.4%), respectively.
Node 1 was divided into two smaller subgroups Nodes 3 and 4 by means of other works of the enterprise (10.919 kg vs. 31.989 kg). The 34.5 or younger enterprises who worked other works except for beekeeping activity were assigned to Node 3 (a terminal node), whereas the enterprises older than 34.5 who worked only beekeeping activity were allocated to Node 4, which were split by enterprise’s age into two smaller subgroups i.e. Node 7 (51.250 kg) and Node 8 (19.148 kg). Node 7 was expressed as the subgroup of the 33.5 or younger enterprises who performed only beekeeping activity. Node 8 was the subgroup of the enterprises that performed only beekeeping activity at the age interval of (33.5; 34.5). The enterprises in the Node 7 could be said more successful than those in Node 8.
Node 2 was discriminated by the educational level of enterprise into two smaller subgroups named Node 5 (the enterprises older than 34.5 in the fourth educational level) and Node 6 (the enterprises older than 34.5 in the first, second and three educational levels) (7.799 kg vs. 11.172 kg). Node 5 was a terminal node where a further splitting process is impossible for subsequent depths of the constructed CART regression tree diagram.
Node 6 was branched into two smaller subgroups (Nodes 9 and 10) in relation to the predictor “age of the enterprise”. Node 9 was the subgroup of the enterprises with 34.5 < age < 51.5 in the first, second and three educational levels (12.530 kg). Node 10 was the subgroup of the enterprises older than 51.5 in the same educational levels (9.552 kg). Node 9 was divided into Nodes 11 and 12 in relation to the age of enterprise again (12.026 kg vs. 21.354 kg). Node 11 was the subgroup of the enterprises with 34.5 < age < 51.5 who had 375 full hives or smaller in the first, second and three educational levels, while Node 12 was had more than 375 full hives in the first, second and three educational levels, and was split into two smaller subgroups (Nodes 13 and 14) with respect to the age of enterprise. Node 13 was the subgroup of the 45 or older enterprises among those older than 34.5 who had full fives more than 375 in the first three educational levels. Node 14 was the subgroup of the enterprises older than 45.5 who had full fives more than 375 in the first three educational levels.
The present CART results were not agreement with those reported by Karadas and Kadirhanogullari (2015), who revealed factors (number of full hives, working time in beekeeping activity age of enterprise) that affected honey yield per hive for Igdir beekeeping enterprises in the year 2014 and effect of other factors on the yield in the earlier study. The difference was attributable to the variation in the handled predictors, sample size, floral composition, bee race, climatic and managerial conditions, etc.
The MARS results for predicting honey yield per hive from the selected predictors are given Supplementary Table I. Importance order of predictors in the MARS were age of enterprise (100%), number of full beehives (100%), other races (97%), other works except for beekeeping (90%), followed by Erzurum Province (69%), the second educational level (69%), the third educational level (67%), being non-member (55%), the fourth educational level (50%), Kars Province (48%), queen upto 2 (18%), respectively.
It was understood that the effect of age of enterprise on honey yield per hive changed based on number of full hives, province, other works, bee race, educational level, and membership status etc. (Supplementary Table I). For example when only non-member enterprises (as the third term in Supplementary Table I) was considered, honey yield per hive would be expected to increase by 9.881 kg; however, if these enterprises used other bee races (14th term of the MARS prediction equation), an increase of 13.478 kg would be expected. The present MARS results in R software were not in agreement with those achieved by Karadas and Kadirhanogullari (2015), who found number of full hives, autumn and spring feeding, working time in beekeeping, educational degree, age of enterprise, frequency of changing queen bee, and time period spent in plateau through STATISTICA software. The difference was attributable to the discrepancy in the handled predictors i.e. sample size, floral composition, bee race, climatic, statistical software and managerial conditions. In the CART algorithm, interaction effects of predictors were masked at big proportion compared with the MARS with the high accuracy.
Conclusion
Beekeeping enterprise is essential for providing extra income, the money need of family, the effectual use of family labor in developing rural economy and producing healthy generations, and more especially pollination, the conservation of biodiversity. To ascertain the influential predictors with the goal of making more accurate interpretation in honey yield per hive, it is unavoidable to use robust statistical approaches. With these reasons, we evaluated the suitability and the predictive performances of multiple linear regression, some data mining algorithms (CART, CHAID and MARS). No solution for CHAID algorithm was provided as result of obtaining only a root node. The best performance order was MARS (r=0.920) > CART (r=0.619) > Multiple linear regression (r=0.286), which indicated that MARS outperformed other approaches. The main and interaction effects of socioeconomic (age of enterprise, province of enterprise, educational level, membership status, other works except for beekeeping and number of full beehives), biological predictors (bee race and frequency of changing queen bee) affected honey yield per hive.
It is therefore imperative that the effect of socioeconomic and biological predictors should be assessed jointly on the yield.
There is supplementary material associated with this article. Access the material online at: http://dx.doi.org/10.17582/journal.pjz/2018.50.6.2199.2207
Statement of conflict of interest
Authors have declared no conflict of interest.
References
Abuje, V., Nyangweso, P., Mwakubo, S. and Chepng’eno, W., 2017. Determinants of honey production in Kenya; Case of Baringo County. Afri. J. Agric. Environ, 3: 1-19.
Adgaba, N., Al-Ghamdi1, A., Shenkute, A.G., Ismaiel, S., Al-Kahtani, S., Tadess, Y., Ansari, M.J., Abebe, W.M. and Abdulaziz, Q.A., 2014. Socio-economic analysis of beekeeping and determinants of box hive technology adoption in the kingdom of Saudi Arabia. J. Anim. Pl. Sci., 24: 1876-1884.
Ahmet, G.A. and Demir, M., 2015. Beekeeping potential in Turkey. Bee World, 86: 114-119. https://doi.org/10.1080/0005772X.2005.11417326
Ali, M., Eyduran, E., Tariq, M.M., Tirink, C., Abbas, F., Bajwa, M.A., Baloch, M.H., Nizamani, A.H., Waheed, A., Awan, M.A., Shah, S.H., Ahmad, Z. and Jan, S. 2015. Comparison of artificial neural network and decision tree algorithms used for predicting live weight at post weaning period from some biometrical characteristics in Harnai Sheep. Pakistan J. Zool., 47: 1579-1585.
Aytekin, İ., Eyduran, E., Karadas, K., Akşahan, R. and Keskin, İ. 2018. Prediction of fattening final live weight from some body measurements and fattening period in young bulls of crossbred and exotic breeds using MARS data mining algorithm. Pakistan J. Zool., 50: 189-195.
Aksoy, A., Sari, M.M. and Terin, M., 2017. Economic structure of beekeeping sector in Erzurum Province. Turk. J. Agric. Nat. Sci., 4: 434-440.
Al-Ghamdi, A.A., Adgaba, N., Tadesse, Y., Getachew, A. and Al-Maktary, A.A., 2017. Comparative study on the dynamics and performances of Apis mellifera jemenitica and imported hybrid honeybee colonies in southwestern Saudi Arabia. Saudi J. biol. Sci., 24: 1086-1093. https://doi.org/10.1016/j.sjbs.2017.01.008
Breiman, L., Friedman, J.H., Olshen, R.A. and Stone, C.I., 1984. Classification and regression trees. Wadsworth, Belmont, California, USA.
Castellanos-Potenciano, B.P., Gallardo-Lopez, F., Díaz-Padilla, G., Perez-Vazquez, A., Landeros-Sanchez, C. and Sol-Sanchez, A., 2015. Apiculture in the humid tropics: Socio-economic stratification and beekeeper production technology along the Gulf of Mexico. Glob. Sci. Res. J., 3: 321-329.
Conradie, B. and Northjé, B., 2008. Survey of beekeeping in South Africa. Working Paper No. 221, Centre for Social Science Research (CSSR), Social Surveys Unit.
Dinka, J. and Kumsa, T., 2016. Factors affecting honey production in Ambo district, West Shewa Zone, Oromia Regional State, Ethiopia. Int. J. Econ. Busin. Manage., 2: 170-182.
Gebretsadik, T. and Negash, D., 2016. Honeybee production system, challenges and opportunities in selected districts of Gedeo Zone, Southern Nation, Nationalities and Peoples Regional State, Ethiopia. Int. J. Res. Granthaalayah, 4: 49-63.
Grzesiak, W. and Zaborski, D., 2012. Examples of the use of data mining methods in animal breeding. In: Data mining applications in engineering and medicine (ed. A. Karahoca). InTech, Rijeka, Croatia. pp. 303-324. https://doi.org/10.5772/50893
Haftu, K., Daniel, D., Gebru, B., Tsegay, G., Guash, A., Guesh, G., Mulualem, Z. and Gebrekiros, G., 2015. Analysis of honey bee production opportunities and challenges in central Zone of Tigray, Northern Ethiopia. Int. J. Sci. Res. Publ., 5: 1-6.
Karadas, K. and Kadirhanogullari, I.H., 2017. Predicting honey production using data mining and artificial neural network algorithms in apiculture. Pakistan J. Zool., 49: 1611-1619. https://doi.org/10.17582/journal.pjz/2017.49.5.1611.1619
Kezic, J., Bobic, B.S., Svecnjak, L., Drazic, M., Grgic, Z. and Kezic, N., 2008. Economic evaluation of beekeeping in Karlovacka County. J. Cent. Europ. Agric., 9: 615-620.
Kinati, C., Tolemariam, T. and Debele, K., 2013. Assessment of honey production and marketing system in Gomma District, South Western Ethiopia. Greener J. Busin. Manage. Stud., 3: 99-107. https://doi.org/10.15580/GJBMS.2013.3.09071257
Kiros, W. and Tsegay, T., 2017. Honey-bee production practices and hive technology preferences in Jimma and Illubabor Zone of Oromiya Regional State, Ethiopia. Acta Univ. Sapient. Agric. Environ., 9: 31-43. https://doi.org/10.1515/ausae-2017-0003
Klein, A.M., Vaissiere, B.E., Cane, J.H., Steffan-Dewenter, I., Cunningham, S.A., Kremen, C. and Tscharntke, T., 2007. Importance of pollinators in changing landscapes for World crops. Proc. Res. Soc. B, 274: 303-313. https://doi.org/10.1098/rspb.2006.3721
Koc, Y., Eyduran, E. and Akbulut, O. 2017. Application of regression tree method for different data from animal science. Pakistan J. Zool., 49: 599-607.
Kornacki, J. and Ćwik, J., 2005. Statistical learning systems. WNT, Warsaw.
Kumova, U. and Korkmaz, A., 2000. The importance of Çukurova region on beekeeping in Turkey. Anim. Prod., 41: 48-54.
Makri, P., Papanagiotou, P. and Papanagiotou, E., 2015. Efficiency and economic analysis of Greek beekeeping farms. Bulgarian J. agric. Sci., 21: 479-484.
Marinkovic, S. and Nedic, N., 2010. Analysis of production and competitiveness on small beekeeping farms in selected districts of Serbia. Applied Studies in Agribusiness and Commerce. APSTRACT Agroinform Publishing House, Budapest. http://ageconsearch.umn.edu/bitstream/91136/2/10_MarinkovicApstract.pdf
Masuku, M.B., 2013. Socioeconomic analysis of beekeeping in Swaziland: A case study of the Manzini Region, Swaziland. J. Develop. Agric. Econ., 5: 236-241.
Mujuni, A., Natukunda, K. and Kugonza, D.R., 2012. Factors affecting the adoption of beekeeping and associated technologies in Bushenyi District, Western Uganda. Livest. Res. Rural Develop., 24: Article#133. http://www.lrrd.org/lrrd24/8/muju24133.htm
Okpokiri, C.I., Nwachukwu, I.N. and Onwusiribe, C.N., 2015. Determinants and Profitability of honey production in Ikwuano local Government Area, Abia State, Nigeria. Scient. Pap. Ser. Manage. Econ. Engin. Agric. Rural Develop., 15: 211-216.
Poornima, B.S., 2014. Social and economic auditing of beekeeping in Uttara Kannada, India. Int. Res. J. biol. Sci., 3: 64-66.
Vaziritabar, S. and Esmaeilzade, S.M., 2016. Profitability and socio-economic analysis of beekeeping and honey production in Karaj State, Iran. J. Ent. Zool. Stud., 4: 1341-1350.
Vural, H. and Karaman, S., 2010. Socio-economic analysis of beekeeping and the effects of beehive types on honey production. Afri. J. agric. Res., 5: 3003-3008.
To share on other social networks, click on any share button. What are these?


