View larger version:
Download Original File
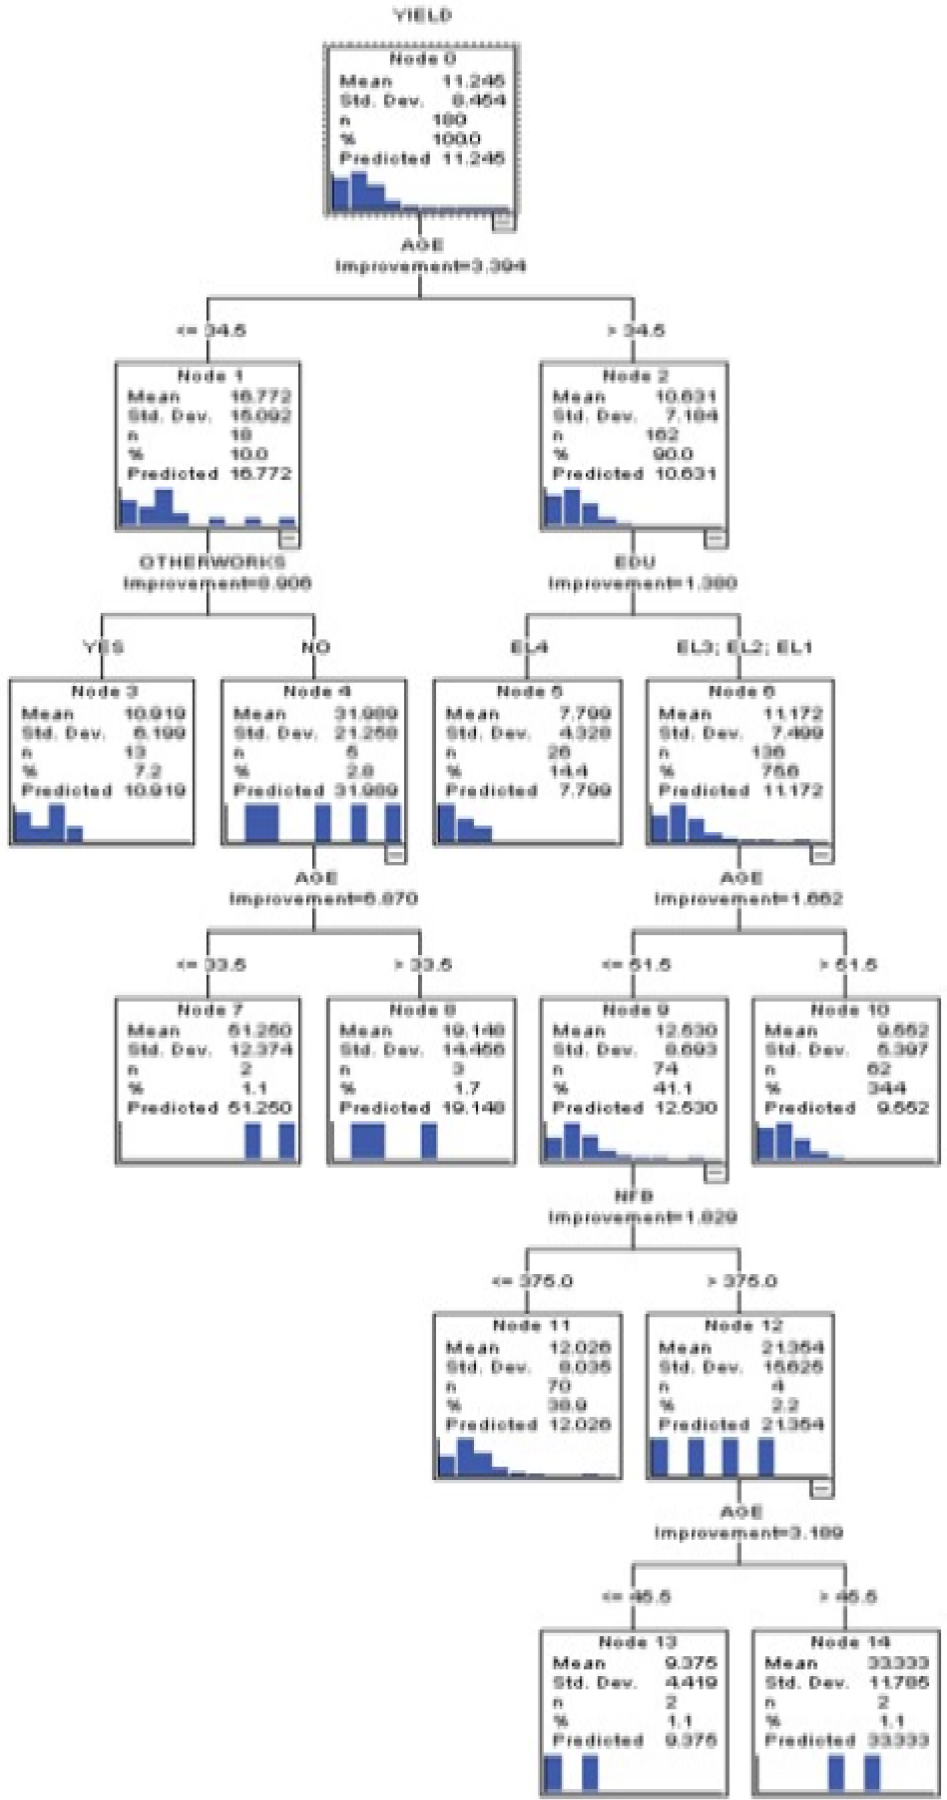
Fig. 1.
Regression tree diagram constructed by CART in the honey yield per hive.