

Estimation of Global Irradiation Parameters at Location of Migratory Birds in Iğdir, Turkey by Means of MARS Algorithm


Estimation of Global Irradiation Parameters at Location of Migratory Birds in Iğdir, Turkey by Means of MARS Algorithm
Gokhan Sahin1, Ecevit Eyduran2,*, Mete Turkoglu3 and Fatma Sahin2
1Department of Electric Electronic Engineering, Engineering Faculty, Iğdır University, Iğdır, Turkey
2Biometry Genetics Unit, Department of Animal Science, Agricultural Faculty, Iğdır University, Iğdır, Turkey
3General Directorate of Nature Protection and National Parks, Republic of Turkey Ministry of Forestry and Water Affairs, Iğdır, Turkey
ABSTRACT
This study aims at estimating sum of global irradiation amounts at location (lat. 40.07.16 North and long 43.35.00 East) of migratory birds found in Iğdır province of Turkey. In the estimation of global irradiation parameters (Hd: average daily sum of global irradiation per square meter and Hm: average annually sum of global irradiation per square meter), several predictors viz. ESTLOSTEMP (estimated losses due to temperature and low irradiance), ESTLOSANGREF (estimated loss due to angular reflectance effect), and COMPVLOSS (Combined Photo Voltaic system losses) were calculated. Estimation of global irradiation parameters was made through multivariate adaptive regression splines (MARS) data mining algorithm for multiple responses (Hd and Hm) with the support of R software program and the utility prediction equation was aimed to improve for further biodiversity investigations. To determine the predictive quality of the MARS algorithm, goodness of fit criteria viz. coefficient of determination (0.994 and 0.996 R2 for Hd and Hm), Generalized Cross Validation (0.000038 and 0.024024 GCV for Hd and Hm), Cross-Validation R2 (0.974 and 0.967 CVR2 for Hd and Hm), Residual Sum of Squares (0.00046 and 0.28829 RSS for Hd and Hm) and Standard Deviation Ratio (0.078 and 0.063 SDRATIO for Hd and Hm) were calculated for penalty= -1 in the package “earth” of the R software. MARS prediction equation was derived at the smallest estimates of GCV which is defined as the ratio of RSS to n (sample size) for penalty= -1. The smallest GCV values were set at number of terms (4). Goodness of fit criteria exhibited that the MARS prediction model had a very good fit for a cross validation of 3. As a result, the obtained results may be baseline information about global irradiation parameters at location of migratory birds in Iğdir, Turkey for next studies with the scope of global warming.
Article Information
Received 26 January 2018
Revised 02 March 2018
Accepted 17 March 2018
Available online 16 October 2018
Authors’ Contribution
GS conceived and designed the study. FS collected the data. EE statistically analyzed the data. EE and MT interpreted data and wrote the article. MT helped in interpreting the data.
Key words
Migratory bird, Global irradiation, Biodiversity, MARS algorithm, Data mining.
DOI: http://dx.doi.org/10.17582/journal.pjz/2018.50.6.2317.2324
* Corresponding author: ecevit.eyduran@gmail.com
0030-9923/2018/0006-2317 $ 9.00/0
Copyright 2018 Zoological Society of Pakistan
Introduction
Solar energy is subject to a constant bombardment of high subatomic energy particles (electrons and protons). Thus, electronic systems operating in space are exposed to radiation in the form of energetic charged particles, such as protons and heavy ions (Dale, 2013). Indeed, irradiation of these cells generates atomic displacements within the material. Point defects resulting from these displacements trap the minority electric product obtained by the illumination, which decreases the collection efficiency of the charges and varies the electrical characteristics of the cells (Ibrahim, 2011). Many authors have conducted difference studies with the aim of controlling and improving the behavior of solar cells in such a hostile (irradiated) environment (Kayali et al., 2012).
The solar cell is a device ensuring the transformation of light energy into electrical energy. To obtain solar energy, a set of chemical, mechanical and thermal treatments is required. Therefore, these treatments have more or less adverse effects on the performance of the final device (May et al., 2014). These effects can be characterized by ohmic and recombination optical losses (Goetzberger et al., 1998). The quality of the solar cell is closely related to its electronic (Mazhari et al., 1993) and electrical parameters (Ghitani et al., 1989). Thus, differential characterization techniques have been developed to improve the manufacturing steps of the solar cell. The aforementioned techniques are on the basis of measuring electrical effects (Ghitani et al., 1989; Salach-Bielecki, 2004; Barsoukov et al., 2005) of the imperfections involved in the solar energy (Sahin, 2016a, b). The photovoltaic conversion efficiency can be varied based on the temperature. The electrical performances of the solar energy are very sensitive to the temperature (Agroui, 1999; Yassine, 2009). Thus, on the incident energy totality, nearly 13% is converted into electrical energy. Much of this energy is dissipated as heat, which leads under radiation, at a relatively high operating temperature if energy which is not converted into electrical is not drained. In the characterization of solar energy, several described methods have been used previously (Yassine, 2009; Yusuf et al., 2017). Generally, these methods take a basis for interacting the solar cell with an external excitation, and considering the response of solar energy. The analysis of the response causes to ascertain the microscopic and macroscopic parameters which govern the solar energy working. To the best of our knowledge, there is lack of documentation about detecting the factors influencing solar irradiation parameters at the place of migratory birds. Of 483 migratory bird species coming to Turkey, 321 are present in Igdır province of Turkey. It is important in biodiversity studies to obtain information about revealing solar irradiation parameters at locations of migratory birds, which present baseline information for ornithologists in the next time. In this respect, taking into account this variability of illumination, we propose in this study to characterize a solar cell excited by a radiation, permitting to have a better modeling of the illumination of the solar cell surface. Our contribution in this work is to estimate global irradiation parameters at location of migratory birds in Iğdir, Turkey through MARS data mining algorithm.
Materials and Methods
In the current publication, sum of global irradiation amounts was predicted at location (Lat. 40.07.16 North and Long 43.35.00 East) of migratory birds that are available in migratory seasons of Iğdır province, Turkey.
Two global irradiation parameters (Hd: average daily sum of global irradiation per square meter and Hm: average annually sum of global irradiation per square meter) were accepted as dependent variables. For each of these global irradiation parameters, several explanatory variables such as ESTLOSTEMP (estimated losses due to temperature and low irradiance), ESTLOSANGREF (estimated loss due to angular reflectance effect), and COMPVLOSS (Combined Photo Voltaic system losses) were used. The combined photovoltaic systems performance of the PV system is affected by several parameters including temperature. The part of absorbed solar radiation that is not converted into the electricity converts into thermal energy and causes a decrease in electrical efficiency. This undesirable effect which leads to an increase in the PV cell’s working temperature and consequently causing a drop of conversion efficiency can be partially avoided by a proper method of heat extraction. PV/T solar systems consisting of photovoltaic modules and thermal collectors are applied to cool photovoltaic panel and use the heat generated by the panel and increase total energy output of the system. By proper circulation of a fluid with low inlet temperature, heat is extracted from the PV modules keeping the electrical efficiency at satisfactory values. The extracted thermal energy can be used in several ways, increasing total energy output of the system. Many researchers have investigated and proposed different methods for design and optimization of the PV/T systems to improve the system efficiency by cooling PV module and collecting more energy. The main concepts of hybrid PV/T systems have been presented by several researchers since 1978 (Sahin, 2016c; Kern and Russel, 1978; Hendrie, 1979; Florschuetz, 1979; Raghuraman, 1981; Cox and Raghuraman, 1985). Tripanagnostopoulos (2002) studied hybrid PV/T solar systems experimentally and used water and air to extract heat from the PV module rare surface. He used a hybrid system with air duct under the PV module for heat extraction with air circulation and another hybrid system with thermal unit of water circulation through a heat exchanger. In the system he tested, water was circulated in pipes with the flat surface of a copper sheet placed at the rear surface of the PV module and in thermal contact with it. Kalogirou and Tripanagnostopoulos (2006) proved analytically the potential benefits of PV/T systems compared to typical PV modules and presented justification of energy and cost results regarding system application. Their method could be considered as an estimation of the cost effectiveness of new solar energy systems in practice.
Estimation of global irradiation parameters was performed using multivariate adaptive regression splines (MARS) data mining algorithm for multiple responses (Hd and Hm) with the support of R software program and the beneficial prediction equation was intended to develop for subsequent biodiversity examinations.
In the MARS algorithm, we fit a multivariate regression model of the form (Samui, 2013; Kornacki and Cwik, 2005).
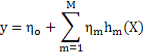
Where, the hm(X) is terms with a very specific form. All the terms created will be of the form:
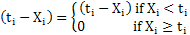

Spline basis functions, described in equations 1 and 2. Figure 1 (q = 1; t = 0.5) provides an illustration and terms of the form if we wish to include interactions. H(Xi, Xj)= any product of the univariate terms above.
The statistical notations of the MARS algorithm can be written as follows:

Where, ý is the predicted value of the response variable, β0 is a constant, hkm(Xv(k,m)) is the basis function, in which v(k,m) is an index of the predictors entered into the mth component of the kth product, Km is described as the parameter that limits the order of interaction in the MARS algorithm.
The maximum number of basis functions in the MARS modeling was defined at the first step as 100 and the MARS model was constructed by using interaction order of 2. After building the most complex MARS model, the basis functions which did not make contribution much to the level of the model predictive accuracy were removed from the process of the so-called pruning based on the following generalized cross-validation error (GCV) (Kornacki and Cwik, 2005; Hastie and Friedman, 2001).
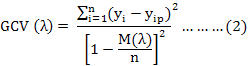
Where, n is the number of training cases, yi is the predicted value of a response variable, yip is the predicted value of a response variable, M(λ) presents a penalty function for the complexity of the specified model having λ terms (Put et al., 2004).
The model quality criteria for measuring their predictive performance of the MARS algorithms evaluated statistically here are presented as follows (Ali et al., 2015):
Coefficient of Determination

Adjusted Coefficient of Determination

Standard Deviation Ratio
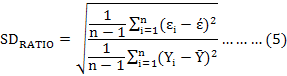
Where, Yi is the observed value of ith measurement, Ŷi is the predicted value of ith measurement, Ȳ is average of all the measurements, εi is the residual value of ith measurement, έ is the average of the residuals, k is the number of terms in the MARS model, and n is total number of samples. The residuals of each measurement are obtained with εi = Yi - Ŷi.
Pearson correlation coefficient between the observed and predicted values in each response variable (Jaworski, 2004; Garcia and Alvarez, 2014).
The MARS model with the smallest GCV, SDRATIO and the highest coefficient of determination (R2), cross-validation coefficient of determination (CVR2), and the highest Pearson correlation coefficient (r) between actual and predicted values was considered as the best one. All the statistical analyses were made through the R package program (R Core Team 2017, R Foundation for Statistical Computing, Vienna, Austria). We used penalty = -1 and cross-validation=3 in the package `earth` of R studio free software to improve predictive ability of the MARS algorithm. MARS prediction equation was achieved at the smallest estimates of GCV which is calculated as the ratio of RSS to n (sample size) for penalty = -1.
Results and discussion
Model quality criteria of the MARS models constructed for two global irradiation parameters (Hd: average daily sum of global irradiation per square meter and Hm: average annually sum of global irradiation per square meter) were calculated for proving predictive performances of the models. Coefficient of determination (0.994 and 0.996 R2 for Hd and Hm), Generalized Cross Validation (0.000038 and 0.024024 GCV for Hd and Hm), Cross-Validation R2 (0.974 and 0.967 CVR2 for Hd and Hm), Residual Sum of Squares (0.00046 and 0.28829 RSS for Hd and Hm) and Standard Deviation Ratio (0.078 and 0.063 SDRATIO for Hd and Hm) (Khan et al., 2014) were estimated for penalty= -1 activated in the package “earth” of the R studio free software, respectively. Results of these predictive performances displayed that the constructed MARS models gave excellent fit. These MARS models of Hd and Hm were found as follows: Hd=3.782 + 0.070*ESTLOSTEMP-0.042*max(0, 2006-YEAR)+ 0.015*max(0, YEAR-2006) and Hm=87.04 + 5.41*ESTLOSTEMP-1.49*max(0, 2006-YEAR)+ 0.76*max(0, YEAR-2006).
Among explanatory variables, only ESTLOSTEMP and YEAR explained the variability in Hd and Hm in the MARS models, very successfully. For the year 2006 or later, the second term ((0.070*ESTLOSTEMP-0.042*max(0, 2006-YEAR)) in the MARS prediction equation of Hd is equal to zero. Similarly, the second term ((5.41*ESTLOSTEMP-1.49*max(0, 2006-YEAR)) in Hm is equal to zero where max(0, 2006- YEAR)=0 when YEAR > 2006. Also, the aforementioned second terms had a positive impact on Hd and Hm for measurement years earlier than 2006. In other words, it could be said that earlier YEAR and higher ESTLOSTEMP may increase amounts of Hd and Hm. It was observed that the third terms ((0.015*max(0, YEAR-2006) and 0.76*max(0, YEAR-2006)) may increase amounts of Hd and Hm for later than 2006 year, but the terms become equal to zero for YEAR=2006. The available results showed that Hd and Hm amounts may change from year to year or depending upon ESTLOSTEMP from year to year (Grzesiak and Zaborski, 2012; Ali et al., 2015).
Graphs of model selection, residual and fitted values for Hd and Hm are shown in Figures 2 and 3, respectively.
The least difference between the bold black and red lines at the MARS model for Hd parameter was obtained with 4 terms (Fig. 2A); thus, the highest predictive performance was generated for Hd. All of absolute residual values estimated for Hd ranged between 0.000 and 0.010 (Fig. 2B). Figure 2C presents the scatter plot of residuals and fitted (predicted) values. The sixth, eighth and ninth measurements in Figure 2C can be outliers that have potential observations increasing residual variance of the MARS model. Figure 2D indicates residual QQ plot in regards to the normal distribution. Like in Figure 2C, three observations mentioned above caused the deviations from normality assumption of the residuals (Fig. 2D).
Only four terms enabled one to get the least difference between the bold black and red lines at the MARS model for Hm parameter (Fig. 3A); thus, the highest predictive performance for Hm was provided. 90% of absolute residual values estimated for Hm ranged between 0.000 and the value which is a little bit greater than 0.25 (Fig. 3B). Figure 3C illustrates the scatter plot of residuals and fitted (predicted) values. The first, second and seventh measurements in Figure 3C can be outliers, meaning that the potential observations increased residual variance of the MARS model. Figure 3D indicates residual QQ plot in regards to the normal distribution. Three potential observations referred above were the observations caused to the deviations from normality assumption of the residuals (Fig. 3D). Table I shows some values of Hd and Hm different estimated losses due to temperature and low irradiance, estimated loss due to angular reflectance effects and combined PV system losses (Sahin, 2016a, b, c).
Table I and Figures 4 and 5 show some Hd and Hm values. Figures 4 and 5 indicate the change of Hm and Hd according to year and ESTLOSTEMP. Figures 4A and 5A reflected that more increment was provided in the Hm and Hd until the year 2006 when compared to the increment after the year 2006. As ESTLOSTEMP increases, it was determined that Hm and Hd increased (Figs. 4B, 5B).
Table I.- The value change of the Hd and Hm according to year.
|
Year |
Slope |
Azimuth |
Hd |
Hm |
Nom inal power of PV system |
Estimated losses due to tempe rature and low irradiance |
Estimated losses due to angular reflectance effects |
Other losses (cables, invertors, etc.) |
Comb ined PV system losses |
|
2001 |
40 |
45 |
4.19 |
128 |
1 |
8.9% |
2.9% |
14% |
23.9 |
|
2002 |
40 |
45 |
4.24 |
129 |
1 |
8.9% |
2.9% |
14% |
23.9 |
|
2003 |
40 |
45 |
4.28 |
130 |
1 |
8.8% |
2.8% |
14% |
23.8 |
|
2004 |
40 |
45 |
4.31 |
131 |
1 |
8.7% |
2.8% |
14% |
23.7 |
|
2005 |
40 |
45 |
4.34 |
132 |
1 |
8.6% |
2.8% |
14% |
23.6 |
|
2006 |
40 |
45 |
4.37 |
133 |
1 |
8.5% |
2.8% |
14% |
23.6 |
|
2007 |
40 |
45 |
4.39 |
134 |
1 |
8.5% |
2.8% |
14% |
23.5 |
|
2008 |
40 |
45 |
4.41 |
134 |
1 |
8.4% |
2.8% |
14% |
23.4 |
|
2009 |
40 |
45 |
4.42 |
134 |
1 |
8.3% |
2.8% |
14% |
23.4 |
|
2010 |
40 |
45 |
4.43 |
135 |
1 |
8.3% |
2.8% |
14% |
23.3 |
|
2011 |
40 |
45 |
4.43 |
135 |
1 |
8.2% |
2.8% |
14% |
23.3 |
|
2012 |
40 |
45 |
4.44 |
136 |
1 |
8.2% |
2.8% |
14% |
23.3 |
At the studied location where migratory birds were come, it is important for us to obtain baseline knowledge about the solar irradiation parameters and their related predictors for illuminating environment and bird relationships to be conducted within the framework of conserving biodiversity in next years. In this respect, an examination of the relationships together with the present solar parameters is of prime significance for preventing extinction of migratory bird species threatened in subsequent time.
Conclusion
As a result, in the prediction of the global irradiation parameters, it was determined that MARS data mining algorithm with the influential predictors viz. ESTLOSTEMP and year was a powerful statistical tool. Only four terms enabled one to get the least difference at the MARS model for Hm parameter; thus, the highest predictive performance for Hm was provided. In this paper different types of azimuth angle are reviewed and discussed. The most efficient was found to be in the form of polar-axis and the values of azimuth angle/elevation types. It could be suggested that MARS algorithm was a powerful statistical tool for evaluating solar irradiation data with multiple responses. The MARS prediction equations for Hd and Hm were obtained as follows: Hd=3.782 + 0.070*ESTLOSTEMP-0.042*max(0, 2006-YEAR)+ 0.015*max(0, YEAR-2006); Hm=87.04 + 5.41*ESTLOSTEMP-1.49*max(0, 2006-YEAR)+ 0.76*max(0, YEAR-2006). It was suggested that the convenient prediction equations generated by MARS algorithm would be a respected reference for next studies to be conducted about global irradiation parameters.
Supplementary material
There is supplementary material associated with this article. Access the material online at: http://dx.doi.org/10.17582/journal.pjz/2018.50.6.2317.2324
Statement of conflict of interest
Authors have declared no conflict of interest.
References
Agroui, K., 1999. Etude du comportement thermique de modules photovoltaïques de technologie monoverre et biverre au silicium cristallin. Rev. Energ. Ren. Valorisation, 1999: 7-11. https://www.cder.dz/download/jnv_2.pdf
Ali, M., Eyduran, E., Tariq, M.M., Tirink, C., Abbas, F., Bajwa, M.A., Baloch, M.H., Nizamani, A.H., Waheed, A., Awan, M.A., Shah, S.H., Ahmad, Z. and Jan, S., 2015. Comparison of artificial neural network and decision tree algorithms used for predicting live weight at post weaning period from some biometrical characteristics in Harnai sheep. Pakistan J. Zool., 47: 1579-1585.Barsoukov, E. and Macdonald, J.R., 2005. Impedance spectroscopy: Theory, experiment, and applications, Second Edition. John Wiley & Sons. https://doi.org/10.1002/0471716243
Cox, C.H. and Raghuraman, P., 1985. Design considerations for flat-plate photovoltaic/thermal collectors. J. Solar Energy, 35: 227-241. https://doi.org/10.1016/0038-092X(85)90102-1
Dale, M.M., 2013. Single-event effects in microelectronics induced by through-wafer sub-band gap two-photon absorption. Proceedings of 10th international workshop on radiation effects on semiconductor devices for space application, JAXA-SP. pp 110-114.
Eyduran, E., Tatliyer, A., Tariq, M. and Waheed, A., 2013a. Application of classification and regression tree methods in agriculture. National Agricultural Congress, 26-29 Ekim, Antalya, Turkey.
Eyduran, E., Yilmaz, I., Kaygisiz, A. and Aktaş, Z.M., 2013b. An investigation on relationship between lactation milk yield, somatic cell count and udder traits in first lactation Turkish Saanen goat using different statistical techniques. J. Anim. Pl. Sci., 23: 956-963.
Eyduran, E., Yilmaz, I., Tariq, M. and Kaygisiz, A., 2013c. Estimation of 305-d milk yield using regression tree method in brown Swiss cattle. J. Anim. Pl. Sci., 23: 731-735.
Florschuetz, L.W., 1979. Extension of the Hottel-Whillier model to the analysis of combined photovoltaic/thermal flat plate collectors. J. Solar Energy, 22: 361-366. https://doi.org/10.1016/0038-092X(79)90190-7
Friedman, J.H., 1991. Multivariate adaptive regression splines. Annls. Stat., 19: 1-67. https://doi.org/10.1214/aos/1176347963
Garcia, N.P.J. and Alvarez, A.J.C., 2014. Nonlinear air quality modeling using multivariate adaptive regression splines in Gijon urban area (Northern Spain) at local scale. Appl. Math. Comput., 235: 50-65. https://doi.org/10.1016/j.amc.2014.02.096
Ghitani, H. and Martinuzzi, S., 1989. Influence of dislocations on electrical properties of large grained polycrystalline silicon cells. J. appl. Phys., 66: 1717-1726. https://doi.org/10.1063/1.344393
Goetzberger, A., Knobloch, J. and Vob, B., 1998. Cristalline silicon solar cell. John Wiley & Sons.
Grzesiak, W. and Zaborski, D., 2012. Examples of the use of data mining methods in animal breeding. ISBN 978-953-51-0720-0. https://doi.org/10.5772/50893
Hastie, T. and Friedman, J.R., 2001. The elements of statistical learning: Data mining, inference and prediction. Springer-Verlag. Stanford, California, pp. 337-343. https://doi.org/10.1007/978-0-387-21606-5
Hendrie, S.D., 1979. Evaluation of combined photovoltaic/thermal collectors. Proceedings of international ISES Conference, 1979, pp. 1865-1869.
Ibrahim, A., 2011. Analysis of electrical characteristics of photovoltaic single crystal silicon solar cells at outdoor measurements. Smart Grid Renew. Energy, 2: 169-175. https://doi.org/10.4236/sgre.2011.22020
Jaworski, A., 2004. Fundamentals of incremental and ecological regeneration and stands tending. Państwowe Wydawnictwo Rolnicze i Leśne, Warsaw, Poland.
Kalogirou, S.A. and Tripanagnostopoulos, Y., 2006. Industrial application of PV/T solar energy systems. J. Energy Convers. Manage., 47: 3368-3382. https://doi.org/10.1016/j.enconman.2006.01.012
Kayali, S., McAlpine, W., Becker, H. and Scheick, L., 2012. Juno radiation design and implementation. Aerospace Conference, 2012 IEEE, 3-10 March 2012, pp. 1-7. https://doi.org/10.1109/AERO.2012.6187013
Kern, E.C. and Russel, M.C., 1978. Combined photovoltaic and thermal hybrid collector systems. Proceedings of the 13th IEEE Photovoltaic Specialists, 1978, pp. 1153-1157.
Khan, M.A., Tariq, M.M., Eyduran, E., Tatliyer, A., Rafeeq, M., Abbas, F., Rashid, N., Awan, M.A. and Javed, K., 2014. Estimating body weight from several body measurements in Harnai sheep without multicollinearity problem. J. Anim. Pl. Sci., 24: 120-126.
Koc, Y., Eyduran, E. and Akbulut, O., 2017. Application of regression tree method for different data from animal science. Pakistan J. Zool., 49: 599-607. https://doi.org/10.17582/journal.pjz/2017.49.2.599.607
Kornacki, J. and Ćwik, J., 2005. Statistical learning systems (in Polish). WNT Warsaw.
May, G.S. and Sze, S.M., 2014. Fundamentals of semiconductor fabrication, First Edition. John Wiley & Sons.
Mazhari, B. and Morkoç, H., 1993. Surface recombination in GaAs PN junction diode. J. appl. Phys., 73: 7509-7514. https://doi.org/10.1063/1.353998
Mohammad, M.T., Rafeeq, M., Bajwa, M.A., Awan, M.A., Abbas, F., Waheed, A., Bukhari, F.A. and Akhtar, P., 2012. Prediction of body weight from body measurements using regression tree (RT) method for indigenous sheep breeds in Balochistan, Pakistan. J. Anim. Pl. Sci., 22: 20-24.
Morrow, D.M., Buchner, S. and Pellish, J., 2013. Single-event effects in microelectronics induced by through-wafer sub-band gap two-photon absorption. Proceedings of 10th International Workshop on Radiation Effects on Semiconductor Devices for Space Application, JAXA-SP, pp. 110-114.
Put, R., Xu, Q, Massart, D. and Heyden, Y., 2004. Multivariate adaptive regression splines (mars) in chromatographic quantitative structure-retention relationship studies. J. Chromatogr., 1055: 11-19. https://doi.org/10.1016/j.chroma.2004.07.112
Raghuraman, P., 1981. Analytical predictions of liquid and air photovoltaic/thermal, flat-plate collector performance. J. Solar Energy Engin., 103: 291-298. https://doi.org/10.1115/1.3266256
Sahin, G., 2016a. Effect of wavelength on the photocurrent and photovoltage of vertical parallel silicon solar cells under steady state condition. J. Basic appl. Phys., 5: 30-39.
Sahin, G., 2016b. Effect of incidence angle on the electrical parameters of vertical parallel junction silicon solar cell under frequency domain. Mosc. Univ. Phys. Bull., 71: 498-507. https://doi.org/10.3103/S0027134916050088
Sahin, G., 2016c. Effect of temperature on the series and shunt resistance of a silicon solar cell under frequency modulation. J. Basic appl. Phys., 5: 21-29.
Salach-Bielecki, R., Pisarkiewicz, T., Stapinski, T. and Wojcik, P., 2004. Influence of junction parameters on the open circuit voltage decay in solar cells. Opto-Electron. Rev., 12: 79-83.
Samui, P., 2013. Multivariate adaptive regression spline (Mars) for prediction of elastic modulus of jointed rock mass. Geotech. Geol. Engin., 31: 249-253. https://doi.org/10.1007/s10706-012-9584-4
Sayad, Y., 2009. Détermination de la longueur de diffusion des porteurs de charge minoritaires dans le silicium cristallin par interaction lumière matière. Thèse de doctorat, Institut National des Sciences Appliquées de Lyon, France.
Sayad, Y., 2009. Interaction Laser-Semi-conducteur: Contribution à l’étude de la technique LBIC - application au silicium photovoltaïque. Thèse de doctorat, Université Mentouri de Constantine Faculté des Sciences Exactes Département de Physique, Algérie.
Tripanagnostopoulos, Y., 2002. Hybrid photovoltaic/thermal systems. J. Solar Energy, 72: 217-234. https://doi.org/10.1016/S0038-092X(01)00096-2
Yassine, S., 2009. Determination of the diffusion length of minority charge carriers in crystalline silicon by material light interaction. PhD Thesis. National Institute of Applied Sciences of Lyon, France.
Yusuf, S., and Wittes, J., 2017. Geographic variations in controlled trials. New England J. Med., 376: 1196-1198.
To share on other social networks, click on any share button. What are these?


