View larger version:
Download Original File
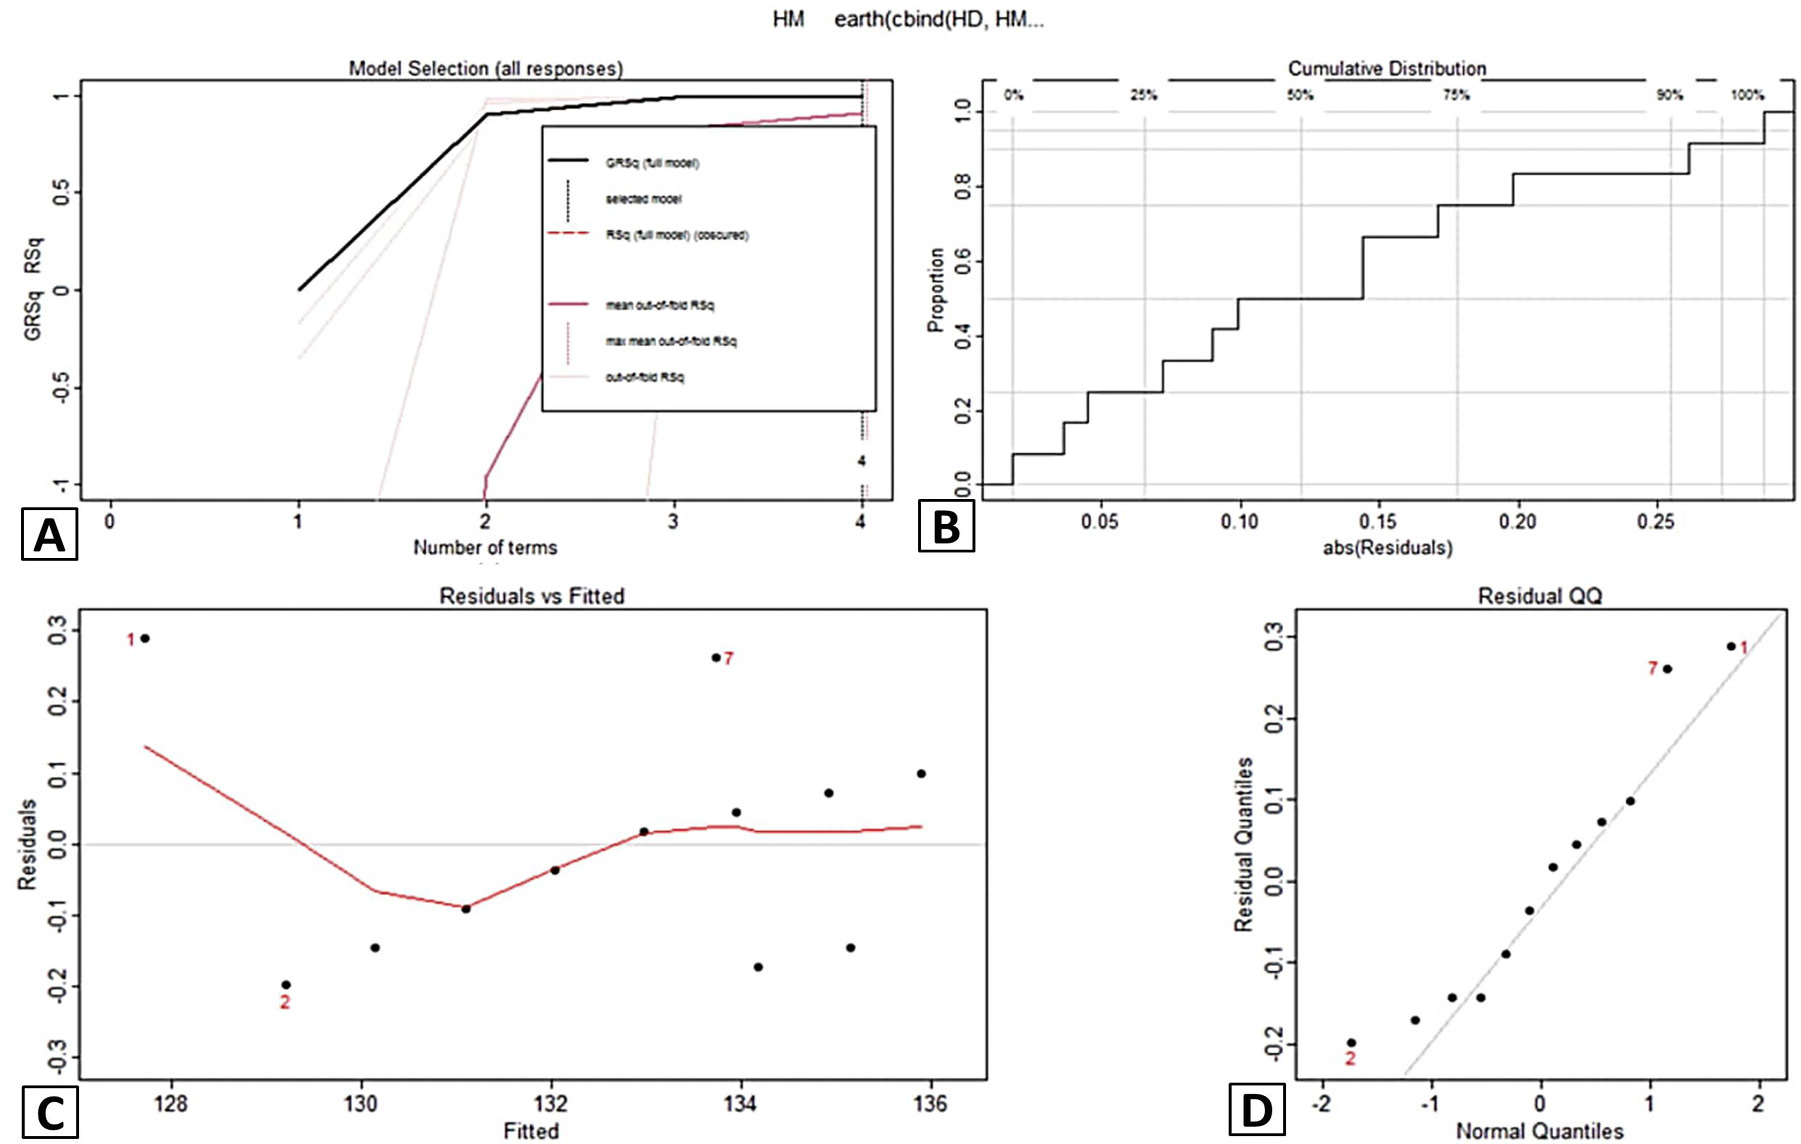
Fig. 3.
Graphs of model selection (A), cumulative distribution (B) residual and fitted values (C, D) for Hm.
