
Estimation of Total Factor Productivity Growth of Agriculture Sector in Pakistan


Research Article
Hina Afzal*, Sarfraz Hassan, Muhammad Khalid Bashir and Asghar Ali
Institute of Agricultural and Resource Economics, University of Agriculture, Faisalabad, 38000, Punjab, Pakistan.
Abstract | Most important goal of development economics and macroeconomic policies is achieving sustainable production growth. Continuous production growth is considered to be important for raising living standards. Agriculture’s Total Factor Productivity (TFP) is one of the major sources of production growth. It assesses influence of the economic and technical efficiency in the production of the desired output by combining factor inputs. The study focused on estimating total factor productivity growth in Pakistan’s economy and particularly in the agriculture sector. For this purpose, the study utilizes the growth accounting technique to obtain reliable estimates of total factor productivity. The study covered total factor productivity growth period from 1973-2020. Results indicated that the overall economy average TFP growth rate is higher from 1981 to 1990 in the agriculture sector of the country. The TFP growth of agriculture sector was higher in this decade. Comparison between the TFP with other sectors like industrial and services, having 1.51%, 4.01% and 4.12%. TFP has been lowest in the agriculture sector as compared to other sectors as per findings of the study. As a result, effective policies are needed to enhance agriculture total factor productivity growth by the government. The farmers’ level of education makes a significant contribution to TFP development. It is concluded that education funding be increased for the farmers to accelerate TFP growth in Pakistan.
Received | March 11, 2021; Accepted | May 18, 2021; Published | September 07, 2021
*Correspondence | Hina Afzal, Institute of Agricultural and Resource Economics, University of Agriculture, Faisalabad, 38000, Punjab, Pakistan; Email: Hinaafzal1843@gmail.com
Citation | Afzal, H., S. Hassan, M.K. Bashir and A. Ali. 2021. Estimation of Total factor productivity growth of agriculture sector in Pakistan. Growth, yield and economic analysis of dry-seeded basmati rice. Sarhad Journal of Agriculture, 37(4): 1298-1305.
DOI | https://dx.doi.org/10.17582/journal.sja/2021/37.4.1298.1305
Keywords | Agriculture sector, Growth accounting, Gross domestic Product,Total factor productivity
Introduction
During 1972 to 2019, the agriculture sector contributed about 27% of GDP and employed nearly half of the working population. Agriculture’s share of Pakistan’s economy has shrunk over time (Abman and Carney, 2020). However, between 2011 and 2019, agriculture’s share of the economy has dropped to nearly 20%, and the working labour share has dropped to 43%. It is still a significant sector, despite its declining share of production and employment. It provides a means of income for a significant portion of Pakistan’s population and meets the country’s food needs. It is also a source of raw materials for industrial sector (Chen, 2008).
Productivity is one of the most crucial indicators of the economy because it measures efficiency in using inputs, such as labor and capital, in the production procedure (Anjum and Micheal, 2017). To be more precise, a rise in productivity growth rate reveals that higher output is produced either the same or lower inputs. In other words, the inputs are consumed more proficiently owing to the enhancement of prevailing technology. It consents to lessen costs and advance the quality of products (Hamilton et al., 2019). The most frequent measure for labor productivity is the quantity of output produced by one unit of labor, but this concept can be extended to multiple inputs. This idea is likewise behind total factor productivity (Fadiran and Akanabi, 2017).
TFP growth is the major factor in enhancing the gross domestic product. GDP is the main term to measure the economy of a country or region and sectors. Total factor productivity is highly related to different sectors such as the agricultural industry and services sector. The current study estimates the total factor productivity growth of the agriculture sector. At the present stage of development, especially in the face of explosive population growth, Pakistan cannot afford to see it’s crop productivity declining (Ghose and Biswas, 2011). The average annual growth rate of agriculture in the last few years is 1.87 percent. For the year 2015-16, it was -0.2 percent. The crop sector experienced a negative growth rate of 6.25 percent, whereas, for major crops, it was -7.18 percent. In Pakistan, wheat is even more important than the rest of the world, as it is a staple diet for people. During 2015 over 9 million hectares were devoted to wheat crop, which constituted 41 percent of the cropped area and 66 percent of the cereal area (Chandio et al., 2017). Over 25 million tons of wheat were produced in the country. Wheat stocks are increasing in Pakistan. At present, 5 million tons of wheat reserves are present with the government. Due to the high production cost, support prices, and falling world wheat prices, Pakistan cannot export the surplus (Chandio et al., 2017). Climate change can easily add or wipe out 2 to 3 million tons of wheat in a single year. Being staple food, Pakistani people spent 75 percent to 80 percent of their wheat budget in 1999, as has been independent (Hamilton et al, 2019).
The state of affairs is extremely severe in the emerging nations where poor people live in masses. Supplementary 1.3 billion people living in ultimate poverty, and 805 million international people do not have plenty of food to eat (Ding et al., 2017). According to USAID projections, if the need for wheat and rice increases in the developing nations, its chief proportion will be met by imports (Rice et al., 2010). The shares of an upsurge in wheat and rice imports, i.e., 85 percent to 97 percent, will go to the developing nations by 2022.
The only alternative achieves greater constant yield progress owing to the fast development of TFP. Hence, research of TFP is imperative in the agriculture sectors of Pakistan’s economy for applicable economic policies (Snapp et al., 2018).
Output growth is a requisite for refining lifestyle. It is more central for emerging countries while falling victim to a diversity of financial complications. In Pakistan, 29.5% of inhabitants are lasting under the poverty line. Exclusive of 6.2% workforce is jobless. Monetary shortfall as per fraction of gross domestic product (GDP) is incredibly immense. The enormity of sustained growth can barely be overstated when a country is confronted with the above-cited drawback (Majeed, and Khan, 2010).
Labor productivity is an extensively used indicator in the economy since it is primarily determined by production technology. Technological evolution is correspondingly replicated in an increase in labor productivity. Technological development is usually measured using TFP, based on a rough calculation of the production function. The Cobb Douglas’s production function uses labor and capital as inputs. Suppose these inputs’ growth rate is weighted with their production elasticities and deducted from real GDP growth, which gives residual (Hye et al., 2010). Moving back to Solow (1957), the unexplained rest is called Solow residual. It characterizes multi-factor productivity, i.e., the involvement in economic growth that is not enlightened by labor force contribution of capital deepening. This Solow residual is also termed as TFP, an unexplored part of the output (Huggins and Izushi, 2020).
Growth in the neo-traditional structure originates from factor amassing and total factor productivity (TFP) development. The vast majority of the discussion has, by and by, zeroed in on TFP. Consequently, the best possible measure is the normal result of everything being equal. This is termed TFP or multifaceted profitability (Moghaddasi and Pour, 2016). The main objective of the current study is to estimate the total factor productivity growth of overall Pakistan’s economy and its agriculture sector.
Materials and Methods
The methodology is typically a guide for performing a good study with particular components such as methods, instruments, and procedures. An appropriate approach that completes the analysis and fulfills the goals must be implemented after studying and defining the goals. It is necessary to choose the right approach, which is achieved by keeping the study objectives in mind (Pasha et al., 2014).
Solow growth model is used for assessing total factor productivity growth in the agriculture sector. This is the methodology that is more suitable for this analysis.
Data sources
Time series data over the period 1973-2020 is used in this study. The sources from which the gathered information is monitored
- Pakistan Bureau of Statistics
- Federal Bureau of statistics
- Pakistan Economic Survey
- Handbook of statistics on the economy of Pakistan, SBP
- Internet
- World Development Indicator (WDI)
Study based on secondary data and Total Factor Growth in Agriculture sectors is projected.
Productivity growth has been central to the economic policy agendas of most of the world’s governments. Productivity assessment is a very important step in identifying and measuring it.
Growth accounting method for TFP estimation
Due to the effort of Isaksson the growth accounting method for the estimation of TFP became popular (Isaksson, 2007). TFP as a residual is calculated by this method. Portions in national income are used in this system to combine single inputs to form the TFP index. This method is capable of disintegrating the contribution to production growth of factor contributions and technical change.
A traditional Neo-classical production function of the form is the starting point of this approach:
A variety of methods for estimating TFP are available in the growth literature. The two most commonly used TFP estimation methods are discussed in this section Growth Accounting (Ivanic and Martin, 2018). For a deeper understanding of scientific investigations, each of these approaches is discussed below. Growth stems from two sources in the neoclassical framework.
- Capital Accumulation
- Total Factor Productivity
Total Factor Productivity (TFP) is a part of the production that accounts for effects not induced by inputs (labour and capital) on total output. With the seminal paper of Solow (1957) and T.W., the total factor productivity growth debate began.
Technical transition and the Aggregate Output Party “swan.” Solow used residual of total factor efficiency. The residual or total factor productivity measure is also used to measure technological progress, to quantify the contribution of input growth and the residual technical change to growth.
The methodology of research is established with the role of Solow development in Equation 1.
Where; K, L, and A presents capital, labour, and TFP, respectively. The equation states that production is a function of the capital stock, jobs, and a shift factor that indicates some form of production shift except labour and capital.
In the above equation, we need the labour and capital data. The labour data directly available, but the capital data cannot be directly available study used capital stock series to generate the capital data.
In the capital stock series, the current study used the perpetual inventory method. In this method, capital accumulation is used as a past investment. The current study used GFCF (Gross fixed capital formation) as a proxy of investment and generated capital stock series.
Consider the following simple equation of motion of capital stock as in Equation 2.
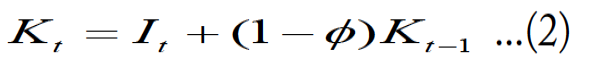
If K (0) is the initial capital stock, Nehru and Dhareshwar (1993) computed the capital stock series as in Equation 3.
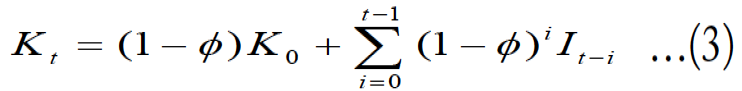
Where; Φ is Geometric delay rate= Depreciation Rate of Capital δ.
Since empirical growth literature shows that:
- Capital / Output Ratio is constant
- For developing economies, its approximately around 2.5
- So to get K(0), multiply GDP(0) at a level of 2.5, we get K(0)
We get the capital with a constant deprecation rate. But in the long run depreciation rate is not constant; it can be varied over time, so we calculate the time-varying depreciation rate by using the following Equation 4.
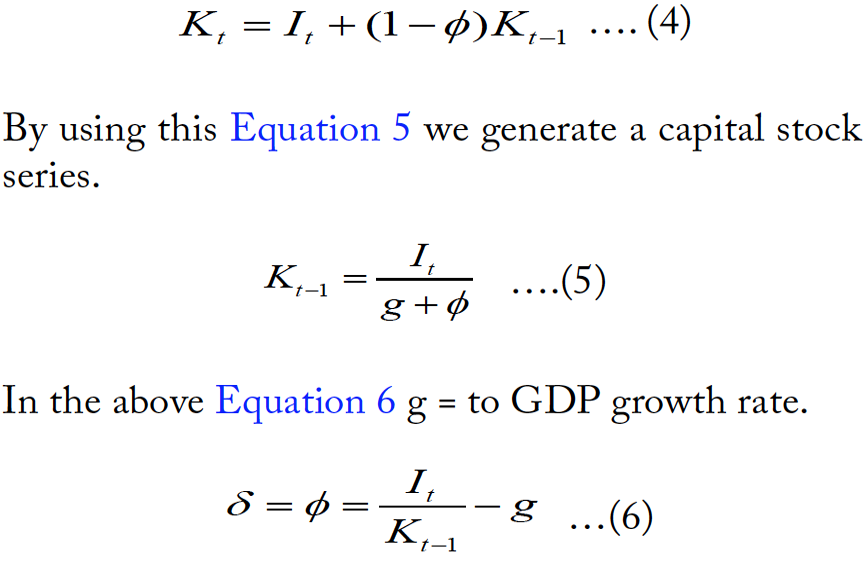
For the calculation of the capital stock sequence, the other necessary estimate is the depreciation rate. From the above equation, the value of the depreciation rate that is not constant can be calculated.
The entire capital stock values are calculated in several studies. In the above equation, we get a time-varying depreciation rate. The current study used this depreciation rate for calculating the capital stock. By using this capital and labour we estimate the total factor productivity growth.
The study has a cobb-Douglas production function which is shown in Equation 7.
After taking the natural log of both sides, we get the following Equation 8.
lnY = lnA + alnK + (1-a)lnL ….(8)
In the primal approach, we get the following Equation 9 of total factor productivity.
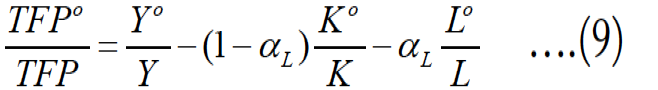
If we subtract our input factors from the output factor, we get the total factor productivity growth. But according to the Solow growth model, we used normalized estimates when we estimate TFP in Equation 10.

After taking the growth rate in GDP labour and capital, we get the total factor productivity growth.
Results and Discussion
The results of total factor productivity growth for 1973 to 2020 were discussed in overall ‘Pakistan’s economy and Agriculture sector. The total factor productivity results are estimated by using a growth accounting framework and Malmquist indices. We used two inputs labor and capital. The capital is generated using the capital stock series (Bosworth et al., 2003). The perpetual inventory method (PIM) is used to generate capital stock series in the capital stock series. In this method, we use GFCF (Gross fixed capital formation) as a proxy of investment. The labor is measured as several workers employed in terms of rupees. The determinants of TFP are identified by using econometric approach results that will be discussed below.
Analysis of the overall economy
Table 1 shows the sources of growth in terms of percentage in different decades. It is observed that there was the highest GDP growth rate in 1981-1990. The total factor productivity and capital growth rate are also highest in this decade, but there was a negative labor growth rate. The highest growth in this decade is due to the renewal of private industrial investment, and there was a nationalization during this period (Kamran et al., 2019). It is contended that there were not many changes in the industrial policy, but there was liberalization in the imports of industrial raw material in this decade (Seyoum, 2010). It is observed that the duration of 1991-2000 has ‘lost ‘decades’ because there was very low GDP growth and total factor productivity growth is also very low as compared to the other decades. There are many reasons for declining in TFP because, in 1990, trade liberalization increased the debt burden in the economy. There was an unstable environment in tax rules and import tariffs (Jona-Lasinio, 2019). The main reason behind TFP growth is that there exist identical behavior between GDP and total factor productivity growth. That is why when GDP growth increases TFP growth also increases and when GDP decline TFP growth also decline.
Table 1: Growth sources of ‘Pakistan’s economy (1973-2020).
|
Source of growth in terms of percentage |
1973-1980 |
1981-1990 |
1991-2000 |
2001-2010 |
2011-2020 |
1973-2020 |
|
GDP |
4.92 |
6.23 |
4.01 |
4.68 |
4.32 |
4.78 |
|
Capital |
1.78 |
6.15 |
3.98 |
2.52 |
2.83 |
3.98 |
|
Labour |
4.98 |
-0.05 |
3.01 |
4.31 |
1.57 |
2.31 |
|
TFP |
1.68 |
2.80 |
0.34 |
1.32 |
1.94 |
1.55 |
Source: Author’s estimates from the data taken from hand book of statistics, FBS, Government of Pakistan.
Estimation of TFP of the overall economy
In Table 2, the total factor productivity growth is estimated by using a growth accounting framework. Total factor productivity can be estimated using the Solow residual, which is shown in the below Equation 11.

TFPG= Total Factor Productivity Growth in the overall of ‘Pakistan’s economy; GDPgr=Gross Domestic Product growth rate; Kgr= Capital growth rate; Lgr= Labour Force growth rate.
Table 2: Share of Solow inputs in overall ‘Pakistan’s economy.
|
Solow residual |
Coefficient |
Standard error |
P-value |
Adjusted share |
|
Intercept |
3.23 |
0.51 |
8.59E-08 |
|
|
Capital Share |
0.22 |
0.04 |
1.954E-07 |
0.22/1.07 = 0.21 |
|
Labour Share |
0.85 |
0.02 |
6.819E-45 |
0.85/1.07 = 0.79 |
|
Total |
1.07 |
1 |
R2=0.99
Share of Solow inputs in overall Pakistan’s economy
In the above Table 2, we have a share of capital which is 0.22, and the share of labor is 0.85. But the slow used the adjusted share of labor and capital for the estimation of total factor productivity. By dividing these shares by their total values and driving the adjusted share used in the above equation.
Growth rate in GDP Factor inputs and TFP of overall ‘Pakistan’s economy
Supplementary Table 1 shows the labor growth rate, capital growth rate GDP, and TFP growth rate in the time duration of 1973-2020. It is observed that there exists a relationship between GDP and TFP growth. We can use the adjusted Solow residual and find the total factor productivity growth shown in the above Table 1.
Trends in GDP growth and TFP in Pakistan’s economy
Figure 1 shows that there exists identical behavior between GDP growth and total factor productivity growth. The downward trend between GDP and TFP growth shows the structural weakness in the economy. While the rising trend in GDP and TFP growth shows the increase in economic performance. The negative total factor productivity growth shows the decline in GDP growth. When GDP growth is start to decline our TFP growth was also decline due to identical behavior.
Analysis of agriculture sector
Table 3 shows the growth performance of the agriculture sector in different decades. It is observed that there was the highest GDP growth rate and TFP growth rate in the period 1981-1990. There is a decline in the agriculture sector’s growth throughout the different decades, and there is observed that the GDP growth is decreased and TFP growth also decreased in 2011-2020. Over the decades, the share of the agriculture sector in GDP has declined. Despite declining the share of GDP, it is still the important sector of our economy. It fulfills our population’s food needs and a major source of the raw material of our industrial sector. Many stylized factors decline the share of the agriculture sector (Favaro and Geib, 2009).
Table 3: Growth sources of agriculture sector in ‘Pakistan’s economy: (1973-2020).
|
Source of growth in terms of percentage |
1973-1980 |
1981-1990 |
1991-2000 |
2001-2010 |
2011-2020 |
1973-2020 |
|
GDP |
3.12 |
4.09 |
4.00 |
2.54 |
1.77 |
3.31 |
|
Capital |
-0.51 |
14.98 |
3.52 |
2.01 |
2.31 |
4.98 |
|
Labour |
4.32 |
-0.31 |
3.21 |
4.31 |
-0.06 |
1.52 |
|
TFP |
-0.81 |
1.51 |
0.90 |
1.21 |
-0.73 |
1.32 |
Source: Author’s estimates from the data taken from hand book of statistics, FBS, Government of Pakistan.
Table 4: Share of Solow inputs in the agriculture sector.
|
Solow residual |
Coefficient |
Standard error |
P-value |
Adjusted share |
|
Intercept |
2.53 |
1.35 |
0.066 |
|
|
Capital share |
0.42 |
0.11 |
0.0006 |
0.42/0.96 = 0.44 |
|
Labour share |
0.54 |
0.03 |
5.32E-18 |
0.54/0.96 = 0.56 |
|
Total |
0.96 |
1 |
R2=0.98
Estimation of TFP growth of agriculture sector
In Table 4 the total factor productivity growth is estimated by using a growth accounting framework. Total factor productivity can be estimated by using the Solow residual, which is shown in the below equation.
TFPG Agriculture sector= GDPgr-0.44Kgr-0.56Lgr
TFPG= Total Factor Productivity Growth in Agriculture Sector; GDPgr= Gross Domestic Product growth rate; Kgr= Capital growth rate; Lgr= Labour Force growth rate.
Share of Solow inputs in the agriculture sector
In Table 4 we have a share of capital which is 0.42, and the labor share is 0.54. But the slow used the adjusted share of labor and capital for the estimation of total factor productivity. By dividing these shares by their total values and we drive the adjusted share used in the above equation.
Growth rate in GDP inputs and TFP of the agriculture sector
Supplementary Table 2 shows the inputs labor and capital growth rate GDP and TFP growth rate in the time duration of 1973-2020 in the agriculture sector of Pakistan’s economy. It is observed that there exists a relationship between GDP and TFP growth. We can use the adjusted Solow residual and find the total factor productivity growth shown in the above Table 2.
Trends in GDP growth and TFP in the agriculture sector
In Figure 2, it is observed that when the GDP growth rate of the agriculture sector declines to 3 percent, the total factor productivity growth tends to be negative. There exist similar behavior between GDP growth and TFP growth in the period of observation. There are many reasons for declining the agriculture sector’s GDP growth because of the low education level of a rural farmer and poor government policies of marketing and prices (Favaro and Geib, 2009).
Conclusions and Recommendations
The aim of this study is to calculate total factor productivity at the aggregate level of Pakistan’s economy and agriculture sector. The TFP growth was estimated by using a growth accounting framework. The research is focused on a broad data set that spans the years 1973 to 2020. This time is significant because it covers all aspects of our economic history, including nationalization, deregulation and decontrol, import liberalization, and structural adjustment program and economic reforms. The main flaw in previous studies of TFP growth in Pakistan is that they used a fixed depreciation rate, such as the 4% used in the literature. But the current study will use a time-varying depreciation rate by using the capital stock series because the depreciation is not fixed; it varied over time. Dual estimates of total factor productivity were obtained in this analysis. The first set of estimates is based on the standard factor inputs calculation, which has been used in previous studies. But the current study used normalized estimates that were used by the Solow model. Normalized estimates provide better results of TFP growth. It is observed that there was the highest GDP growth rate in 1981-1990. The total factor productivity and capital growth rate are also highest in this decade, but there was a negative labor growth rate. The highest growth in this decade is due to the renewal of private industrial investment, and there was a nationalization during this period. It is observed that the duration of 1991-2000 has ‘lost ‘decades’ because there was very low GDP growth and total factor productivity growth is also very low as compared to the other decades. There are many reasons for declining in TFP because in 1990, trade liberalization increased the debt burden in the economy, and there was an unstable environment in the form of tax rules and import tariffs.
We have already noted that the average TFP growth rate of the overall economy is higher from 1981 to 1990. If we observed the agriculture sector the TFP growth of this sectors also higher in this decade which is 1.51 percent. Our results show that TFP of agriculture sector share is lowest when compared to overall economy. It is, therefore, needed that government should devise appropriate policies to promote agriculture TFP growth. The education level of the farmers is a major contribution to the growth of TFP. The measure should be taken to diffuse relevant information for efficient farming. The area under cultivation has also been found to be significantly contributing to TFP growth. The measure should be taken to bring more area under cultivation. This will greatly help in improving TFP not only in the agriculture sector but also in the manufacturing and services sector through its forward and backward linkages with them.
Acknowledgments
On behalf of other authors, I would like to pay thanks to Prof. Dr. Khalid Mahmood Ch. for editing and proofread of this manuscript.
Novelty Statement
The major drawback of earlier studies of TFP growth about Pakistan is they used a fixed depreciation rate like 4% But the current study used a time-varying depreciation rate by using capital stock series.
Author’s Contribution
Hina Afzal: Main idea, collected data from different sources, data analysis and write up.
Sarfraz Hassan: Econometric modeling.
Muhammad Khalid Bashir: Refined the methodology.
Asghar Ali: Wrote discussion and conclusion.
There is supplementary material associated with this article. Access the material online at: https://dx.doi.org/10.17582/journal.sja/2021/37.4.1298.1305
Conflict of interest
The authors have declared no conflict of interest.
References
Abman, R., and C. Carney. 2020. Agricultural productivity and deforestation: Evidence from input subsidies and ethnic favoritism in Malawi. J. Env. Econ. and Manage., 103: 102-342. https://doi.org/10.1016/j.jeem.2020.102342
Anjum, M.I. and S. Michael. 2017. A brief history of Pakistan’s development. J. Real World Econ. Rev., 80: 171–178.
Bosworth, B., and S.M. Collins. 2003. The empirics of growth: An update. Brookings Paper Econ. Activity, 2003(2): 113-206. https://doi.org/10.1353/eca.2004.0002
Chandio, A.A., H. Magsi, A. Rehman and J.G.M. Sahito. 2017. Types, sources and importance of agricultural credits in Pakistan. J. Appl. Environ. Biol. Sci., 7(3): 144-149.
Chen, C. 2008. Capital-skill complementarity, sectoral labor productivity, and structural transformation. J. Econ. Dynam. Control. 10:39-42.
Ding, Q., X. Chen, R. Hilborn and Y. Chen. 2017. Vulnerability to impacts of climate change on marine fisheries and food security. J. Mar. Pol., 83: 55-61. https://doi.org/10.1016/j.marpol.2017.05.011
Fadiran, D. and O.A. Akanbi. 2017. Institutions and other determinants of total factor productivity in Sub-Saharan Africa. Econ. Res. S. Afr. (ERSA) Working Paper. 23: 714-717.
Favaro, E, and F.G. Koehler. 2009. Pakistan a fresh look at the crisis and policy priorities. World Bank Econ. Policy Debt. Dep. Washington, DC., 4: 76-96.
Ghose, A. and P.R. Biswas. 2011. Inter-industrial variation in total factor productivity growth of manufacturing sector of West Bengal: Evidence from a Non-Parametric Approach. J. Ind. Econ., 59: 29-50. https://doi.org/10.1177/0019466220110203
Jona-Lasinio, C., S. Schiavo and K. Weyerstrass. 2019. How to revive productivity growth?. Econ. Policy Report. 3: 25-39.
Hamilton, J.D., 2019. Measuring global economic activity. J. Appl. Econ., 3: 12-32. https://doi.org/10.3386/w25778
Hamilton, K.E., E. Naikal and G.M. Lange. 2019. Natural resources and total factor productivity growth in developing countries: Testing a new methodology. The World Bank, 102: 87-89. https://doi.org/10.1596/1813-9450-8704
Huggins, R., and H. Izushi. 2020. Innovation and productivity: A multi-perspective assessment. In Productivity Perspectives. Edward Elgar Publ., 3: 34-49. https://doi.org/10.4337/9781788978804.00010
Hye, Q.M.A., A.R. Mustafa and K. Mahmood. 2010. Causality between exports and imports of agricultural sector in the case of Pakistan. J. Appl. Econ. Res. Cen., 44: 201-205.
Isaksson, A., 2007. Total factor productivity growth and its determinants for West Bengal Agriculture. J. Asi Agric. Dev., 8: 28-39.
Ivanic, M., and W. Martin. 2018. Sectoral productivity growth and poverty reduction: National and global impacts. World Dev., 109: 429-439. https://doi.org/10.1016/j.worlddev.2017.07.004
Kamran, M., M. Mudassar, I. Abid, M.R. Fazal, S.R. Ahmed, M.I. Abid and S.H. Anjum.2019. Reconsidering the power structure of Pakistan. Int. J. Ren. Ene. Res., 9: 480-492.
Majeed, M.T. and S. Khan. 2010. The determinants of private investment and the relationship between public and private investment in Pakistan. Econ. Rev., 43: 15-23.
Moghaddasi, R. and A.A. Pour. 2016. Energy consumption and total factor productivity growth in Iranian agriculture. Energy Rep., 2: 218-220. https://doi.org/10.1016/j.egyr.2016.08.004
Nehru, V. and A. Dhareshwar. 1993. A New database on physical capital stock: source, methodology and result. Rev. Anal. Econ. 8: 37-59.
Pasha, H.A., A. Ghaus and K. Hyder. 2014. The slowing down of the growth of total factor productivity in Pakistan. J. Soc. Pol. Dev. Cen., 24: 22-34.
Rice, S.E., C. Graff and C. Pascual. 2010. Confronting poverty: Weak states and US national security. Brookings Institution Press, 3: 14-26.
Seyoum, B., 2010. Trade liberalization in textiles and clothing and developing countries: An analysis with special emphasis on the US import Market. Int. Trade J., 24(2): 149-181. https://doi.org/10.1080/08853901003652351
Snapp, S.S., P. Grabowski, R. Chikowo, A. Smith, E. Anders, D. Sirrine and M. Bekunda. 2018. Maize yield and profitability tradeoffs with social, human and environmental performance: Is sustainable intensification feasible. J. Agric. Syst., 162: 77-88. https://doi.org/10.1016/j.agsy.2018.01.012
Solow, R.M., 1957. Technical change and aggregate production function. Rev. Econ. Stat., 39: 312-320. https://doi.org/10.2307/1926047
To share on other social networks, click on any share button. What are these?


