Effect of Sonication Temperature on Physicochemical and Functional Properties of Chicken Egg White and Duck Egg White


Research Article
Effect of Sonication Temperature on Physicochemical and Functional Properties of Chicken Egg White and Duck Egg White
Samantha Shiuan Erl Lee1, Nurul Huda2*, Yetti Marlida3, Eng-Keng Seow4
1Faculty of Food Science and Nutrition, Universiti Malaysia Sabah, Jalan UMS, 88400, Kota Kinabalu, Sabah, Malaysia; 2Faculty of Sustainable Agriculture, Universiti Malaysia Sabah. Locked Bag No. 3, 90509, Sandakan, Sabah, Malaysia; 3Faculty of Animal Science, Department of Animal Nutrition and Feed Technology, University of Andalas, Padang 25163, Indonesia; 4Department of Food Science and Technology, School of Industrial Technology, Faculty of Applied Sciences, Universiti Teknologi MARA, 40450 Shah Alam, Selangor, Malaysia.
Abstract | The effect of ultrasound treatment temperature (25, 35, 45, and 55ºC) on physicochemical and functional properties of chicken and duck egg whites were studied. Egg whites were treated with ultrasound generated by sonicator (frequency 40kHz) for 15 min, and their colour, pH, expressible moisture, folding test, gel strength, texture profile analysis, foaming capacity and stability, and emulsification stability were compared. Ultrasound treatment had caused a significant decrease (p<0.05) in pH and expressible moisture, apart from improving the gel strength and folding test score of egg white gels. Improvement of gel strength was substantiated by the significantly higher (p<0.05) hardness and springiness of egg white gels. Hardness and springiness of ultrasound-treated chicken egg white gels were 3019.17-3399.67 g and 8.71-9.23 mm, respectively. While ultrasound-treated duck egg white gels had the hardness values at 2143.23-2732.50 g, and springiness values in the range of 6.14-6.37 mm. However, ultrasound treatment did not significantly (p>0.05) affect the functional properties of chicken egg white. The effect of ultrasound was more pronounced on duck egg white as evidenced by the significantly higher (p<0.05) foaming capacity (140.00%) and foaming stability (66.67%). Hence, effect of ultrasound temperature is worthy for further investigation with duration and intensity of ultrasonic waves to improve functional properties of egg white, especially duck egg white.
Keywords | Ultrasound, Chicken egg white, Duck egg white, Foaming stability, Emulsification stability.
Received | July 18, 2022; Accepted | August 01, 2022; Published | November 20, 2022
*Correspondence | Nurul Huda, Faculty of Sustainable Agriculture, Universiti Malaysia Sabah. Locked Bag No. 3, 90509, Sandakan, Sabah, Malaysia; Email: drnurulhuda@ums.edu.my
Citation | Erl Lee SS, Huda N, Marlida Y, Seow EK (2021). Effect of sonication temperature on physicochemical and functional properties of chicken egg white and duck egg white. J. Anim. Health Prod. 10(4): 529-540.
DOI | http://dx.doi.org/10.17582/journal.jahp/2022/10.4.529.540
ISSN | 2308-2801

Copyright: 2022 by the authors. Licensee ResearchersLinks Ltd, England, UK.
This article is an open access article distributed under the terms and conditions of the Creative Commons Attribution (CC BY) license (https://creativecommons.org/licenses/by/4.0/).
INTRODUCTION
Egg white is widely used in food products due to its good functional properties such as gelling, emulsifying, and foaming properties (Zheng et al., 2021). Egg white is usually used as an ingredient to improve the gel strength or water capacity in most of the food products. The rheological and textural characteristics of a product are mostly associated to the gelling properties or coagulation of egg protein (Ren et al., 2010). The unique functional properties of eggs make it useful in bakery industry to yield a better quality products such as meringues and cookies. Egg white can also be used to improve the functional properties of protein in bakery products.
Apart from gelling properties, emulsification such as emulsifying capacity and stability of egg yolk and egg white, plays an important role in the food industry and other applications (Munday et al., 2017). Egg is also known as a stabilizing agent in reducing the surface tension. Emulsification activity allows the mixing of ingredients using a suitable method, and the mixture is protected during the mechanical handling process (Pyler et al., 2010). Moreover, the use of egg white protein as an ingredient in bakery industry is important, as egg has a good foaming capability to aid in producing a high quality product.
Ultrasound treatment is a process where the ultrasonic wave is used to change the structure of a food ingredient. Generally, ultrasound treatment has a frequency ranging from 20 kHz to 100 kHz. The duration of ultrasound treatment affects the qualities of duck egg white, whereby an increasing time improved the functional properties of duck egg white (Hui et al., 2022). With the aid of ultrasound treatment, physicochemical and functional properties can be enhanced. Therefore, a high quality and safe product can be produced and delivered to consumers. This process changes the protein molecule in egg white caused by the cavitation phenomenon, heating, dynamic agitation, shear forces and agitation. The covalent bond in egg white will be broken down and large aggregate will be split into smaller particles that will change the functional properties of the protein (Stefanović et al., 2014). Based on the study, ultrasound treatment has high potential to increase production efficiency of gelatine peptide (Yu et al., 2016). A recent study has proved that ultrasonic pretreatment initiates the interaction of egg white proteins, which influenced the formation of egg white gel skeleton (Wang et al., 2022). Hence, this study aims to determine the effects of sonication temperature towards physicochemical and functional properties of fresh chicken and duck egg white.
MATERIALS AND METHODS
Materials
Leghorn chicken eggs used in this study was collected from Eng Peng Poultry Farm, whereas Khaki Campbell duck eggs were collected from backyard farm located in Tuaran. Chemical used in this study were of analytical grade.
Methods
Pre-Treatment Of Chicken Egg White And Duck Egg White With Sonicator
Both egg whites were separated from the egg yolks and 200 mL of egg white were transferred into a 250 mL conical flask. Conical flasks were placed in the sonicator (Branson Model 8510, America) for 15 min at 40 kHz with different temperature (25°C, 35°C, 45°C dan 55°C) (Jambrak et al., 2009; Stefanović et al., 2014).
Preparation Of Egg White Gel
About 300 mL of chicken or duck egg white were poured into plastic tube. The plastic tubes were immersed in water bath at 80°C for 1 h and the tubes were cooled at room temperature for at least 4 h. Then, the cylindrical-shaped gels were removed from the plastic tube and each of them was cut using metal wire (diameter (2.9cm) and height (2cm)) (Lechevalier et al., 2007).
PHYSICOCHEMICAL ANALYSES
Colour
Colour for both egg white and egg white gel of chicken and duck were determined using colorimeter (Hunterlab Colorflex Spectrophotometer, America). Colorimeter was first calibrated using zero calibration plate and white calibration plate. The fresh samples and gel samples were placed into the petri dish. Egg samples were shaken horizontally to shuffle the contents to get a more accurate result. Parameter obtained in this measurement were L* (lightness), a* (redness), and b* (yellowness). Ls*, as* and bs* of white standard tile were used as a reference. The overall colour difference was calculated by the following equation (Flores-Jiménez et al., 2019):
Δ𝐸=√(𝐿𝑠∗−𝐿∗)2+(𝑎𝑠∗−𝑎∗)2+(𝑏𝑠∗−𝑏∗)2
𝐿𝑠∗= 94.43
𝑎𝑠∗= 0.19
𝑏𝑠∗= 3.87
pH
The pH of fresh chicken and duck egg white were measured at 20°C using a pH meter (Eutech Instruments pH2700, America). The instrument was calibrated by using standard buffers with a known pH. The measurement was done at triplicates to get the average and standard deviation (Alamprese et al., 2012).
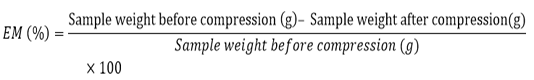
Expressible Moisture (Em)
EM was carried out according to the method described by Buamard et al. (2017). The cylindrical-shaped gel samples were sliced into 5 mm thick, weighed accurately and recorded. The sliced samples were placed between Whatman filter paper No. 1 (3 pieces at the bottom and 2 pieces on the top of the samples). A standard weight of 5 kg was placed on the gel samples for 2 min. Samples were transferred out from the filter paper and weighed again. The EM can be calculated with the formula below and it is known as sample weight percentage:
Folding Test
Folding test was carried out according to Huda et al. (2013). The gel samples were sliced into 3 mm thick for each sample. The gel pieces were folded by the thumb and index finger and the cracking process of the gel were observed. The scale used to determine the strength were: 1= cracked by the finger pressure, 2= cracked into two pieces immediately when folding, 3= cracked gradually when folding, 4= no cracks after folding, and 5= no cracks after folding twice.
Gel strength (tube inverting test)
Approximately 10 samples with different concentration of egg white to distilled water (0, 20, 30, 40, 50, 60, 70, 80, 90 and 100%) were prepared inside the test tubes (Martins et al., 2019). The solutions were mixed homogenously, and the samples were heated for 10 min until the gel were formed (Niehoff et al., 2013). Next, the gel prepared were allowed to cool for 5 min and the tube inverting test was carried out for 5 min in order to observe the effects of the gel. The gels that collapsed were considered not stable and concluded as a negative output for tube inverting test.
Texture Profile Analysis (Tpa)
TPA of samples were analysed following the method by Zhou et al. (2014). Hardness, cohesiveness, springiness, chewiness and adhesiveness of the gel samples were tested using a texture profile analyser (Brookfield CT3 Texture Analyzer, America). The instrument was calibrated with load cell weight and probe height prior to analysis. The settings used were pre-test speed: 5mm/s, test speed: 2mm/s, post-test speed: 5mm/s, strain: 50%, and trigger force: 5 g. Measurement was carried out at triplicates and the average was taken to scale the strength of the gel sample.
Functional Properties Analyses
Foaming Ability
About 20 mL of fresh egg white sample was poured into a 200 mL beaker and blended using a Waring blender (Waring Commercial Laboratory Blender 7010HS, America) for 3 min. The solution was then poured into a 200 mL measuring cylinder. The volume of the foam and volume of the egg white solution were measured after 30 min. The foaming ability and stability were calculated using the formula below (Sze et al., 2018):
Foaming ability = 
Foaming stability = 
V0 = Volume of egg white solution before blended (m3)
Vf = Volume of foam (m3)
V1 = Volume of egg white solution after blended (m3)
V30 = Volume of foam after 30 min (m3)
Emulsifying Stability
Approximately 10 mL of fresh egg white sample was added into 10 mL of soybean oil and blended using homogenizer to prepare the egg white solution. The homogenization process was carried out for 1 min by using vortex mixer (VELP Scientifica ZXClassic Vortex Mixer, Italy). The solution was then placed into centrifuge and being separated at 3200 rpm for five minutes (Eppendorf Centrifuge 5702, German). Next, the stability of emulsification was determined using formula below (Mun et al., 2009; Nikzade et al., 2012):
Emulsification stability (%) = 
F0 = Original sample weight (g)
F1 = Sample weight after separated (g)
Statistical Analysis
All analyses were carried out at three replicates (n=3). The outputs were analysed using one-way ANOVA (IBM SPSS Statistics 25) along with the post hoc Tukey’s test. The significance differences were tested at p<0.05.
RESULTS AND DISCUSSION
Colour Analysis
Table 1 shows the colour of fresh (control) and ultrasound-treated chicken and duck egg white, as well as their gels. Overall, there were significant differences (p<0.05) between the control and ultrasound-treated samples for both egg white and egg white gels. According to the results, sonication caused an apparent effect on the colour of both chicken and duck egg white. It is worth noting that fresh foods normally have bright colour that affects the consumers’ desire and satisfaction towards the food (Beardsworth et al., 2004). Thus, colour plays an important role in evaluating food quality. Based on the Hunter Lab colour scale system, L* indicates brightness (whiteness (+) or darkness (-)), a* indicates redness (+) or greenness (-), b* indicates yellowness (+) or blueness (-), and delta value (ΔE) shows the differences between standard and each sample in terms of L*, a*and b* (Sze et al., 2018).
As tabulated in Table 1, L* value for chicken egg white increased with the increase of sonication treatment temperature. Control showed the highest value (37.48 ± 1.80) among samples that was also evidenced by a significant difference (p<0.05) between control and ultrasound-treated samples. Ultrasound-treated sample at 25ºC had the lowest value (20.04 ± 0.17) which indicates that it had a darker colour as compared to other samples. For a* value, there was a significant difference (p<0.05) between ultrasound-treated samples in comparison to the control. Ultrasound-treated sample at 45ºC (-3.42 ± 0.23)
Table 1: Colour of fresh and ultrasound-treated chicken and duck egg white, and egg white gel
| Egg white |
Egg white gel |
|||||||
| Treatment time (°C) |
L* | a* | b* | ∆E | L* | a* | b* | ∆E |
| Chicken | ||||||||
| 0 |
37.48 ± 1.80d |
-1.97 ± 0.13c |
28.46 ± 1.43c |
62.10 ± 1.11a |
85.06 ± 0.53a |
-3.82 ± 0.07b |
13.66 ± 0.03a |
14.14 ± 0.31a |
| 25 |
20.04 ± 0.17a |
-3.24 ± 0.20a |
13.65 ± 0.40a |
75.11 ± 0.16d |
84.05 ± 0.10a |
-4.16 ± 0.02a |
16.02 ± 0.05c |
16.56 ± 0.10b |
| 35 |
20.87 ± 0.24a |
-3.38 ± 0.67a |
14.03 ± 0.61a |
74.35 ± 0.16d |
85.27 ± 1.09a |
-3.82 ± 0.07b |
15.82 ± 0.47c |
15.59 ± 1.02b |
| 45 |
23.92 ± 0.78b |
-3.42 ± 0.23a |
17.45 ± 1.04b |
71.90 ± 0.58c |
84.45 ± 0.11a |
-3.90 ± 0.09b |
15.72 ± 0.08bc |
16.02 ± 0.05b |
| 55 |
26.70 ± 1.00c |
-2.57 ± 0.22b |
19.56 ± 1.10b |
69.65 ± 0.69b |
84.40 ± 0.52a |
-3.60 ± 0.09c |
15.12 ± 0.24b |
15.54 ± 0.54ab |
| Duck | ||||||||
| 0 |
34.56 ± 3.79b |
-1.55 ± 0.49b |
0.61 ± 0.44c |
61.35 ± 4.18a |
83.63 ± 0.51bc |
-3.14 ± 0.04b |
6.35 ± 0.16a |
11.57 ± 0.51a |
| 25 |
21.85 ± 0.21a |
-2.11 ± 0.10ab |
-4.34 ± 0.16a |
73.08 ± 0.22b |
79.24 ± 1.74a |
-3.46 ± 0.05a |
7.52 ± 0.11d |
16.05 ± 1.65b |
| 35 |
21.99 ± 0.05a |
-2.17 ± 0.12ab |
-4.17 ± 0.08a |
72.92 ± 0.05b |
81.36 ± 0.23ab |
-3.18 ± 0.02b |
7.35 ± 0.03cd |
13.92 ± 0.23b |
| 45 |
23.73 ± 0.74a |
-2.24 ± 0.05a |
-4.47 ± 0.06b |
71.44 ± 0.17b |
83.98 ± 0.03c |
-2.64 ± 0.02d |
6.67 ± 0.02b |
11.18 ± 0.02a |
| 55 |
25.61 ± 0.45a |
-2.36 ± 0.15a |
-3.42 ± 0.08b |
69.26 ± 0.45b |
83.54 ± 0.52bc |
-2.76 ± 0.07c |
7.07 ± 0.16c |
11.67 ± 0.38a |
*a-d Values are mean ± standard deviation. Different letters in the same column indicate significant differences (p<0.05) in respective source of egg (chicken or duck).
Table 2: pH for fresh chicken and duck egg white, and expressible moisture and folding test of their gels
| Egg white |
Egg white gel |
||
| Treatment time (°C) |
pH |
Expressible moisture (%) |
Folding test |
| Chicken | |||
| Control |
9.45 ± 0.03c |
25.58 ± 1.70b |
2.00 ± 0.00a |
| 25 |
9.33 ± 0.01b |
17.26 ± 2.25a |
3.33 ± 0.58b |
| 35 |
9.33 ± 0.02b |
18.43 ± 0.72a |
3.33 ± 0.58b |
| 45 |
9.32 ± 0.02b |
19.49 ± 2.31a |
3.00 ± 0.00b |
| 55 |
9.22 ± 0.02a |
16.77 ± 1.42a |
2.00 ± 0.00a |
| Duck | |||
| Control |
9.49 ± 0.02b |
32.46 ± 2.16b |
2.00 ± 0.00a |
| 25 |
9.28 ± 0.12a |
16.24 ± 3.54a |
2.00 ± 0.00a |
| 35 |
9.27 ± 0.03a |
18.04 ± 1.08a |
2.67 ± 0.58ab |
| 45 |
9.21 ± 0.01a |
19.16 ± 0.47a |
3.00 ± 0.00b |
| 55 |
9.30 ± 0.01a |
20.77 ± 0.68a |
2.67 ± 0.58ab |
*a-c Values are mean ± standard deviation. Different letters in the same column indicate significant differences (p<0.05) in respective source of egg (chicken or duck).
had the highest a* value (in the negative direction) whereas control sample with -1.97 ± 0.13 was the lowest. Hence, ultrasound-treated sample at 45ºC had a greater greenness intensity while the colour of control sample had a higher degree of redness.
Similarly, b* value of chicken egg white increased with the increasing treatment temperature. b* value for control and ultrasound-treated sample at 25ºC was the greatest (28.46 ± 1.43) and the lowest (13.65 ± 0.40), respectively. This showed that control had a significantly greater (p<0.05) degree of yellowness than that of other samples. Besides, there was a significant difference (p<0.05) in delta value (ΔE) between ultrasound-treated samples in comparison to the control. According to Table 1, control had the lowest ΔE value (62.10 ± 1.11) as compared to ultrasound-treated sample at 25ºC with the highest ΔE value (75.11 ± 0.16). It was found that ΔE value decreased with the increasing treatment temperature. Duck egg white demonstrated the similar trends in L*, a*, b* and ΔE values. Interestingly, b* values for ultrasound-treated samples were in the range of -4.34 to -3.42, which implied a greater degree of blueness for the samples.
On the other hand, L* value of raw and ultrasound-treated chicken egg white gels did not show a significant difference (p>0.05) among the samples. Ultrasound-treated chicken egg white gel at 35ºC showed the highest L* value (85.27 ± 1.09), whereas the gel treated at 25ºC had the lowest L* value (84.05 ± 0.10) which was the darkest as compared to other samples. While for duck egg white gels, L* value for ultrasound-treated gel at 25ºC (79.24 ± 1.74) was significantly the lowest (p<0.05) than that of other samples. The L* values showed a trend of increasing with the increase in treatment temperature. In addition, a*, b* and ΔE values for both chicken and duck egg white gels depicted the similar trends whereby ultrasound-treated sample at 25ºC had a significantly higher (p<0.05) value in comparison to control but it had gradually reduced with the increasing treatment temperature. Interestingly, the degree of yellowness had become more pronounced (6.35 to 7.52) in duck egg white gels if compared with the greater blueness intensity in duck egg white (-4.47 to 0.61).
The ultrasound treatment, therefore, was found to cause changes of colour in food due to internal factors of food, as well as the ultrasound conditions (Bi et al., 2015). Sample with a higher b* value is probably caused by the browning process (Maillard reaction). Egg white contains protein glucose with reducing sugars and amino group, hence the dark yellowish colour in the sample might be caused by the Maillard reaction during the ultrasound process with the increasing treatment temperature (Katekhong and Charoenrein, 2017). Besides, Pingret et al. (2013) reported that degradation or losses of other compounds occur during ultrasound process especially when the medium used is liquid, as water content is one of the factors that changes the ΔE value. Maillard reaction may occur in sample with a high water content, which has more molecules with mobility that eventually causes a higher browning rate (Katekhong and Charoenrein, 2017). Ultrasound treatment is recognized as a pyrolysis reaction mechanism and oxidation by OH- radical formed by cavitation. Therefore, ultrasound treatment with higher temperature will cause more changes especially the in darkening of duck egg gel (Quan and Benjakul, 2018).
Ph Analysis
pH analysis was carried out to determine the effect of sonication at different temperatures for both chicken and duck egg white. Table 2 shows the pH values for both fresh and ultrasound-treated chicken and duck egg white. The pH values for all ultrasound-treated chicken egg white were seen to demonstrate a significant difference (p<0.05) as compared to control. Furthermore, pH of ultrasound-treated chicken egg white at 55°C had been greatly reduced (pH 9.22 ± 0.02) that it was significantly the lowest (p<0.05) among the samples. Similarly, ultrasound-treated duck egg whites had a significantly lower (p<0.05) pH in comparison to control but there were no significance differences (p>0.05) observed between the egg whites treated at different temperatures.
Based on a study by Yuceer et al. (2014), pH values of fresh egg white fall in the range of pH 7.5 - 8.5. Thus, the increase of pH value in egg white can be associated with the deterioration of the egg quality. Increase of pH value from pH 7.0 to 9.5 could be induced by an increase of storage time, whereby carbon dioxide was found to release as a result of breakdown of carbonic acid that occurred in the egg white (Scott and Silversides, 2000). This will cause changes in the bicarbonate buffer system, since carbon dioxide released through the pores on the surface of the egg shell turns it into alkaline as evidenced by the increase of pH value. Not only that, the increase of pH value in egg white will also cause an increase in viscosity, penetration force and elasticity of the gel (Croguennec et al., 2002).
Expressible Moisture (Em)
Table 2 shows the EM for chicken and duck egg white gels. EM is an useful technique in determining the amount of liquid squeezed from the protein system using force (Huda et al., 2013). There were significant differences (p<0.05) between the control and ultrasound-treated samples in both types of gels. Both chicken and duck egg white gels had demonstrated the same trend whereas the control had a significantly higher (p<0.05) EM as compared to samples that were ultrasound-treated at different temperatures. However, there were no significant differences (p>0.05) observed between the ultrasound-treated samples at different temperatures.
As the EM increases, the amount of water entrapped decreases (Ramirez et al., 2007). Sonication can prevent the water loss from protein system (egg white gel) as compared to the one in control. This was evidenced by the significantly lower (p<0.05) EM of ultrasound-treated egg white gels which implied that the water holding capacity of egg white gel had improved, due to the use of sonication. Protein in egg white can form a strong gel matrix, thus, higher amount of water could be entrapped in the egg white gel network (Klomklao et al., 2016).
Folding Test
Folding test is the easiest and fastest way to analyze the gel strength and the ability of a gel to fold (Nowsad et al., 2000). A gel with good strength would not be broken down easily. Generally, folding test is a subjective analysis that can be used as an indicator to compare the strength of the gel samples. Nevertheless, it does not have the ability to evaluate other functionalities of the gel sample (Huda et al., 2013). Result of folding test for chicken and duck egg white gels had been recorded in Table 2. Interestingly, control and ultrasound-treated sample at 55ºC showed no significant differences (p>0.05) by having the same score (2.00 ± 0.00). However, there were significant differences (p<0.05) between the control chicken egg white gel sample and samples treated at 25ºC (3.33 ± 0.58), 35ºC (3.33 ± 0.58) and 45ºC (3.00 ± 0.00). Samples treated at 25ºC and 35ºC had a higher springiness with the score of 3.33. It is worth noting that the ability to withstand folding force is related to the concentration of protein, hardness and springiness of the gel. When a high concentration of protein is used to construct the 3-D gel network, a strong and elastic gel can be formed (Ren et al., 2010). This is because a gel with high springiness can withstand more folding force than that of a gel with high hardness.
While for duck egg white gel, there was no significant differences (p>0.05) between control and gel ultrasound-treated at 25ºC. Nonetheless, gels that were ultrasound-treated at 35ºC, 45ºC and 55ºC showed a significantly higher (p<0.05) score at 2.67 ± 0.58, 3.00 ± 0.00 and 2.67 ± 0.58, respectively. Sample treated at 45ºC had the highest strength of gel as compared to other samples whereby it was deduced that it had a higher ability to withstand folding force due to its higher score. Hence, sonication could be useful in improving the quality of chicken and duck egg white gel.
Gel Strength (Tube Inverting Test)
Table 3 shows the gel strength analysis using tube inverting test with different ratios between chicken or duck egg white, and water. Figure 1 shows the formation of gel from fresh chicken and duck egg white samples whereby the stability and gel strength can be observed when the tubes were inverted. As a parameter for this type of gel, minimum concentration of the egg white should be fixed in order to carry out the tube inverting test (Niehoff et al., 2013).
As depicted in Figure 1, the minimum concentration for chicken egg white in control and samples that were ultrasound-treated at 25ºC and 55ºC to form gel was 60%. Meanwhile, ultrasound-treated samples at 35ºC and 45ºC required only 50% of egg white to form a gel. No gel formation was observed with the use of egg white at concentration of 10%, 20%, 30% and 40%. However, the formation of gel using 50% of egg white was not stable. Hence, higher concentration of egg white in the range of 60% to 100% could be used to form a stable gel with a stronger network structure. Hardness and stability of egg white gel increase logarithmically with the increase of protein concentration (Quan and Benjakul, 2019). When the concentration of protein is high, the 3-D gel network will be formed through the linkage between linear aggregation of this solution (Ren et al., 2010).
Similarly, the minimum amount of duck egg white needed to form a gel is 60% for the control. Nevertheless, the amount of egg white needed for ultrasound-treated samples were lower as compared to control, which was only 40%. When the concentration of egg white is high enough, the stronger the ionic strength and the closer the pH value to the iso-electric point, which are the main factors that contribute to the formation of the 3-D network of a gel (Campbell et al., 2003).
Table 3: Gel strength (Tube inverting test) for fresh chicken and duck egg white
| Treatment time (°C) |
Concentration of egg white (%) |
|||||||||
| 10 | 20 | 30 | 40 | 50 | 60 | 70 | 80 | 90 | 100 | |
| Chicken egg white gel | ||||||||||
| Control | - | - | - | - | - | + | + | + | + | + |
| 25 | - | - | - | - | - | + | + | + | + | + |
| 35 | - | - | - | - | + | + | + | + | + | + |
| 45 | - | - | - | - | + | + | + | + | + | + |
|
55 Duck egg white gel |
- | - | - | - | - | + | + | + | + | + |
| Control | - | - | - | - | - | + | + | + | + | + |
|
25 |
- | - | - | + | + | + | + | + | + | + |
| 35 | - | - | - | + | + | + | + | + | + | + |
| 45 | - | - | - | + | + | + | + | + | + | + |
|
55 |
- | - | - | + | + | + | + | + | + |
+ |
Note: - No gel formation observed. + Gel formation observed.
Table 4: Texture profile analysis of chicken and duck egg white gels
| Treatment time (°C) |
Hardness (g) |
Cohesiveness (ratio) |
Springiness (mm) |
Chewiness (mJ) |
Adhesiveness (mJ) |
| Chicken egg white gel | |||||
| Control |
2619.33 ± 181.93a |
0.52 ± 0.12a |
6.28 ± 0.43a |
111.8 ± 21.05a |
0.36 ± 0.07a |
| 25 |
3199.67 ± 184.79a |
0.61 ± 0.04ab |
9.23 ± 0.19b |
196.57 ± 16.89b |
1.00 ± 0.44ab |
| 35 |
3019.17 ± 622.33a |
0.66 ± 0.09b |
9.02 ± 0.24b |
179.80 ± 16.89b |
0.87 ± 0.49ab |
| 45 |
3399.67 ± 193.87a |
0.63 ± 0.03ab |
9.12 ± 0.28b |
203.97 ± 17.65b |
0.53 ± 0.21ab |
| 55 |
3193.33 ± 75.41a |
0.64 ± 0.04ab |
8.71 ± 0.31b |
198.50 ± 10.75b |
1.33 ± 0.08b |
| Duck egg white gel | |||||
| Control |
1760.50 ± 131.19a |
0.72 ± 0.04a |
5.53 ± 0.03a |
83.67 ± 7.79a |
0.97 ± 0.47a |
| 25 |
2732.50 ± 149.92c |
0.82 ± 0.02b |
6.14 ± 0.16b |
141.60 ± 6.38c |
1.60 ± 0.26a |
| 35 |
2602.00 ± 165.47bc |
0.84 ± 0.01b |
6.26 ± 0.07b |
135.00 ± 3.70c |
1.60 ± 0.35a |
| 45 |
2432.67 ± 259.67bc |
0.73 ± 0.03a |
6.37 ± 0.23b |
121.67 ± 11.29bc |
1.73 ± 0.21a |
| 55 |
2143.23 ± 243.80ab |
0.77 ± 0.0 a |
6.30 ± 0.06b |
99.37 ± 16.52ab |
1.40 ± 0.00a |
*a-b Values are mean ± standard deviation. Different letters in the same column indicate significant differences (p<0.05) in respective source of egg (chicken or duck).
Texture Profile Analysis (Tpa)
TPA of chicken and duck egg white gels were carried out by measuring several parameters, which are hardness, cohesiveness, springiness, chewiness and adhesiveness (Table 4). Significant differences (p<0.05) can be observed from the textural parameters between control and ultrasound-treated samples.
Hardness is related to strength of the gel structure under pressure and is measured from the peak force during the first compression cycle (Chandra and Shamasundar, 2015). The formation of egg white gel normally is controlled by different intermolecular interactions such as hydrogen bond, electrostatic and hydrophobic interactions, Van der Waals forces and covalent bond (disulphide cross-linkage) (Eleya and Gunasekaran, 2002). For hardness of chicken egg white gel, no significant differences (p>0.05) were observed among the samples. Ultrasound-treated samples had a higher hardness than that of control in this experiment. Gel formed from control had the lowest hardness value with 2619.33 ± 181.93 g as compared to other ultrasound-treated samples. Sample with the highest hardness value is the sample that was ultrasound-treated at 45ºC (3399.67 ± 193.87) g. This is probably because sonication changes the internal structure of the gel that has enhanced the gel strength (Zhang et al., 2014). The increase of hardness and strength of the gel also showed a better consistency of the product.
For duck egg white gel, there were significant differences (p<0.05) in hardness between control and ultrasound-treated samples. Ultrasound-treated samples had a significantly higher (p<0.05) values than that of control, and the hardness values decreased with the increase of treatment temperatures. Sonication had improved the hardness (strength) of duck egg white gel. However, ultrasound treatment at a higher temperature had caused the denaturation of protein in gel and reduced its hardness. The texture of gel is associated to the structure network such as density, size, uniformity or distribution of the pores of gel. Sonication causes the exposure of hydrophobic residue that are found in the protein molecules. The increase of hydrophobic interaction in protein molecules promotes the formation of protein gel network structure. Hence, the gel network formed is rigid and uniform with a high gel strength (Phillips and Williams, 2011).
Cohesiveness is one of the parameters to identify the breakdown of a gel’s internal structure. Based on Table 4, there were significant differences (p<0.05) observed between control and ultrasound-treated chicken egg white gel samples. Control showed the significantly lowest (p<0.05) cohesiveness (0.52 ± 0.12) among the samples, whereas sample that was ultrasound-treated at 35ºC had the significantly highest (p<0.05) cohesiveness (0.66 ± 0.09). Cohesiveness is often regarded as an ability indicator of a gel to retain its intact structure network, which is related to how good the product undergoes structural changes during the second compression as compared to the first compression (Raikos et al., 2007). If the cohesiveness value increases, the gel product can withstand the second compression better. Tabilo-Munizaga and Barbosa-Cánovas (2004) stated that the extent of sample recovery after the first compression could be indicated by the closeness of cohesiveness value to 1. The increase of cohesiveness value in ultrasound-treated samples indicates that the gels formed were more stable and able to retain the structure during compression, which promote better biting or chewing properties. This could be due to the increase of cross-linkage in protein network, resulting a stronger, more elastic and packed gel.
While for duck egg white gel, data shows significant differences (p<0.05) in cohesiveness between control and ultrasound-treated samples at 25ºC and 35ºC. However, there were no significant differences (p>0.05) observed between control and samples treated at 45ºC and 55ºC. Control had the lowest cohesiveness value with 0.72 ± 0.04 among the samples, while sample treated at 35ºC had the highest cohesiveness value at 0.84 ± 0.01. Based on Table 4, the data shown is not consistent, but the cohesiveness of duck egg white gel decreased as the treatment temperature increased. The decrease of cohesiveness value could be due to the disruption of high temperatures on the ability of product to hold together during formation of gel (Chandra and Shamasundar, 2015).
Apart from the two parameters that had been discussed, springiness is the parameter which demonstrates the ability of a gel to recover after the end of the first bite and the beginning of the second bite. If the gel has a high springiness, more forces are required during the chewing process (Chandra and Shamasundar, 2015). There were significant differences (p<0.05) between control and ultrasound-treated samples of both chicken and duck egg white gel. Springiness for chicken egg white gel in control sample showed the significantly lowest (p<0.05) springiness value at 6.28 ± 0.43 mm, whereas ultrasound-treated sample at 25ºC had the significantly highest (p<0.05) springiness (9.23 ± 0.19 mm). There was a decreasing trend observed in springiness values as the treatment temperature increased. Springiness is related to folding test, whereby a sample with high hardness and springiness results in a higher score for folding test, that were evidenced by the better quality in the gels formed from ultrasound-treated egg white samples. On the other hand, there were no significant differences (p>0.05) between the ultrasound-treated duck egg white samples as the treatment temperature increased. Ultrasound-treated samples with a greater springiness in comparison to control, implied a greater gel strength in folding test and they are more capable to withstand the forces of being folded. Springiness is also known as “elasticity” or “rubbery” of gel in the mouth. It is the textural parameter that shows the ability of a gel structure to be broken down by early compression (Lau et al., 2000).
In addition, textural attributes such as chewiness and adhesiveness for chicken and duck egg white gels are also tabulated in Table 4. Chewiness can be calculated based on the hardness, which is the durability towards compression force (Yilmaz et al., 2012). There were significant differences (p<0.05) in chewiness between control and ultrasound-treated samples of chicken egg white gels, but ultrasound-treated samples were not significantly different (p>0.05) from each other despite the increasing treatment temperature. Control had the significantly lowest (p<0.05) chewiness value (111.80 ± 21.05) mJ whereas ultrasound-treated sample at 45ºC had the significantly highest (p<0.05) value of chewiness (203.97 ± 17.65) mJ. Interestingly, cohesiveness of duck egg white samples showed a decreasing trend as the treatment temperature increased, and they were significantly higher (p<0.05) than that of control. These changes are mostly resulted by the changes of protein conformation caused by heat.
Adhesiveness can be defined as the force needed for the attraction between the product and certain surfaces (Raikos et al., 2007). There were significant differences (p<0.05) in adhesiveness parameter between control and ultrasound-treated samples of chicken egg white gels. Control had the significantly lowest (p<0.05) adhesiveness value (0.36 ± 0.07) mJ, while ultrasound-treated sample at 55ºC showed the significantly highest (p<0.05) adhesiveness value (1.33 ± 0.08) mJ. For duck egg white gel, there were no significant differences (p>0.05) observed among all samples despite the higher adhesiveness values recorded in ultrasound-treated samples. Adhesiveness of control sample (0.97 ± 0.47) mJ was the lowest and ultrasound-treated sample at 45ºC had the highest adhesiveness value (1.73 ± 0.21) mJ. The higher adhesiveness value indicates that the gel formed is softer (Chandra and Shamasundar, 2015).
Foaming Analysis
Foaming ability has two main characteristics. The first one is the foaming capacity which measures the amount of the foam formed, and could be defined as the extra output percentage and measurement of time for the foam to collapse (Tan et al., 2016). Foam formation in food is normally caused by physical methods, such as whipping, shaking and kneading, or other methods which affect the characteristics of a foam. To ensure a good foaming ability, protein should be moved and adsorbed as fast as possible on the air-liquid interface, which is followed by surface denaturation and changes in molecular configuration. Reduction in surface tension and association of partially unfolded molecules build a stabilising film around the bubbles, that eventually contribute to the stability of a foam (Lomakina and Mikova, 2006). Table 5 shows the foaming capacity and foaming stability of fresh and ultrasound-treated samples for both chicken and duck egg white.
Interestingly, there was no significance difference (p>0.05) in foaming capacity between control and ultrasound-treated chicken egg white samples despite the higher foaming capacity observed in ultrasound-treated samples. Control had the lowest foaming capacity (108.33 ± 2.89)% while ultrasound-treated chicken egg white at 45ºC had the highest value (140.00 ± 5.00)%. On the other hand, there were significant differences (p<0.05) between foaming capacity of control and ultrasound-treated duck egg white samples. Control showed the significantly lowest (p<0.05) foaming capacity (105.00 ± 5.00)% among all duck egg white samples. Similar to chicken egg white, duck egg white samples that were ultrasound-treated at different temperatures did not show a consistent trend as the treatment temperature increased. Although the increase of protein denaturation increased the foaming capacity, sonication may have changed the protein conformation by reducing the ability of protein to unfold on the interface and lead to weaker surface activities (Karki et al., 2009).
For foaming stability, there were no significant differences (p>0.05) observed among the chicken egg white samples. Furthermore, foaming stability of the ultrasound-treated samples did not show a trend as the treatment temperature increased. The inconsistent trend can be observed in ultrasound-treated duck egg white samples as well despite of their significant differences (p<0.05) in foaming stability as compared to control. Although the data obtained shows a non-consistent manner, there were significant differences (p<0.05) between ultrasound-treated samples at 25ºC (36.67 ± 2.89)% and 45ºC (38.33 ± 5.77)%, in comparison to the ultrasound-treated sample at 55ºC (66.67 ± 15.28)%. According to Morales (2015), the use of high sonication temperature (70ºC, 80ºC and 85ºC) will increase the foaming stability as compared to samples at room temperatures (25ºC). It was also proven that a longer time was taken for foam of ultrasound-treated samples at 80ºC and 85ºC to collapse, that indicates a better foam stability. It is deduced that low sonication temperatures may not improve the foam stability as evidenced by the insignificant differences (p>0.05) for ultrasound-treated samples at lower treatment temperatures.
Application of ultrasound resulted in an improvement of protein foam. Sonication improves foaming properties as partial denaturation of protein affects the ability for foam forming due to the decrease of particle size. This has enhanced the foam stability as the size reduction improved solubility and increased surface area that facilitate protein adsorption at the interface. Moreover, cavitation developed during protein aggregation breakdown process leads to the increase rate of protein absorption on the surface system (Higuera et al., 2016). Denatured protein caused by ultrasound treatment has a different number of hydrophobic residues, charge, electrostatic repulsion, and ionic hydration that could improve protein foaming ability (Karki et al., 2009).
Emulsification Analysis
Based on Table 5, emulsification stability for both chicken and duck egg white showed no significant differences (p>0.05) among the samples. Nonetheless, emulsification stability for ultrasound-treated samples had a higher value as compared to control. For both type of egg whites, data obtained shows a non-consistency, whereby no trend was observed as the treatment temperatures increased. The improved emulsification stability can be explained by the better oriented protein produced from sonication and the integration of oil droplets in the emulsion process (Yanjun et al., 2014). Besides, higher temperatures alter the emulsion properties by changing the particle size, secondary structure and surface hydrophobicity of the protein. Increase in surface hydrophobicity of protein is caused by the unfolding of protein molecules upon heat, as well as the molecular size via hydrophobic interaction and formation of disulphide (Yu et al., 2007). According to Zhou et al. (2016), stability for emulsification decreases owing to the
Table 5: Foaming capacity, foaming stability and emulsification stability for chicken and duck egg white
| Treatment time (°C) |
Foaming capacity (%) |
Foaming stability (%) |
Emulsification stability (%) |
| Chicken egg white | |||
| Control |
108.33 ± 2.89a |
50.00 ± 5.00a |
31.97 ± 1.15a |
| 25 |
125.00 ± 18.03a |
52.67 ± 12.58a |
34.19 ± 0.65a |
| 35 |
116.67 ± 11.55a |
58.33 ± 7.64a |
39.44 ± 5.10a |
| 45 |
140.00 ± 5.00a |
36.67 ± 5.77a |
35.21 ± 4.75a |
|
55
Duck egg white |
121.67 ± 18.93a |
55.00 ± 8.66a |
32.43 ± 2.50a |
| Control |
105.00 ± 5.00a |
45.00 ± 8.66ab |
26.08 ± 9.66a |
| 25 |
140.00 ± 5.00b |
36.67 ± 2.89a |
30.13 ± 1.10a |
| 35 |
121.67 ± 15.28ab |
43.33 ± 12.58ab |
30.92 ± 5.36a |
| 45 |
128.33 ± 7.64ab |
38.33 ± 5.77a |
29.87 ± 4.65a |
| 55 |
140.00 ± 10.00b |
66.67 ± 15.28b |
30.61 ± 1.07a |
*a-b Values are mean ± standard deviation. Different letters in the same column indicate significant differences (p<0.05) in respective source of egg (chicken or duck).
changes of flexibility in the protein molecules. Extreme temperature and pressure resulted by ultrasound might be the main factor that change the emulsification properties. Protein which undergoes denaturation exposes its hydrophobic side, followed by aggregation of protein. Hence, future studies are required to gain a better understanding on relationship between the ultrasound duration, intensity or frequency of ultrasonic waves, and their influences on functional properties of foods (Soria and Villamiel, 2010).
CONCLUSION
Qualities of both chicken and duck egg white had improved after ultrasound treatment but the effect of increasing treatment temperatures was not significant in general. Ultrasound-treated egg whites and their gels were darker with reduced pH and expressible moisture, as well as a higher score in folding test, gel strength and texture profile analysis. Functional properties of egg whites were enhanced with the use of ultrasound treatment but the impact was more pronounced in duck egg whites. Data obtained in this preliminary study were inconsistent that no trend could be observed with the increasing treatment temperature. Hence, it was suggested to explore the relationship between the ultrasound duration, intensity or frequency of ultrasonic waves with the treatment temperature on the functional properties of egg white especially on duck egg white that demonstrated a more promising result.
ACKNOWLEDGEMENTS
The authors acknowledge with gratitude the support provided by Universiti Malaysia Sabah.
CONFLICT OF INTEREST
The authors declare no conflict of interest.
AUTHORS CONTRIBUTION
Samantha Shiuan Erl Lee: Involved in the data collection, data analysis, and drafted the manuscript. Nurul Huda: Involved in the conceptualization of idea, supervision, funding, writing review and editing the manuscript. Yetti Marlida: Involved in the writing review and editing the manuscript. Eng-Keng Seow: Involved in the writing review and editing the manuscript.
REFERENCES
Alamprese C, Casiraghi E, Rossi M (2012). Foaming, gelling and rheological properties of egg albumen as affected by the housing system and the age of laying hens. Int. J. Food Sci. 47(7): 1411-1420. Https://doi.org/10.1111/j.1365-2621.2012.02988.x
Beardsworth PM, Hernandez JM (2004). Yolk colour–an important egg quality attribute. Int. Poult. Prod. 12(5): 17-18.
Bi X, Hemar Y, Balaban MO, Liao X (2015). The effect of ultrasound on particle size, color, viscosity and polyphenol oxidase activity of diluted avocado puree. Ultrason Sonochem 27: 567-575. Https://doi.org/10.1016/j.ultsonch.2015.04.011
Buamard N, Benjakul S, Konno K (2017). Improvement of gel quality of sardine surimi with low setting phenomenon by ethanolic coconut husk extract. J. Texture Stud. 48(1): 47-56. Https://doi.org/10.1111/jtxs.12207
Campbell L, Raikos V, Euston SR (2003). Modification of functional properties of egg-white proteins. Nahrung/Food 47(6): 369–376. Https://doi.org/10.1002/food.200390084
Chandra M, Shamasundar B (2015). Texture profile analysis and functional properties of gelatin from the skin of three species of fresh water fish. Int. J. Food Prop. 18: 572-584. Https://doi.org/10.1080/10942912.2013.845787
Croguennec T, Nau F, Brule G (2002). Influence of pH and salts on egg white gelation. J. Food Sci. 67: 608–614. Https://doi.org/10.1111/j.1365-2621.2002.tb10646.x
Dong X, Zhang Y (2021). An insight on egg white: From most common functional food to biomaterial application. J. Biomed. Mater. Res. 109(7): 1045-1058. Https://doi.org/10.1002/jbm.b.34768
Eleya MMO, Gunasekaran S (2002). Gelling properties of egg white produced using a conventional and a low-shear reverse osmosis process. J. Food Sci. 67: 725-729. Https://doi.org/10.1111/j.1365-2621.2002.tb10666.x
Flores-Jiménez NT, Ulloa JA, Silvas JEU, Ramírez JCR, Ulloa PR, Rosales PUB, Carrillo YS, Leyva RG (2019). Effect of high-intensity ultrasound on the compositional, physicochemical, biochemical, functional and structural properties of canola (Brassica napus L.) protein isolate. Food Res. Int. 121: 947-956. Https://doi.org/10.1016/j.foodres.2019.01.025
Higuera-Barraza OA, Del Toro-Sanchez CL, Ruiz-Cruz S, Márquez-Ríos E (2016). Effects of high-energy ultrasound on the functional properties of proteins. Ultrason Sonochem 31: 558-562. Https://doi.org/10.1016/j.ultsonch.2016.02.007
Huda N, Seow EK, Normawati MN, Aisyah NN, Fazilah A, Easa AM (2013). Effect of duck feet collagen addition on physicochemical properties of surimi. Int. Food Res. J. 20(2): 537.
Hui HS, Seow EK, Huda N (2022). Physicochemical properties of duck egg white treated with different ultrasound time. J. Anim. Health Prod. 10(1): 43-50.
Isabel G, Hui YH, Alarcón-Rojo AD, Alvarado C, Bawa AS, Guerrero-Avendaño F, Lundén J, McKee L, Pérez-Álvarez JÁ, Mine Y, Owens CM, Regenstein JM (2010). Handbook of Poultry Science and Technology, Primary Processing. John Wiley and Sons, pp. 533-579.
Jambrak AR, Lelas V, Mason TJ, Krešić G, Badanjak M (2009). Physical properties of ultrasound treated soy proteins. J. Food Eng. 93(4): 386-393. Https://doi.org/10.1016/j.jfoodeng.2009.02.001
Karki B, Lamsal BP, Grewell D, Pometto III AL, Van Leeuwen J, Khanal SK, Jung S (2009). Functional properties of soy protein isolates produced from ultrasonicated defatted soy flakes. J. Am. Oil Chem. Soc. 86(10): 1021-1028. Https://doi.org/10.1007/s11746-009-1433-0
Katekhong W, Charoenrein S (2017). Color and gelling properties of dried egg white: Effect of drying methods and storage conditions. Int. J. Food Prop. 20(9): 2157-2168. Https://doi.org/10.1080/10942912.2016.1233429
Klomklao S, Benjakul S, Kishimura H, Osako K, Simpson BK (2016). Trypsin inhibitor from yellowfin tuna (Thunnus albacores) roe: Effects on gel properties of surimi from bigeye snapper (Priacanthus macracanthus). LWT-Food Sci. Technol. 65: 122-127. Https://doi.org/10.1016/j.lwt.2015.07.074
Lau M, Tang J, Paulson A (2000). Texture profile and turbidity of gellan/gelatin mixed gels. Food Res. Int. 33: 665–671. Https://doi.org/10.1016/S0963-9969(00)00111-3
Lechevalier V, Jeantet R, Arhaliass A, Legrand J, Nau F (2007). Egg white drying: Influence of industrial processing steps on protein structure and functionalities. J. Food Eng. 83(3): 404-413. Https://doi.org/10.1016/j.jfoodeng.2007.03.033
Lomakina K, Mikova K (2006). A study of the factors affecting the foaming properties of egg white–a review. Czech J. Food Sci. 24(3): 110-118.
Martins AJ, Silva P, Maciel P, Pastrana LM, Cunha RL, Cerqueira MA, Vicente AA (2019). Hybrid gels: Influence of oleogel/ hydrogel ratio on rheological and textural properties. Food Res. Int. 116: 1298-1305. Https://doi.org/10.1016/j.foodres.2018.10.019
Morales R, Martínez KD, Ruiz-Henestrosa VMP, Pilosof AM (2015). Modification of foaming properties of soy protein isolate by high ultrasound intensity: Particle size effect. Ultrason Sonochem 26: 48-55. Https://doi.org/10.1016/j.ultsonch.2015.01.011
Munday E, Werblin L, Deno K (2017). Mayonnaise Application Research: Comparing the Functionality of Eggs to Egg Replacers in Mayonnaise Formulations, CuliNex, LLC, Seattle, USA.
Mun S, Kim YL, Kang CG, Park KH, Shim JY, Kim YR (2009). Development of reduced-fat mayonnaise using 4αGTase-modified rice starch and xanthan gum. Int. J. Biol. Macromol. 44(5): 400-407. Https://doi.org/10.1016/j.ijbiomac.2009.02.008
Niehoff A, Mantion A, McAloney R, Huber A, Falkenhagen J, Goh CM, Thunemann AF, Winnik MA, Menzel H (2013). Elucidation of structure of poly(γ-benzyl-L-glutamate) nanofibers and gel networks in a helicogenic solvent. Colloid Polym. Sci. 291: 1353-1363. Https://doi.org/10.1007/s00396-012-2866-9
Nikzade V, Tehrani MM, Saadatmand-Tarzjan M (2012). Optimization of low-cholesterol–low-fat mayonnaise formulation: Effect of using soy milk and some stabilizer by a mixture design approach. Food Hydrocoll. 28(2): 344-352. Https://doi.org/10.1016/j.foodhyd.2011.12.023
Nowsad AAKM, Kanoh S, Niwa E (2000). Thermal gelation characteristics of breast and thigh muscles of spent hen and broiler and their surimi. Meat Sci. 54(2): 169-175. Https://doi.org/10.1016/S0309-1740(99)00091-1
Phillips GO, Williams PA (2011). Egg proteins. In: Strixner T, Kulozik U, Handbook of food proteins. Woodhead Publishing Limited, Oxford, pp 150–209.
Pingret D, Fabiano-Tixier AS, Chemat F (2013). Degradation during application of ultrasound in food processing: A review. Food Control 31(2): 593-606. Https://doi.org/10.1016/j.foodcont.2012.11.039
Pyler EJ, Gorton LA (2010). Baking Science and Technology, Fourth Edition, Volume 1, Sosland Publishing Co., Kansas City, Missouri, USA.
Quan TH, Benjakul S (2018). Gelling properties of duck albumen powder as affected by desugarization and drying conditions. J. Texture Stud. 49(5): 520-527. Https://doi.org/10.1111/jtxs.12339
Quan TH, Benjakul S (2019). Duck egg albumen: physicochemical and functional properties as affected by storage and processing. J. Food Sci. Technol. 56(3): 1104-1115. Https://doi.org/10.1007/s13197-019-03669-x
Raikos V, Campbell L, Euston SR (2007). Rheology and texture of hen’s egg protein heat-set gels as affected by pH and the addition of sugar and/or salt. Food Hydrocoll. 21(2): 237-244. Https://doi.org/10.1016/j.foodhyd.2006.03.015
Ramirez JA, Velazquez G, Echevarria GL, Torres JA (2007). Effect of adding insoluble solids from surimi wash water on the functional and mechanical properties of pacific whiting grade a surimi. Bioresour. Technol. 98: 2148-2153. Https://doi.org/10.1016/j.biortech.2006.08.024
Ren Y, Wu J, Renema R (2010). Nutritional and health attributes of eggs. In: Guerrero-Legarreta I. Handbook of Poultry Science and Technology. Wiley, Hoboken, pp. 533–578.
Scott TA, Silversides FG (2000). The effect of storage and strain of hen on egg quality. Poult. Sci. 79: 1725-1729. Https://doi.org/10.1093/ps/79.12.1725
Soria AC, Villamiel M (2010). Effect of ultrasound on the technological properties and bioactivity of food: a review. Trends Food Sci. Technol. 21: 323–331. Https://doi.org/10.1016/j.tifs.2010.04.003
Stefanović AB, Jovanović JR, Grbavčić SŽ, Šekuljica NŽ, Manojlović VB, Bugarski BM, Knežević-Jugović ZD (2014). Impact of ultrasound on egg white proteins as a pretreatment for functional hydrolysates production. Eur. Food Res. Technol. 239(6): 979-993. Https://doi.org/10.1007/s00217-014-2295-8
Sze WK, Huda N, Dewi M, Hashim H (2018). Physicochemical properties of egg white powder from eggs of different types of bird. Int. J. Adv. Sci. Eng. Inf. Tec. 8(2): 384-389.
Tabilo-Munizaga G, Barbosa-Cánovas GV (2004). Color and textural parameters of pressurized and heat-treated surimi gels as affected by potato starch and egg white. Food Res. Int. 37: 767-775. Https://doi.org/10.1016/j.foodres.2004.04.001
Tan MC, Chin NL, Yusof YA, Abdullah J (2016). Effect of high power ultrasonic treatment on whey protein foaming quality. Int. J. Food Sci. Technol. 51(3): 617-624. Https://doi.org/10.1111/ijfs.13013
Wang J, Liu X, Li S, Ye H, Luo W, Huang Q, Geng F (2022). Ovomucin may be the key protein involved in the early formation of egg-white thermal gel. Food Chem. 366: 130596. Https://doi.org/10.1016/j.foodchem.2021.130596
Yanjun S, Jianhang C, Shuwen Z, Hongjuan L, Jing L, Lu L, Uluko H, Yanling S, Wenming C, Wupeng G, Jiaping L (2014). Effect of power ultrasound pretreatment on the physical and functional properties of reconstituted milk protein concentrate. J. Food Eng. 124: 11-18. Https://doi.org/10.1016/j.jfoodeng.2013.09.013
Yilmaz MT, Karaman S, Dogan M, Yetim H, Kayacier A (2012). Characterization of O/W model system meat emulsions using shear creep and creep recovery tests based on mechanical simulation models and their correlation with texture profile analysis (TPA) parameters. J. Food Eng. 108(2): 327-336. Https://doi.org/10.1016/j.jfoodeng.2011.08.005
Yu J, Ahmedna M, Goktepe I (2007). Peanut protein concentrate: production and functional properties as affected by processing. Food Chem. 103: 121–129. Https://doi.org/10.1016/j.foodchem.2006.08.012
Yu ZL, Zeng WC, Zhang WH, Liao XP, Shi BM (2016). Effect of ultrasonic pretreatment on kinetics of gelatin hydrolysis by collagenase and its mechanism. Ultrason Sonochem, 29: 495-501. Https://doi.org/10.1016/j.ultsonch.2015.11.004
Yuceer M, Caner C (2014). Antimicrobial lysozyme–chitosan coatings affect functional properties and shelf life of chicken eggs during storage. J. Sci. Food Agric. 94: 153-162. Https://doi.org/10.1002/jsfa.6322
Zhang Q, Tu Z, Xiao H, Wang H, Huang X, Liu G, Liu C, Shi Y, Fan L, Lin D (2014). Influence of ultrasonic treatment on the structure and emulsifying properties of peanut protein isolate. Food Bioprod. Process. 92: 30-37. Https://doi.org/10.1016/j.fbp.2013.07.006
Zheng NY, Chen YC, Chen YP, Shiu JS, Wang SY (2021). Development of a heatable duck egg white translucent jelly: an evaluation of its physicochemical properties and thermal stability. Poult. Sci. 100(9): 101373. Https://doi.org/10.1016/j.psj.2021.101373
Zhou B, Zhang M, Fang Z, Liu Y (2014). A combination of freeze drying and microwave vacuum drying of duck egg white protein powders. Dry. Technol. 32(15): 1840-1847. Https://doi.org/10.1080/07373937.2014.952380
Zhou M, Liu J, Zhou Y, Huang X, Liu F, Pan S, Hu H (2016). Effect of high intensity ultrasound on physicochemical and functional properties of soybean glycinin at different ionic strengths. Innov. Food Sci. Emerg. Technol. 34: 205–213. Https://doi.org/10.1016/j.ifset.2016.02.007
To share on other social networks, click on any share button. What are these?