

Phylogeographic Patterns of Microtus fortis (Arvicolinae: Rodentia) in China Based on Mitochondrial DNA Sequences


Phylogeographic Patterns of Microtus fortis (Arvicolinae: Rodentia) in China Based on Mitochondrial DNA Sequences
Jun Gao1,2, Liang-Liang Yue3, Xianhuan Jiang1, Liju Ni4, Muhammad Aqeel Ashraf5, Yuxun Zhou,1 Kai Li1,* and Junhua Xiao1,*

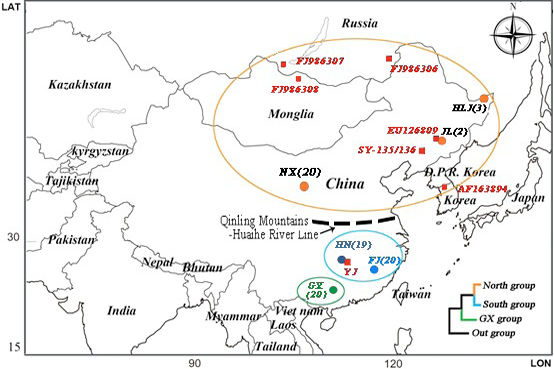
Sampling map of 84 Microtus fortis individuals, NX(20), HN(19), GX(20), FJ(20), HLJ(3) and JL(2),which showed the geographical origins (dots) as well as the red squares showed the ingroup cyt b sequences of M. fortis downloaded from the GenBank. Three monophyletic clades suggested by phylogenetic reconstruction in Figure 2.
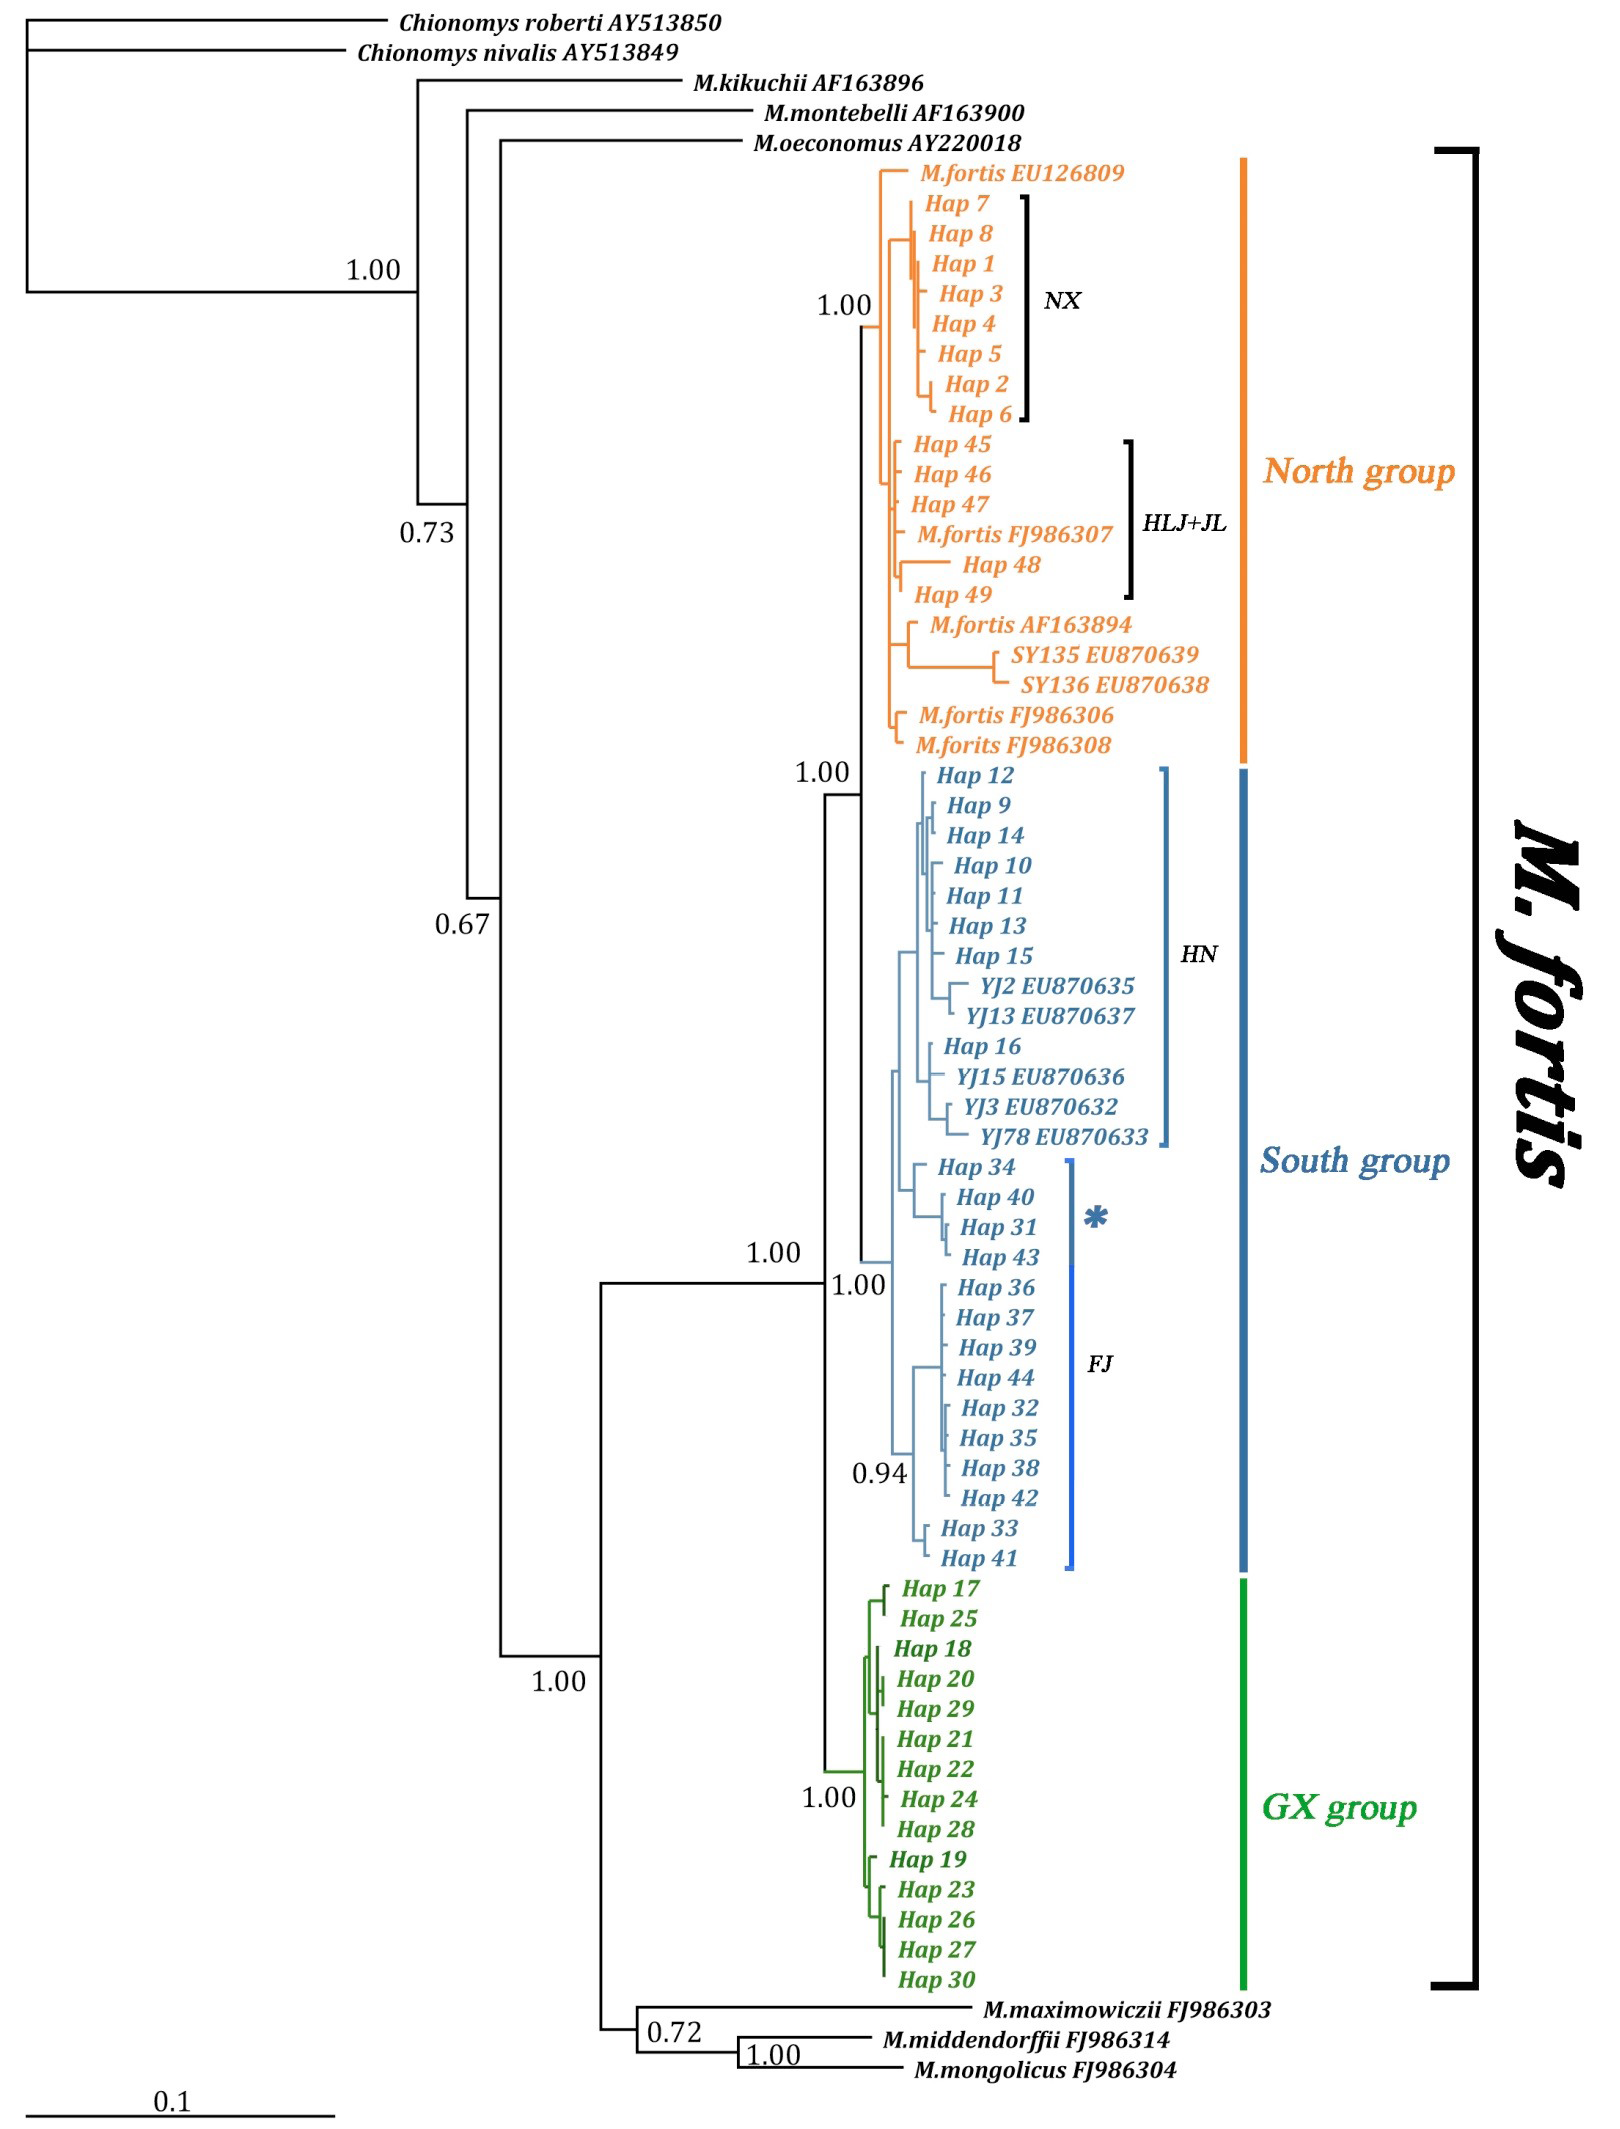
Bayesian tree illustrating high support of the three main haplotype clades (North group/South group/GX group) within M. fortis group. The node Bayesian posterior probabilities (BPP) are indicated. 4 haplotypes (Hap34, 40, 31, 43) of FJ population clustered with HN population (* marked).

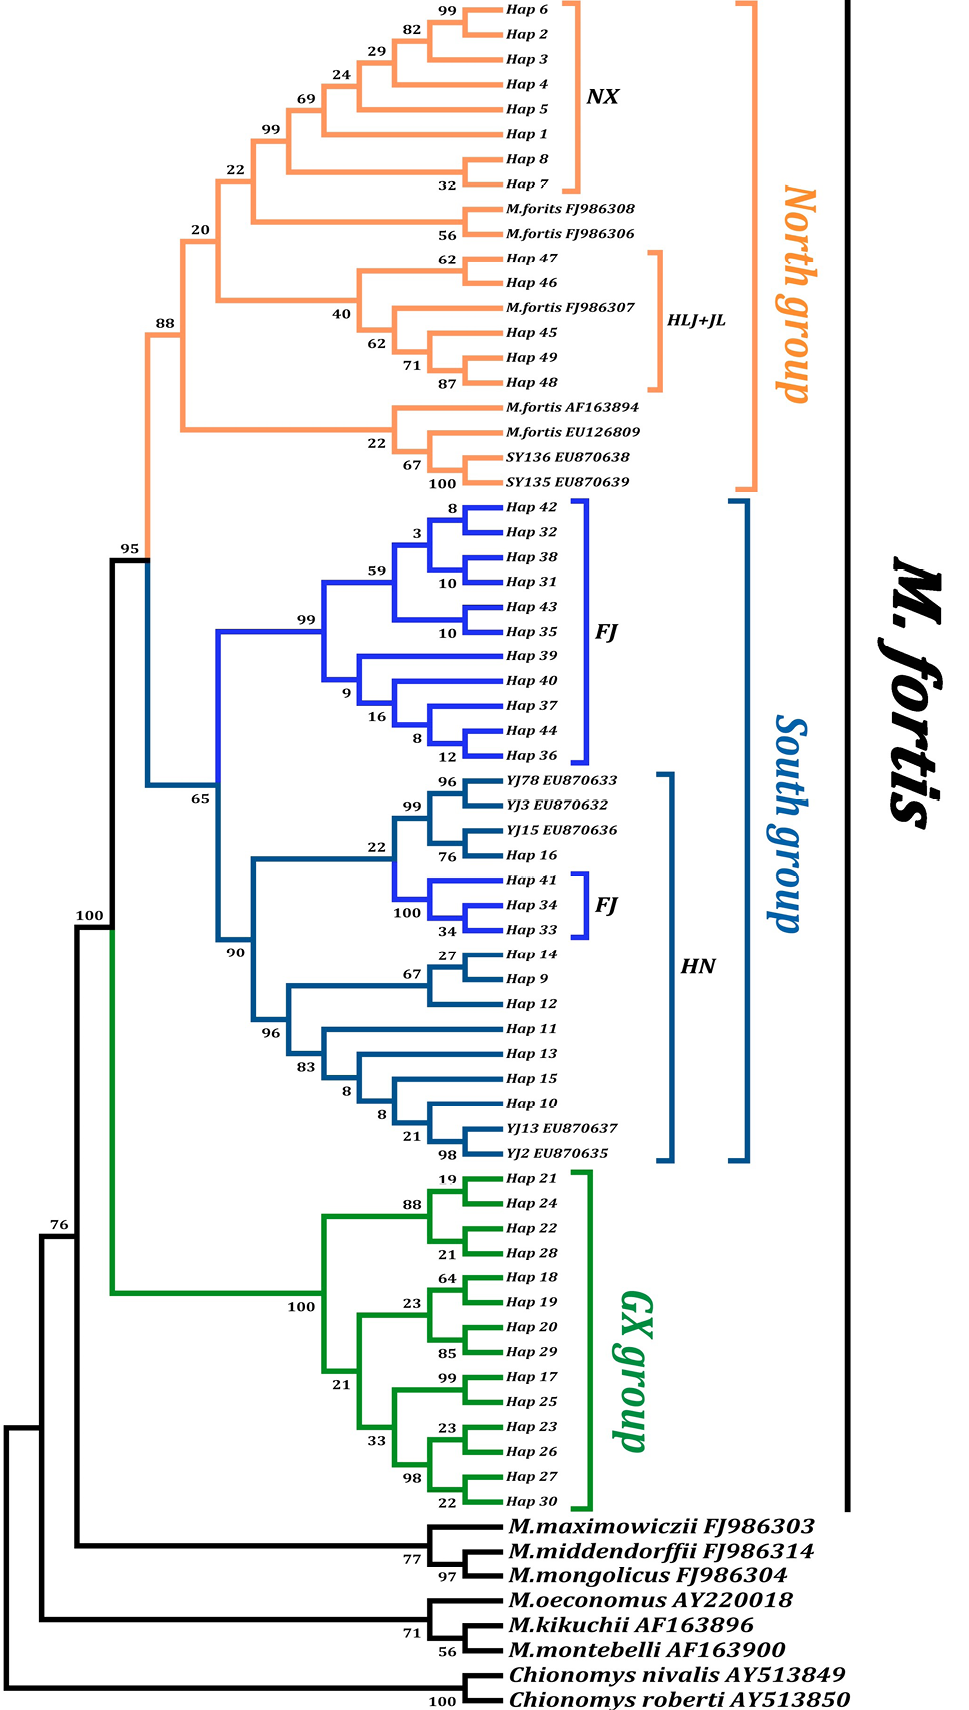
Maximum likelihood (ML) consensus tree reconstructed based on GTR+G+I model of 49 combine haplotypes (cytb +CR) representing 84 M. foris individuals. Bootstrap support values (BS) of nodes are indicated.
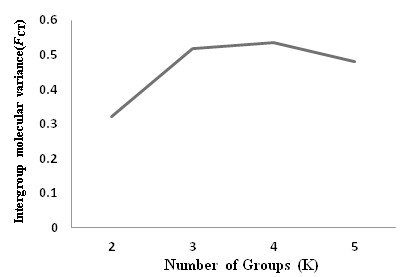
Best partition inferred from SAMOVA for a given number of groups (K). The FCT values get to the first peak platform when all the sampled populations were clustered into three groups. As the result, three groups design were used in the AMOVA analysis.

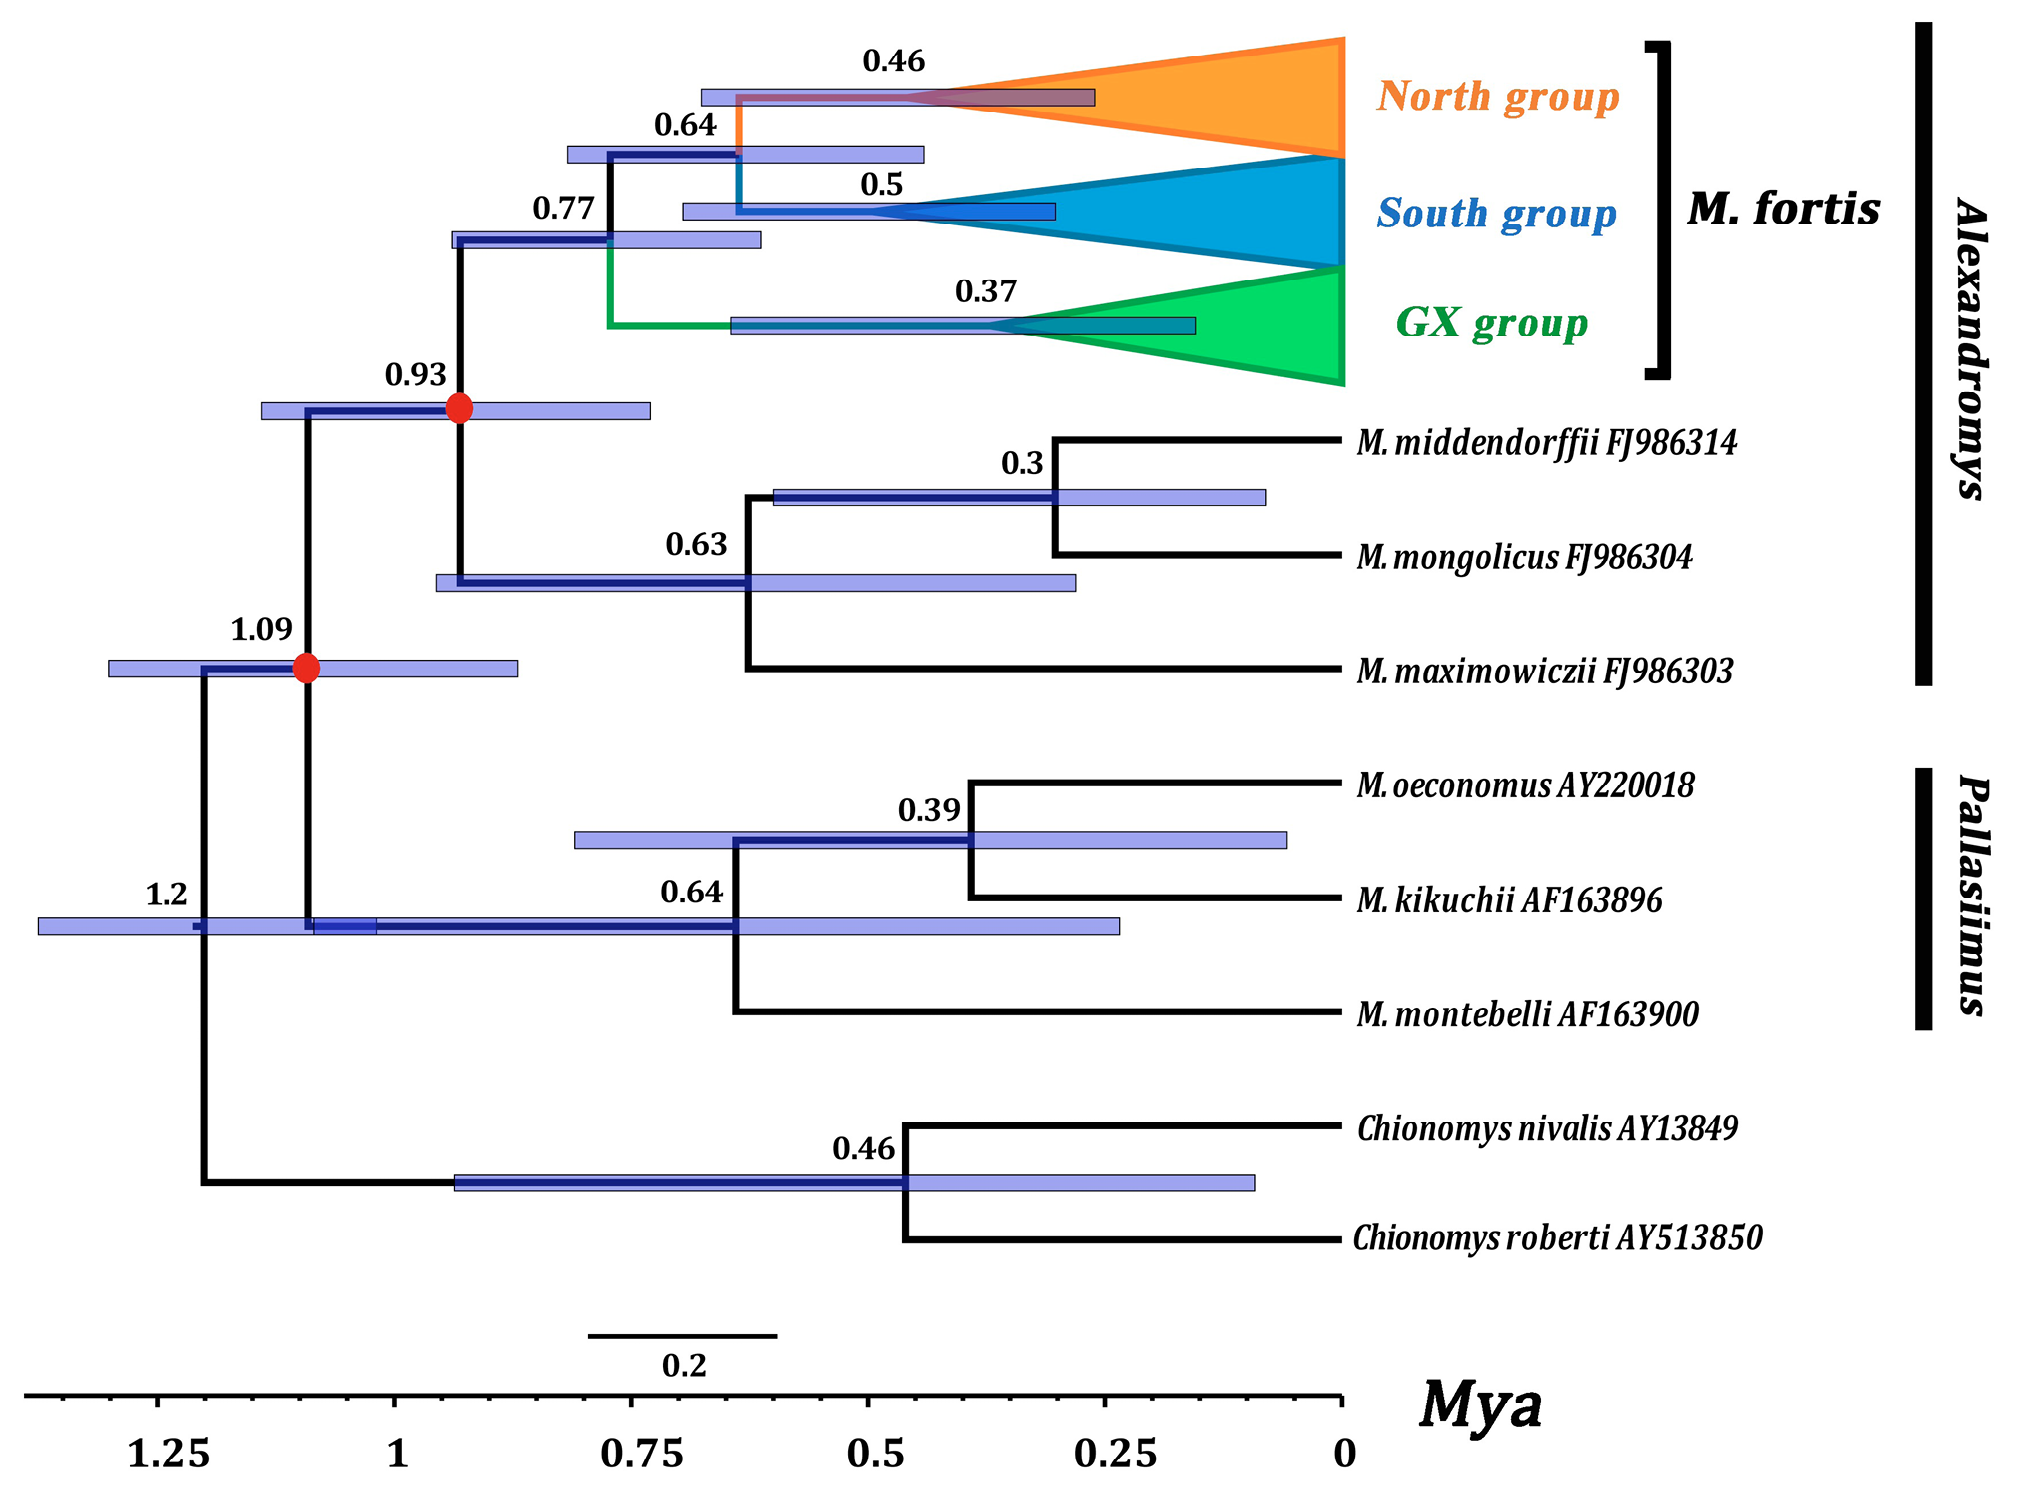
Chronogram of M. fortis based on 84 combined (cyt b+CR) sequences. Branch lengths represent time; Node bars indicate the 95% CI for clade ages; Two red dots indicated the nodes for calibration point in this study.

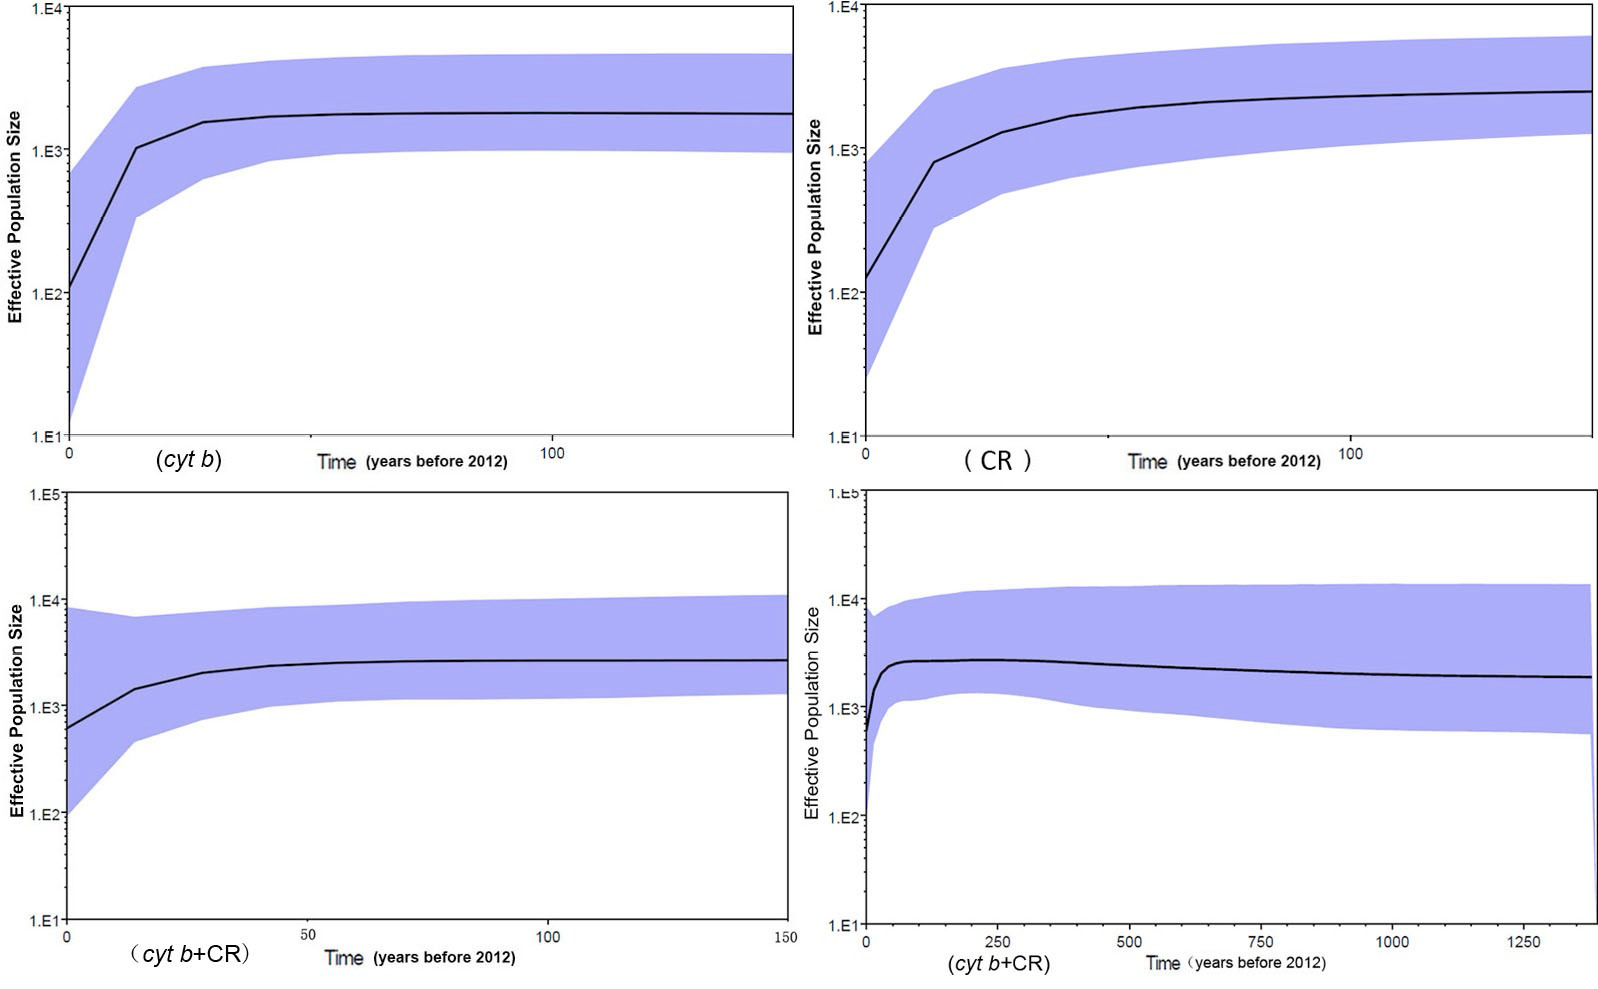
Bayesian skyline plot. The effective population size of Microtus fortis declined 30-40 years ago.


