
Determinants of Renewable Energy Technologies Adoption and Energy Source Choice of Households in Boset District, Ethiopia


Research Article
Determinants of Renewable Energy Technologies Adoption and Energy Source Choice of Households in Boset District, Ethiopia
Seble Mulugeta1 and Amenu Leta2*
1Department of Rural Development and Agricultural Extension, School of Agricultural Economics and Extension, College of Agriculture and Veterinary Science, Ambo University, Ambo, Ethiopia. P.O. Box 19; 2Department of Agricultural Economics, School of Agricultural Economics and Extension, College of Agriculture and Veterinary Science, Ambo University, Ambo, Ethiopia. P.O. Box 19.
Abstract | Renewable energy technologies are the best option for rural peoples until hydroelectric power is well disseminated in the country. Ethiopia has been faced with critical energy access and supply problems with poorly ventilated cooking places. The current study examined factors determining households’ decision to adopt renewable energy technologies and energy source choice in Boset District. A two-stage stratified random sampling was employed to draw 210 respondents. The descriptive statistics and multinomial logit and the binary logit model were used to analysis the data . The descriptive result revealed that a total of samples 37 (17.6%) were adopter of modern energy sources, 50(23.8%) were adopter of both traditional and renewable energy technology, and 123 (58.6%) were user of traditional energy source. The binary logit model revealed that age, family size, education, income, number of livestock owned, land size holding, and training were significant to adopt technologies. The multinomial model indicated that age, family size, land size holding, Income, livestock ownership, education, and training have significant to modern and mixed energy choicesin references to traditional energy. The study suggested that continues training and education are required to enhance households’ awareness concerning renewable energy sources.
Received | February 11, 2021; Accepted | October 20, 2021; Published | January 31, 2022
*Correspondence | Amenu Leta, Department of Agricultural Economics, School of Agricultural Economics and Extension, College of Agriculture and Veterinary Science, Ambo University, Ambo, Ethiopia. P.O. Box 19; Email: amenuleta@gmail.com
Citation | Mulugeta, S. and A. Leta. 2022. Determinants of renewable energy technologies adoption and energy source choice of households in Boset District, Ethiopia. Sarhad Journal of Agriculture, 38(2): 422-429.
DOI | https://dx.doi.org/10.17582/journal.sja/2022/38.2.422.429
Keywords | Renewable energy, Adoption, Choice energy, Multinomial logit model
Introduction
Energy deficiency at the household level is explained by lack of access to electricity and the reliance on the traditional use of biomass for cooking (IEA, UNDP, and UNIDO, 2010).It is estimated that 1.4 billion people around the world have no access to electricity with 85% of them are living in rural areas; and, 2.7 billion people i.e. 40% of the global population rely on traditional biomass energy for cooking (IEA, 2010), From the 620 -730 million people in sub-Saharan Africa countries do not have access to electricity and clean cooking facilities respectively (IEA,2014). It is projected that 1.2 billion people around the globe will have no access to electricity and traditional biomass use is anticipated to increase to 2.8 billion people in the year 2030 (IEA,2014).
Area with the unventilated cooking places households, women and children are vulnerable to critical health problems such as pneumonia, chronic lung diseases, and lung cancer (WHO and UNDP, 2009; Hanawi et. al., 2020; Faller et al., 2020). Like many other developing countries, Ethiopia has been faced with critical energy access and supply problems. It is estimated that only 23% of the country’s population have access to electricity, of which 86% is urbanities and only 5% is rural residents (GTZ, 2015). According to Dereje (2013), traditional biomass energy sourcessuch as firewood, dung cake, and agricultural residues are the major energy source that accounts for more than 90% of the country’s energy supply. This extensive utilization of forest has led to the depletion of tree stock of the country 15 % (ENA, 2015).
Energy deficiency exacerbates in the rural part of the country. From the total of rural residents in the country, more than 95% meets their daily energy need from unclean and traditional energy sources (GTZ, 2015). In the study area, biomass energy source especially firewood constitutes the greater portion of domestic energy supply for both rural and urban areas followed by dung and charcoal consumption (BDFEDO, 2019). Ethiopia has endowed with abundant clean energy sources; however, their development and utilization remained very low (Dawit, 2014). Different empirical studies have been conducted so far by (Dawit, 2008; Alemu and Köhlin, 2008; Yonas et al., 2013; Yonas et al., 2015; Gebreegziabher et al., 2012) on the determinants of households’ energy technology adoption and energy source choice in Ethiopia. The above-mentioned studies have either focused on identifying factors that influence the adoption of energy technologies or addressed the issue of household fuel choice focusing on urban areas.
With large area coverage and having the countries’ largest share of the population, access to the modern energy source is the major impediment in rural parts of Ethiopia. Currently, renewable energy technologies are the best option for rural peoples until hydroelectric power is well disseminated in the country. Besides examining the determinant factors of renewable energy source adoption, it is to investigate rural households’ energy source choice focusing on modern energy sources. Thus, this study was intended to fill the aforementioned gap by identifying factors affecting renewable energy technology adoption and rural households’ energy source choice focusing on the utilization of modern energy sources.
Materials and Methods
Study Area: The study was conducted in East Shewa Zone in Boset district. The district covers an area of151,406.6 km2 and divided into 32 rural and 4 town kebles. The total population accounts for 185,401 (111,572 male and 73,829 female) (BDFEDO, 2019). Boset has a one-season (‘Meher’) crop production cycle. Mixed agriculture is a common economic activity in the district. The district is known for its renewable energy source potential, especially solar energy. But, the energy source for the district is mainly from traditional biomasses; and, firewood constitutes a greater coverage of domestic energy supply both in rural and urban areas (BDFEDO, 2019). This study was conducted in 2019/20.
Study Design: Cross-sectional survey design was employed which incorporates both quantitative and qualitative survey methods. The data collected for this study included both primary and secondary data sources. The primary data of the study was collected directly from technology adopters and non-adopters. And, it was also obtained through key informant interviews and focus group discussions. The secondary sources were woreda’s finance and economic development and energy offices renewable energy technology dissemination report and other documents. Quantitative data was collected directly from respondents using a semi-structured questionnaire while qualitative information of the study was obtained through interviews and focus group discussions.
Sample size determination
The study used simplified formula provided by Fink and Kosecoff (1985), to determined required sample size.
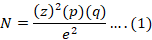
Where;
P: Estimated characteristics of the target population proportion (expected prevalence); Za/2: 95% confidence level corresponds to the value of 1.96; e: Proportion of sampling error tolerated at 0.05, q=1-p. Based on the information provided bythe district finance and economic development office, the expected prevalence of technologies’ dissemination in the district is 15% (BDFEDO, 2019). Thus, using P=0.15, the value of q becomes 0.85, taking thesenumbers in the above formula the sample size of the study become:
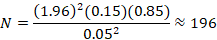
By considering 7% non-response rate, the total sample size was 196+14=210
Sampling technique
Two-stage sampling technique was employed to draw sample households. First, using information obtained from Boset District Energy Office, major, medium, and lower technologies’ adopter kebeles have listed and stratified accordingly. Then, from each stratum, two study kebeles were selected using a simple random sampling method which resulted in a total of six kebeles. Finally, using the calculated sample size, all randomly selected kebeles are included in the study with their total number of households. Study participants from each kebele included in the study using probability proportional to their size (PPS).Each technology user and non-user has been selected using a simple random sampling method.
Method of data analysis
The study employed both descriptive statistics and econometric model to analyze the collected data. To run statistical analysis, data were coded and entered in to a computer program with statistical package for social studies (SPSS) software packages. Descriptive statistics was used to present data in the form of table percentage and frequency. Both binary logit and multinomial model were employed to investigate the issue under a question.
Binary logit model was used to identify determinants of adoption of renewable energy technology. The Logit model follows the same approach as the probit model, the difference being that in this case the inherent error in the model is assumed to distribute according to the function of logistic density. Logistic regression analysis has also been used particularly to investigate the relationship between binary response probability and explanatory variables. For bankruptcy prediction the binary response probability is usually the default probability, while a high number of explanatory variables can be used. The method usually fits linear logistic regression models for binary response data by the method of maximum likelihood (Hosmer and Lemeshow, 1989).
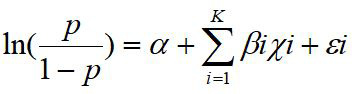
The logistic regression model is shown as the following form:
 ......(2)
Where;
p = the probability of adoption of renewable energy; α= value of log odd ratio (p)/(1-p), K= number of independent variable included into the model, (p/1-p) = odds of adoption of renewable energy; Xi = vector of independent variables; βi = parameter estimate for the independent variable. The logistic regression is powerful in its ability to estimate the individual effects of continuous or categorical independent variables on categorical dependent variables (Wright, 1995).
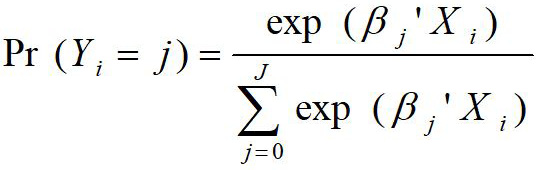
The multinomial logit regression (MNLR) model introduced by Luce (1959) and is often used when the dependent variable comprises more than two categories. Mostly, the MNLR is used to model nominal output variables in which the log odds of the outputs are modeled as a linear combination of explanatory variables. Nowadays, the MNLR is a very common choice among applied researchers for analyzing the categorical response variable having at least three categories. If only two discrete choices have to be analyzed the multinomial logit model (Pundo and Fraser 2006). The multinomial logit model that is used in our analysis of data can be expressed as follow:
 For j = 1, 2 ....(3)
Where;
Pr(Yi=j): Probability of choosing either modern energy or mixed energy; J: Number of choice of energy sources; j= 1: Modern energy; j = 2: Mixed energy sources; Xi: Vector of explanatory factors conditioning the choice of the jth alternatives; β: Vector of the estimated parameter.
Results and Discussion
The survey result shows that from a total sampled respondents about 193(91.9%) respondents were male-headed households and the remaining 17(8.09%) respondents were female-headed households. The mean age and family size of sample households were 41.98 and 5.52 respectively (Table 1).
As it can be depicted in Table 2, from the total of 210 sampled households, 123 respondents (58.6%) were found to be non-adopters; while, 87(41.4%) were adopters of renewable energy technology. This implies the majority of the households were found to be non-adopters of renewable energy resources.
Table 1: Descriptive statistics of sample respondents.
|
Explanatory variables |
Minimum |
Maximum |
Mean |
Std. Dev. |
|
Age of HH head (Year) |
18 |
67 |
41.98 |
10.39 |
|
family size of HH(Number) |
2 |
10 |
5.52 |
1.68 |
|
Category |
Total Number |
Percentage |
||
|
Sex |
Female |
17 |
8.09 |
|
|
Male |
193 |
91.9 |
||
Table 2: Renewable energy technology adoption of sampled households.
|
Adoption |
Number of households |
Percent (%) |
|
Non-adopter |
123 |
58.6 |
|
Adopter |
87 |
41.4 |
|
Total |
210 |
100.0 |
As can be seen from the Table 3, from atotal of 210 households, 37 (17.6%) of them utilize modern energy sources. While 50 (23.8%) was user of both traditional and renewable energy technology as their main energy source. The remaining 123 (58.6%) are traditional energy source users.
Table 3: Energy source choice of households.
|
Energy choice |
Frequency |
Percent (%) |
|
Modern energy |
37 |
17.6 |
|
Mixed energy |
50 |
23.8 |
|
Traditional energy |
123 |
58.6 |
|
Total |
210 |
100.0 |
Econometric model results
Binary logistic model results: The model revealed that in Table 4, from atotal of ten (10) explanatory variables included into the model, seven (7) of them were found to determine the renewable energy adoption decision of sample households.
Discussion to significant variable to determinants of adoption of renewable energy technologies:
Age of household head: The relationship between the age of the household head and the adoption of renewable energy technologies has become negative and significant. The marginal effect with the value of - 0.0154 implies that, keeping other factors constant, as the age of the household head increases by one year the probability of adopting renewable energy technology decreased by 0.0154(1.54%) . This might be due to older people are more reluctant to accept new technologies and prefer to keep on using something they are familiar with. This result is similar with the studies conducted by Tigabu (2014).
Table 4: Logistic regression result:Determinants of adoption of renewable energy technology.
|
_adoption- |
Coef. |
Std. Err. |
Z |
P >Z |
Marginal Effect |
|
_Isex_1 |
1.016705 |
.8179536 |
0.02 |
0.984 |
.0038569 |
|
Age |
-0.93594 |
.0229955 |
-2.69 |
0.007*** |
-.0154378 |
|
Family_ size |
-0.73747 |
.1000446 |
-2.24 |
0.025** |
-.0710208 |
|
Education |
1.39668 |
.1500088 |
3.11 |
0.002*** |
.0779177 |
|
Total_ land_ size |
2.103738 |
.7582701 |
2.06 |
0.039** |
.1734479 |
|
Livestock _TLU |
1.354025 |
.1454835 |
2.82 |
0.005*** |
.0706841 |
|
Ln_ income |
2.651386 |
1.130436 |
2.29 |
0.022** |
.2274067 |
|
Amount_ credit |
.9999627 |
.0000821 |
-0.45 |
0.649 |
-8.70e-06 |
|
Distance_market |
.981148 |
.0245233 |
-0.76 |
0.446 |
-.0044386 |
|
_Itraining_1 |
5.015261 |
2.434803 |
3.32 |
0.001*** |
.3474101 |
|
_cons |
.0002495 |
.0009812 |
-2.11 |
0.035 |
Source: Computed from own survey data (2019/20); ** And *** = significant at 5% and 1% level of significance, respectively.
Family size : The model result show that family size affects adoption of renewable energy technology in a negative and significant way. The marginal effect indicates that, assuming every thing constant, as family size increases by one unit the probability of adopting renewable energy technology decrease by 0.071(7.1%). This may be due to households with large family size were hinders adopt of new technologies. In another way, household with larger family size means more labor to collect free traditional fuels like firewood and dung, which might make households reluctant to adopt energy technologies. The finding of this study was in harmony with the finding of yonas et al. (2015).
Education level : Education level of household were significantly determine adoption decision of renewable energy technology of households. The marginal effect of 0.077 for education shows that keeping other factors constant, the probability of adopting renewable energy technologies increases by 7.7% for one grade increment in the educational level of the household head. The finding of this study is in concord with the previous works of Kabir et.al. (2013) and Iqbal et al. (2013).
Table 5: Multinomial Logistic Result: Determinants of energy choice of sample households.
|
Choice |
Modern Energy |
Mixed Energy |
||||||
|
Variables |
Coef. |
dy/dx |
Z |
P>z |
Coef |
dy/dx |
Z |
P>z |
|
Sex Male |
-1.220198 |
-.1589791 |
-1.19 |
0.234 |
.1624919 |
.0990379 |
0.13 |
0.898 |
|
Age |
-.0605755 |
-.002315 |
-1.90 |
0.058* |
-.064682 |
-.003376 |
-2.1 |
0.030** |
|
Family Size |
-.2945361 |
-.0054745 |
-1.60 |
0.110 |
-.403639 |
-.026485 |
-2.2 |
0.026** |
|
Education |
.4660993 |
.0179083 |
3.16 |
0.002** |
.4962204 |
.0258144 |
3.49 |
0.000** |
|
Total land size |
.5773503 |
-.0049131 |
1.32 |
0.187 |
1.032406 |
.0791591 |
2.40 |
0.016** |
|
Livestock in TLU |
.4133841 |
.0215668 |
3.28 |
0.001** |
.3524681 |
.0129972 |
2.82 |
0.005** |
|
Amount Credit |
-.0001896 |
-.0000242 |
-1.47 |
0.141 |
.0000593 |
.000019 |
0.58 |
0.560 |
|
Distance to Market |
-.0449613 |
.0004865 |
-1.30 |
0.193 |
-.082000 |
-.006345 |
-2.4 |
0.016** |
|
Training Yes |
1.194264 |
.0449281 |
2.00 |
0.046** |
1.37473 |
.0812816 |
2.28 |
0.023** |
|
Lnincome |
1.107211 |
.0247193 |
2.06 |
0.040** |
1.453524 |
.0923552 |
2.73 |
0.006** |
|
_cons |
-11.18369 |
-2.37 |
0.018 |
-14.107 |
-2.8 |
0.004 |
||
Source: Computed from own survey data (2019/20)
Total land size: Total land holding of household were positive and significantly affect renewable technologies’ adoption. The marginal effect value of total land size was 0.173 on the adoption of renewable energy technologies. That means, keeping other things constant, the probability of adopting renewable energy technologies increased by 17.3 percent as theland size holding of households increased by one hectare. The study result is in harmony with the findings of Alemu and Köhlin (2009) and Iqbal et al. (2013).
Livestock Holding (TLU): It is positive and significant relationship with the adoption decision of households. The marginal effect with a value of 0.07 indicates that, keeping other factors constant, as livestock increases by one unit the likelihood to adopt renewable energy technology increases by 7%. Livestock is one means through which households kept their wealth, especially in rural Ethiopia. So, with large livestock ownership households tend to adopt new technologies. This result is similar tothe findings of Iqbal et.al. (2013) and Kabir et al. (2013).
Total income: Total annual income of household affects adoption of renewable energy technology positively and siginificantly. Households with high annual income found to be more adopters of the technology than those households with lower annual income. The marginal effect of income on the adoption decision of households has a value of 0.227. This implies that, holding other factors constant, as the income level of a household increases by one birr the probability of adopting the technology increases by 22.7 percent. A similar finding was reported by Lay et al. (2012) and Ouedraogo (2006).
Training: Access of training on energy technology adoption was positively and significantly related to adoption of renewable energy technology . The marginal effect of this variable is 0.347 implying that the probability of renewable energy technology adoption for trained households increases by 34.7 percent as compared to untrained households. The result of this study is similar to the finding of Abadi (2006).
Multinomial logistic model results
This model estimates the effect of each covariate/variable on the energy choice of sampled households. (That is modern, mixed, and traditional). And, traditional energy is used as a reference group).
Interpretation of significant variables as follow
Age of household head: As depicted in the Table 5 Age of houselod head has negative and significant association with both modern and mixed energy choices. The marginal effect of the household head on energy choice of households have a value of - 0.0023 and - 0.0033 for modern and mixed energy choices respectively; which indicates that assuming other factors constant the choice of modern and mixed energy sources decreases by 0.23% and 0.33% for a one year increment in the age of the households head compared to traditional energy sources.The finding of this study is similar to the work of Waweru (2014).
Family size: For a mixed energy choice, family size has shown a negative and significant relationship. The marginal effect that is -0.026 shows that keeping other factors constant, the probability of choosing a mixed energy source decreases by 2.6% relatively, as a one-unit increment in family size. This may be due to free labor availability to collect free traditional energy source, or preparing food to all family members require huge energy which might not be satisfied either by modern or mixed energy sources that obliged households to pursue using traditional energy sources. This study finding is similar to the work of Waweru (2014).
Education: Has a positive and significant influence onboth modern and mixed energy choices. The marginal effect 0.0179 and 0.0258 of education for both energy categories indicates that keeping other factors constant, the probability of choosing modern and mixed energy sources increases by 17.9 and 25.8% respectively relative to a one-grade increment in education compared to traditional energy sources. The study in line with the finding of Ouedraogo (2006).
Land size: For mixed energy choice land size holding has shown a significant and positive relationship. The marginal effect of land size holding on the choice of mixed energy source indicates that assuming everything is constant, an increase in land size holding increases the probability of choosing mixed energy as their main energy source by 7.9% compared to traditional energy sources. The model result show that land size has been direct relationship with the choice of energy sources. The study result is in agreement with the findings of Alemu and Köhlin (2009).
Livestock Holding (TLU): For both modern and mixed energy source choices livestock ownership,hasshown a significant relationship. The marginal effect of households’ livestock holding on the choice of modern and mixed energy sources with a value of 0.0215 and 0.0129 respectively indicates that, keeping other factors constant as a livestock holding in TLU increases by one unit the choice of modern and mixed energy as main energy sources increases by 2.15% and 1.29% respectively compared to traditional energy sources. Since livestock possession is one-way keeping households’ wealth in rural Ethiopia, the study finding confirms the energy ladder hypothesis of income/wealth affects modern energy choice of households (Heltberg, 2003).
Distance to market:An increase in the market distance led to a decrease in the probability of choosing mixed energy over traditional energy sources. the marginal effect value of -0.006 indicates that assuming everything constant the choice of the mixed energy source as themain fuel decreased by 0.6% for a one kilometer increment in the distance of the market center.
Training: It is significantly determine both modern and mixed energy choices. The marginal effect of training for both energy categories was 0.044 and 0.081 respectively. This implies that keeping other factors constant, the probability of choosing modern energy over traditional energy increased by 4.4% for trained households compared to untrained households and, the likelihood of choosing mixed energy over traditional energy increases by 8.1% for households’ who are provided with training compared to untrained one. This means that households provided with training know more about the positive benefits of utilizing renewable energy technologies and modern energy sources which motivate them to choose cleaner energy sources to meet their daily energy needs.
Annual income: It is significantly determine both modern and mixed energy choices. The marginal effect of annual income on energy choice of households have a value of 0.0247 and 0.0923 for modern and mixed energy choices respectively; which indicates that assuming other factors constant the choice of modern and mixed energy sources increases by 2.47% and 9.23% for a one birr increment in income level of households compared to traditional energy sources. The study finding concord with Alemu and Kolhin (2008) and Ouedraogo (2006). Besides, the finding of this study proves the energy ladder hypothesis, which confirms that as the income level of a household increases their preference to clean energy sources would increases.
Conclusions and Recommendations
The finding of this study indicated that the major determining factors of renewable technology adoption and modern energy source choice of rural households are; age, family size, annual income, total land size holding, livestock ownership (TLU), education, and training of the household head. These factors affect the adoption decision and modern energy source choice of rural households one way or another. Besides, affordability and multi-purpose use of technologies’ were mentioned as a major challenge for technologies’ adoption during focus group discussion.Based on the finding of the study the following recommendations are forwarded. Stakeholders should strengthen and provide different educational opportunities like adult education and training for rural households to make them more informed about the benefits of utilizing cleaner energy sources. Concerned bodies should facilitate credit and subsidy schemes to make renewable energy technologies affordable for the rural poor. Efforts should be made by concerned bodies so that households engaged in different income generating activitieslike- irrigation schemes, to improve their income level and thereby enhance adoption and utilization of modern energy sources and reduce energy poverty at the household level. Due emphasis should be given by stakeholders for technological research to revise and adjust renewable energy technologies’ limitations.
Acknowledgments
The authors are much grateful to Boset Districtoffices of Agriculture and natural resources along with Development Agent workers of the surrounding areas for providing the necessary data and logistics.
Novelty Statement
Adoption of renewable energy is a new technology used in Boset district, Ethiopia. Thus, the findings smooth the way to use energy and available energy sources by identifying determinants of renewable energy technology adoption and energy sources.
Author’s Contribution
Both authors designed the research work, drew questionnaire, supervised data collection, analyzed the data and wrote up the research report.
Conflict of Interest
There is no conflict of interest among the authors of the manuscript.
References
Abadi, T. 2006. Analysis of Social Economic and Institutional Issues Affecting Utilization of Rainwater Harvesting Technology, Eastern Tigray, Ethiopia. MSc Thesis School of Graduate Studies of Alemaya University.
Alemu, M. and Köhlin, G. 2008. Biomass Fuel Consumption and Dung Use as Manure Evidence from Rural Households in the Amhara Region of Ethiopia. Addis Ababa. Environment for Development Discussion Paper Series, 08-17.
Alemu, M. and Köhlin, G. 2009. Determinants of Household Fuel Choice in Major Cities in Ethiopia. Working Papers in Economics No 399, University of Gothenburg, Sweden.
BDFEDO. 2019. Boset District Finance and Economic Development Office of Socio-Economic Profile of Boset District. Unpublished document.
Dawit, D. 2008. Estimating Household Energy Demand of Rural Ethiopia Using an Almost Ideal Demand System (Aids). Addis Ababa University, Addis Ababa.
Dawit, D. 2014. Assessment of Bio-Based Energy, Rural Livelihoods and Energy Security in Ethiopia. Department of Economic and Technological Change Centre for Development Research.
Dereje, D. 2013. Ethiopia’s Renewable Energy Power Potential and Development Opportunities. Ministry of Water and Energy. Abu Dhabi, UAE.
ENA. 2015. Renewable rnergy adoption Available at: http://www.ena.gov.et/en/index.php/environment/item/611 retrieved on November 30/2015.
Faller, E.M., Hernandez, M.T., Hernandez, A.M.and Gabriel, J.R.S. 2020. Emerging Roles of Pharmacist in Global Health: An Exploratory Study on their Knowledge, Perception and Competency. Arch. Pharm. Pract., 11(1): 40-6.
Fink, R. and J. Kosecoff. 1985. How to conduct surveys: A step by step guide? Sage Publications Inc., London, 53-63.
Gebreegziabher, Z. 2012. Urban Energy Transition and Technology Adoption: The Case of Tigrai, Northern Ethiopia. Energy Econ., 34: 410–418. https://doi.org/10.1016/j.eneco.2011.07.017
GTZ. 2015. Gesellschaft für Technische Zusammenarbeit Eastern Africa Energy Resource Base: Overview of the determinants of renewable Energy source and its Contribution to the Economy.
Hanawi, S.A., Saat, N.Z.M., Zulkafly, M., Hazlenah, H., Taibukahn, N.H., Yoganathan, D. and Low, F.J. 2020. Impact of a Healthy Lifestyle on the Psychological Well-being of University Students. Int. J. Pharm. Res. Allied Sci., 9(2): 1-7.
Heltberg, R. 2003. Household Fuel and Energy Use in Developing Countries - A Multicountry Study Draft for discussion and Gas Policy Division the World Bank.
Hosmer, D.W. and S. Lemeshow. 1989. Applied logistic regression. John Wiley & Sons, Inc., New York.
IEA, UNDP and UNIDO. 2010. Energy poverty, how to make modern energy access universal: Special early excerpt of the world energy outlook 2010 for the UN General Assembly on the Millennium Development Goal.
International Energy Agency’s (IEA). 2014. World Energy Outlook. Paris, OECD.
Iqbal, S. 2013. Factors Leading to Adoption of Biogas Technology: A Case Study of District Faisalabad, Punjab, Pakistan. https://doi.org/10.6007/IJARBSS/v3-i11/376
Kabir, H. 2013. Factors determinant of biogas adoption in Bangladesh.Department of Regional and Project Planning, Justus-Liebig University of Giessen, Germany.
Lay, J. 2012. Determinants of renewables in the energy transition: Evidence on solar home systems and lighting fuel choice in Kenya. (HWWI) | 2012 ISSN 1861-504X: Hamburg Institute of International Economics Germany. https://doi.org/10.2139/ssrn.2143123
Luce, R.D. 1959. Individual choice behaviour: A theoretical analysis. NewYork: Wiley. [Google Scholar].
Ouedraogo, B. 2006. Household Energy Preference for Cooking in Urban Ouagadougou, Burkina Faso. Energy Policy, 34(18): 3787-3795. https://doi.org/10.1016/j.enpol.2005.09.006
Pundo, M.O. and C.G.F. Fraser. 2006. Multinominal logit analysis of household cooking fuel choice in rural Kenya: The case of Kisumu district, Agrekon, Agricultural Economics Association of South Africa (AEASA), 45(1): 1-14.
Tigabu, A. 2014. Factors Affecting Adoption of Improved Cookstoves in Rural Areas: Evidence from ‘Mirt’ Injera Baking Stove (The Survey of Dembecha Woreda, Amhara Regional State, Ethiopia). MA Thesis Submitted to the Department of Management, Mekele University.
Waweru, D. 2014. Fuel in Kenya: An Analysis of Household Choices in Major Kenyan Cities. A Research Thesis Submitted to the School Of Economics in Partial Fulfilment of The Requirements For The Degree of Master of Economics (Econometrics) of Kenyatta University.
WHO and UNDP. 2009. The Energy Access Situation in Developing Countries, A Review Focusing on the Least Developed Countries and Sub-Saharan Africa, available at: http://www.undp.org/energy on access of renewable energy
Wright, R.E. 1995. Logistic regression. Pages 217-244 in L. G. Grimm, and P. R. Yarnold, Eds. Reading and understanding multivariate statistics. American Psychological Association, Washington, DC.
Yonas, A., Abebe, B., Köhlin, G. and Alemu, M. 2013. Household Fuel Choice in Urban Ethiopia; A Random Effects Multinomial Logit Analysis, Discussion Paper Series, Environment for Development (EfD) DP 13-12v.
Yonas, A., Abebe, B., Köhlin, G. and Alemu, M. 2015. Modeling Household Cooking Fuel Choice: a Panel Multinomial Logit Approach. Working Papers in Economics No 632 ISSN. University of Gutenberg school of Business, Economics and Law.
To share on other social networks, click on any share button. What are these?


