
Assessment of Rice Export Interdependency between China and Vietnam Based on Empirical Approaches


Research Article
Assessment of Rice Export Interdependency between China and Vietnam Based on Empirical Approaches
Trinh Thi Viet Ha1, Pham Duy Liem2 and Li Shuang1*
1College of Economics and Management, Department of International Trade, Northeast Agricultural University, Harbin, China; 2Engineering College, Northeast Agricultural University, Harbin, China.
Abstract | In world rice market, China and Vietnam play a vital role, as the largest producer,consumer and exporter. The current study was conducted to analyze the rice export interdependency between these two countries using empirical approaches. The findings of the study show that the pattern of rice trade between China and Vietnam is fluctuated. The trade volume between China and Vietnam is smaller, and the fluctuation of trade is larger, and there is a large space for the development of rice trade between the two countries. Through further comparison of the comparative advantages of Chinese and Vietnamese rice products showed that the comparative advantage of China’s rice exports is greater in Vietnamese rice markets. Revealed comparative advantage (RCA) index and Relative Trade Advantage Index (RTA) were used to understand the relative competitive advantages of China and Vietnam rice export. The results showed that Vietnamese rice comparative advantage grew steadily in the Chinese market. Overall Sino-Vietnam rice export competition is not strong, it is helpful to reduce trade friction between the two sides. Moreover, there is conducive to the development of bilateral trade cooperation of long-term stability, from another point of view, agricultural products can also strengthen the cooperation. Moreover, complementarity is increasing, through the calculation, Sino-Vietnam trade complementarity index showed an upward trend, which indicates Sino-Vietnam have a potential trade cooperation.
Received | July 03, 2017; Accepted | October 25, 2017; Published | November 09, 2017
*Correspondence | Li Shuang, College of Economics and Management, Department of International Trade, Northeast Agriculture University, Harbin, China; Email: lishuang@neau.edu.cn
Citation | Ha, T.T.V., P.D. Liem and Li Shuang. 2017. Assessment of Rice export interdependency between China and Vietnam based on empirical approaches. Sarhad Journal of Agriculture, 33(4): 639-646.
DOI | http://dx.doi.org/10.17582/journal.sja/2017/33.4.639.646
Keywords | Rice, RCA, RTA, TCI, TII, Sino-Vietnam
Introduction
Vietnam and China are agricultural countries, although in recent decades, both countries are committed to the development and achieved great results, but compared to the Western developed countries, the proportion of agricultural development for the national economy is still enormous. Rice is an important agricultural product and staple food for these two countries that fulfill the domestic food requirements as well as a large source to earn foreign exchange for the national economy. In world rice market, China and Vietnam play a vital role, as the largest producer, consumer and exporter. After 2000s, rice trade in China and Vietnam significantly changed due to policy reforms (Xie and Napasintuwong, 2014). Recently, the policy reforms in China like exemption of agricultural tax and in Vietnam land tax reduction, which influenced the rice exporters. According to latest report of International Trade Centre, China has slipped from top ten positions to 9th position while Vietnam has slipped from 2nd to 5th position in the world rice trade market (TRADE-MAP, 2017). According to the latest statistics, the total rice export value between China and Vietnam has risen sharply from 5.3 million US dollars in 2000 to 886.6 million US dollars in 2015 (TRADE-MAP, 2015). Recently, the trade relationship and trade barriers between these two countries significantly improved, which led to these two countries more emphasis on promoting exports. Therefore, considering above circumstances, it is a great importance of analyze the export tendency of rice by means of intensity, competiveness and complimentary between China and Vietnam.
Literature review
Traditionally, trade measures have been used to measure comparative advantages and competiveness of products, industries and nations (Balassa, 1965, Hinloopen and Marrewijk, 2006). In literature, three main measure have been adopted by the authors: Trade intensity index, relative comparative trade advantage, two-way and one-way price and quality competition.
Trade intensity index (TII) can be used to measure how strong bilateral trade between two countries. (Kien, 2012) used TII for the period of 1991 to 2007 and concluded that trade between Vietnam and Korea rapidly increase compared to the rest of world. (Seung and Kim, 2012) conduct a study on South Korea’s trade intensity with China and found that trade intensity increased from 7.32 (2003) to 9.64 (2008).
In 1817, David Richard proposed a proposition of comparative advantages which later in 1990 by M.E Porter et al. (2009) modified to theory of international competitiveness. (Jiang, 2003; Lan, 2003) used Revealed Comparative Advantage Index (RCA) to measure the international competiveness of agricultural product in different periods. (Xiaodan, 2003; Sun Lin and Huie, 2004) analyze the influencing factors of import in the ASEAN and Japanese markets using the methods of completeness for agricultural products. Some authors used different methodologies like Domestic Resource Cost (DRC) and Constant Market Share (CMS) approach to analyze the export competitiveness in different parts of the world (Simonis, 2000; Kotan and Sayan, 2001; Weiss, 2002; Banerjee, 2005).
Empirically and theoretically, relative comparative trade advantages are more clearly define aspects of trade than measure of competitiveness (Porter, 1990; Lynn et al., 1997). The only difference between these two measures (relative comparative trade advantage and competitiveness) is market distortion. (Barkema et al., 1990) study agricultural market by considering the role of distortion and documented that competiveness display a realistic view of trade. (Lafay, 1992) documented that comparative advantage is structural in nature where as competitiveness is a cross-country comparison and changes in macroeconomic variables for a particular product. Therefore, the analysis that focus on trade competitiveness measures and relative comparative trade advantage may exhibited different results due to dissimilarities in findings (Fertö and Hubbard, 2003).
(Shuquan and Yin, 2005; Lingli, 2006) studies agricultural products trade and found that competiveness and complementary of agricultural product is high between China and ASEAN countries. (Zhongying, 2006) study the international competiveness of Chinese rice and documented that Chinese rice does not have competitive advantage compared to Thailand, Pakistan. Moreover, many authors used export data to determine the export competitiveness, complimentary and comparative advantage in different parts of the world (Nachum et al., 2001; Serin and Civan, 2008; Ferto and Hubbard, 2003). For example Akhtar et al. (2013) and Rifin (2010) determined the palm oil and horticulture products competitiveness.
From above literature, we can conclude that authors widely focused on comparative trade advantage and competitiveness. In addition, a very little literature of rice export was found between China and Vietnam. Therefore, in this paper we focus on complementarity, competitiveness and intensity for export of a particular product (rice), to measure the interdependency of export between two neighboring countries (Sino-Vietnam).
Materials and Method
In this study, data of rice import and export was obtained from website www.Trademap.org for the period of 2000 to 2015. Moreover, several publications and international trade magazines were also consulted for accuracy and validation of the data.
Four well-known indices such as the TII, RCA, Relative Trade Advantage Index (RTA), and the Trade Complementarity Index (TCI) were used for analyzing the export directions. The detail of indices as follow:
Source: Authors’ calculation based on database of (Comtrade 2016).
Trade intensity index (TII)
TII is used to measure the how strong rice trade between Sino-Vietnam. TII can be computed as follows:
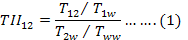
T12: Country 1 total rice exports or total rice imports to or from country 2; T1w: Country 1 total rice exports or total rice imports to or from the world; T2w: Country 2 total rice imports or total rice exports from or to the world; Tww: World’s total rice exports or rice imports.
Revealed comparative advantage index (RCA)
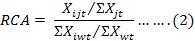
The standard Balassa s’ RCA index is in following form:
Where
Xijt: Exports of commodity “i” from country “j” at given time “t”; Xjt: Total exports of country “j” at given time “t”; Xiwt: World’s exports of commodity “i” at given time “t”; Xwt: Total world exports at given time “t”.
Relative trade advantage index (RTA)
The relative trade advantage (RTA) can be computed by taking the difference between relative import advantage (RMA) and relative export advantage (RXA). The RXA index is defined by (Balassa, 1965) as follows:
RXA = (Xij / Xit) / (Xnj / Xnt)……… (3)
Where
X: Exports from country i of a commodity j; t: Total commodities; n: Number of countries.
RMA = (Mij / Mit) / (Mnj / Mnt)………(4)
Where
M: Imports.
Now RTA can be computed from eq. (3) and eq. (4) .
RTA = RXA – RMA………… (5)
Trade complementarity index (TCI)
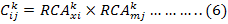
The Trade Complementary Index (TCI) by (Drysdale 1967)can be described as:
Where
Cikj: Complementarity index between two countries i and j for commodity k; RCAxki: Export comparative advantage of country i in commodity k; RCAmkj: Import comparative disadvantage of country j in commodity k; RCAxki and RCAmkj: Can be calculated as follow;


Where
Xki and Xkw: (k is commodity for country i) while w represents world’s total; Xi: Total export value of country; Xw: Total export valuethe world; Mki: Import of k commodity for country i, while Mi total import value of country in equation (8).
Results and Discussions
Trade intensity of Sino-Vietnam rice export
Trade intensity is used to measure trade flow between two countries. If the trade intensity value greater than 1 then the trade flow between these countries have larger trade flow compared to rest of the world. Furthermore, if the trade intensity value less than 1 then trade flow between these countries less, compared to rest of world. To analyze the trade intensity of rice export between Sino-Vietnam, the rice export data for the period of 2001 to 2015 was obtained from (www.Trademap.org: based on UN COMTRADE statistics), the results of trade intensity between Sino-Vietnam are presented in Table 1. The results showed that export of Vietnam rice in Chinese market gradually increase in recent decay. For example, 2001, 2003 and 2008 the trade intensity was less than unity which indicate that trade flow between SINO-Vietnam was less. Whereas after 2008, the trade interdependency between Sino-Vietnam gradually increased. On the other hand Chinese rice trade flow was greater before 2011, but in 2012 it suddenly decrease from 45.2 (2011) to 8.0 (2012). This might be due to increase of consumption of rice in the country. The results also exhibited that during 2001 to 2011 the trade intensity of Chinse rice export was much higher that is an indication of higher growth rate towards Vietnam during this period compared to rest of world.
RCA index of rice trade between Sino-Vietnam
The measurement of revealed comparative advantage (RCA) of Vietnam and China rice was calculated to find the comparative advantage. RCA Index (Sino-Vietnam value of exports from 2001 to 2015) are presented in Table 2. The results are as follows:
Table 2: Overlap of RCA Index between China and Vietnam.
| Years | Vietnam | China |
| 2001 | 1.25 | 0.01 |
| 2002 | 1.87 | 0.04 |
| 2003 | 1.81 | 0.01 |
| 2004 | 1.10 | 0.14 |
| 2005 | 0.79 | 0.12 |
| 2006 | 0.69 | 0.08 |
| 2007 | 0.95 | 0.14 |
| 2008 | 0.54 | 0.01 |
| 2009 | 0.66 | 0.08 |
| 2010 | 0.77 | 0.41 |
| 2011 | 1.11 | 0.77 |
| 2012 | 1.05 | 1.48 |
| 2013 | 1.26 | 1.59 |
| 2014 | 1.28 | 1.34 |
| 2015 | 1.08 | 1.09 |
Source: Authors’ calculation based on database of ade 2016).
China’s comparative advantage index is relatively low as shown in Table 2. Such as 2001 to 2011, the comparative advantage index showing the fluctuation of 0.07 to .11 This is because of China’s newly reform were focusing on the development of industrialization, modernization, resulting in reduced arable land, so in order to ensure food security, China has reduced the volume of domestic rice exports.Vietnam’s RCA index showed a continuous increase over the period of 2001-2011, where it is indicating the ability to gain a comparative advantage. But after 2011, Vietnamese rice lose its ability and Chinese rice showing the ability to gain a comparative advantage over Vietnamese rice.
Through the above analysis we can conclude that China and Vietnam have a certain advantage in the bilateral trade, and there is a certain competitive relationship. First, Sino-Vietnam having an adjacent geography, climate as well as natural resources. The same products produced by both countries have their own advantages. Second consumer demand similarity and differences. The consumer demand for differentiated products is greater in the country. The consumer demand for differentiated products is greater in the country. In recent years, with the continuous growth of per capita GDP in China and Vietnam, it is necessary to promote the development of Sino Vietnamese demand for products. The location of the two countries is similar, the cultural background is similar, and the level of consumption is close, the staple food of Sino-Vietnamis rice, which is also the reason why the same product has comparative advantage in both markets.
Table 3: RTA Index between Sino-Vietnam.
| Years | Vietnam | China |
| 2001 | 0.0 | 0.8 |
| 2002 | 0.0 | 0.8 |
| 2003 | 0.0 | 0.5 |
| 2004 | 0.2 | 1.1 |
| 2005 | 0.1 | 1.0 |
| 2006 | 0.1 | 0.5 |
| 2007 | 0.1 | 0.6 |
| 2008 | 0.0 | 0.5 |
| 2009 | 0.0 | 0.8 |
| 2010 | 0.1 | 1.1 |
| 2011 | 0.4 | 1.6 |
| 2012 | 2.0 | 2.2 |
| 2013 | 2.6 | 1.5 |
| 2014 | 2.5 | 1.5 |
| 2015 | 2.6 |
1.6 |
Source: Authors’ calculation based on database of (Comtrade 2016).
RTA index of rice trade between Sino-Vietnam
To establish consistencies between the measures of relative comparative trade advantages and categories of price/value competition in two-way matched trade. RTA Index of Sino-Vietnam value of exports from 2001 to 2015 are presented in Table 3. For this purpose, we first present the value of the RTA > 0, RTA < 0 and RTA =0 by trade competition between China and Vietnam. The zero value of RTA’s indicate the not a comparative advantage and disadvantage. For Vietnam, for the year of 2001 to 2003 and 2008 to 2009 RTA value is equal to zero, which indicate in these years Vietnam have no comparative advantage and disadvantage in export of rice with China. For China, RTA values from 2010 to 2015 are greater than one which indicate that China have a comparative advantage with Vietnam in export and import of rice trade. RTA have an advantage over RCA because of RTA considering import and export data, while RCA only considering export data. The results of RTA are more reliable than RCA.
Trade comparative analysis was carried out between China and Vietnam’s rice exports and imports from 2001 to 2015 (Figure 1). The export of rice from 2001-2005, the comparative advantage index (RCA) was lower than Vietnam, which indicate that Vietnam had comparative advantage over China, but after 2011, Vietnam lose comparative advantage China and China gain stable position during the period of 2011 to 2015. Relative Trade Advantage Index (RTA) index between China and Vietnam was greater than zero (Figure 2), which showed that both countries encourage the export of rice. China is a big country, but a large population, so, generally speaking, it is the lack of national resources, in terms of natural resources and Chinese complement. China have many scarce natural resources, but the natural resources of Vietnam are relatively abundant, At present, both China and Vietnam belong to the rising stage of industrialization, while the developed countries have been the era of industrial information, the international industrial transfer in the China and Vietnam to become the world’s countries with more foreign investment.
Developed countries transfer a large number of industrial units to developing countries make and strengthen the industrial structure of China and Vietnam, so that the same level of development of the same industry in the two countries, resulting in the development of trade between China and Vietnam. In addition, in recent years, both China and Vietnam have increased mutual investment between China and Vietnam were set up in other overseas companies, and expanding the scale of the development of the internal trade of multinational corporations also promotes bilateral intra industry trade.
TCI index of rice trade between Sino-Vietnam
By adopting the TCI methodology, based on the FAO statistical data, we have analyzed and estimated the trade complementarity index of the two countries’ a single commodity rice during the period of 2001–2015 from two aspects: China exports to the Vietnam market and the Vietnam exports to the China market respectively. From these results, we have found that: The rice of China and the Vietnam have strong trade complementarity. From the point of view of the Vietnam exporting to the China, the following product have high complementarity indexes (TCI > 1): TCI indexes after 2011 being 4.08, 12.17, 47.57, 62.29, 42.29, and 21.62 respectively. Observing from China exporting to Vietnam, rice have high complementarity indexes (TCI > 1), with their TCI after 2011 being 2.8, 30.4, 12.4, 12.3, and 16.7, respectively.
The trade complementarity index (TCI) between China and Vietnam is presented in Figure 3. From 2001 to 2009, the results displayed that Chinese Vietnam export import trade complementarity index is greater than zero, which indicating that the Vietnamese rice export into China market and Chinese rice export into Vietnamese market have comparative advantage. But the complementary index for China is very small, are below 1, which indicating that Vietnam to China exports and imports complementarity is very small, Vietnam does not have the comparative advantage in rice exports. From 2010 to 2015, the complementary index was more than 1, and the rice trade complementarity between China and Vietnam is strengthened. On the whole, the complementary nature of the trade between Vietnam and China is gradually strengthened. Moreover, after 2010 the changing trends of the TCI index is medium. The Vietnam rice products have low complementarity with China, as well as China rice product have a high complementarity with the Vietnam. This explains in a different perspective that both countries have different fundamental characteristics of resource endowments and rice trade of each country has its own comparative advantages. In addition, in recent years, both China and Vietnam have increased mutual investment that could help to expand the scale of the development of the internal trade between two countries.
Conclusions
This study was conducted to analyze the interdependency of rice export between Sino-Vietnam. For this purpose well-known indices from the literature were used to examine the comparative advantage or complimentary of rice export. The results exhibited that the pattern of rice trade between China and Vietnam is fluctuated. Import of rice by China is greater than Vietnam due to large size of country and large domestic use of rice. Vietnam is fifth largest rice exporter in the world’s rice export market. In recent years, Vietnam has exported about 4000000 tons to the world market, while China slipped its position to 9th in World’s market. The trade volume between China and Vietnam is smaller, and the fluctuation of trade is larger, and there is a large space for the development of rice trade between the two countries. Through further comparison of the comparative advantages of Chinese and Vietnamese rice products showed that the comparative advantage of China’s rice exports is greater in Vietnamese rice markets. Revealed comparative advantage (RCA) index and Relative Trade Advantage Index (RTA) were used to understand the relative competitive advantages of China and Vietnam rice export. This showed that Vietnamese rice comparative advantage grew steadily in the Chinese market. Overall Sino-Vietnam rice export competition is not strong, it is helpful to reduce trade friction between the two sides, there is conducive to the development of bilateral trade cooperation of long-term stability, from another point of view, agricultural products can also strengthen the cooperation. Moreover, complementarity is increasing, because through the calculation, Sino-Vietnam trade complementarity index showed an upward trend, which indicates Sino-Vietnam have a potential trade cooperation.
Author’s Contribution
Trinh Thi Viet Ha: provided basic concept and developed the research design under th supervision of Professor Li Shuang. She interpreted the data and wrote the manuscript.
Pham Duy Liem: Reviewed the literature and anlyzed the data.
Li Shuang: Overviewed the manuscript, made technical corrections, did final editing, read and approved the final manuscript.
References
Balassa, B. 1965. Trade liberalisation and revealed comparative advantage. The Manchester School. 33(2): 99-123. https://doi.org/10.1111/j.1467-9957.1965.tb00050.x
Barkema, A., M. Drabenstott and L. Tweeten. 1990. The competitiveness of US agriculture in the 1990s. Agricultural policies in a new decade: 253-384.
Fertö, I. and L.J. Hubbard. 2003. Revealed comparative advantage and competitiveness in Hungarian agri–food sectors. World Econ. 26(2): 247-259. https://doi.org/10.1111/1467-9701.00520
Hinloopen, J. and C. van Marrewijk. 2006. Comparative advantage, the rank-size rule, and Zipf’s law.
Jiang, M. 2003. Analysis of international competitiveness of agri-products and institutional innovation. Rural Econ. Manage. (Chinese). 5: 12-14.
Kien, T.N. 2012. Changing pattern of Korea-Vietnam trade relations. Sogang Iias research series on international affairs. 12: 127-151.
Kotan, Z. and S. Sayan. 2001. A comparison of the price competitiveness of Turkish and South East Asian exports in the European Union market in the 1990s, Research and Monetary Policy Department, Central Bank of the Republic of Turkey.
Lafay, G. 1992. The measurement of revealed comparative advantages. International trade modelling, Springer. 209-234. https://doi.org/10.1007/978-1-4757-2150-8_10
Lingli, L. 2006. The analysis of the similarity of agricultural products trade between China and Asean. World Econ. Stud. 43-49.
Lynn, K.P., W. Harrison, N.G. Kalaitzandonakes, C. Peterson and R.P. Rindfuss. 1997. Perspectives on evaluating competitiveness in agribusiness industries. Agric. Bus. 13(4): 385 (1986-1998).
Nachum, L., Jones, G.G. and Dunning, J.H. 2001. The international competitiveness of the UK and its multinational enterprises. Structural Change and Economic Dynamics, 12(3): 277–294. https://doi.org/10.1016/S0954-349X(01)00016-9
Porter, M.E. 1990. The competitive advantage of nations Macmillan. London, UK. https://doi.org/10.1007/978-1-349-11336-1
Rifin, A. 2010. Export competitiveness of Indonesia’s palm oil product. Trends Agric. Econ.
Seung and J. Kim. 2012. Koreas trade intensity with China and its changes over time. Asian Stud. (3): 1-26.
Shuquan Huang and X. Yin. 2005. The study of the trend of Chinese agricultural products exports structure with Asean. Asia Pac. Econ. 6: 41-45.
Simonis, D. 2000. Belgium’s export performance: A constant market shares analysis, Federal Planning Bureau.
Sun Lin and Z. Huie. 2004. Empirical analysis of China and ASEAN’s agricultural trade fluctuation. Chinese Rural Econ. (Chinese). 7: 46-52.
Serin, V. and A. Civan. 2008. Revealed comparative advantage and competitiveness: A case study for Turkey towards the EU. J. Econ. Soc. Res. 10(2): 25–41.
TRADE-MAP. 2015. Trade statistics for international business development. Geneva, Switzerland: International Trade Centre (United Nations Conference on Trade and Development-World Trade Organization). Accessed at several dates from: http://www. trademap. org.
TRADE-MAP. 2017. Trade statistics for international business development. Geneva, Switzerland: International Trade Centre (United Nations Conference on Trade and Development-World Trade Organization)). Accessed at several dates from: http://www. trademap. org.
Xiaodan, S. 2003. Explanations of competitiveness of major Chinese competitors in Japanese agri-product market. J. Yunnan Coll. Finance Trade. ( Chinese). 3: 17-21.
Xie, S. and O. Napasintuwong. 2014. Review of rice policies in China, Thailand and Vietnam.
Zhongying, H. 2006. The Research on the international competitive power of Chinese Rice. The Comparative Research with India, Pakistan, Thailand and Vietnam [J]. Chinese Agric. Sci. Bull. 8: 153.


