
An Evaluation Study for Chlorophyll Estimation Techniques


Research Article
An Evaluation Study for Chlorophyll Estimation Techniques
Kawa A. Ali1*, Sazar S. Noraldeen2 and Arshad A. Yaseen2, 3
1Field Crop Department, College of Agricultural Engineering Sciences, Salahaddin University, Erbil, Iraq; 2Department of Horticulture, College of Agricultural Engineering Sciences, Salahaddin University, Erbil, Iraq; 3University of Debrecen, Faculty of Agricultural and Food Sciences and Environmental Management, Institute of Horticultural Science, H-4032 Debrecen, Boszormenyi Street 138, Hungary.
Abstract | A field experiment was conducted to evaluate the efficacy of two destructive and two nondestructive chlorophyll estimation techniques for two vegetable crops (aroma tomato Solanum lycopersicum L. and green pepper Capsicum annuum L.) in three different environments (open field, lath house and plastic house) to indicate the best method of chlorophyll estimation. After 80 days from sowing chlorophyll estimation was implemented first by nondestructive methods using SPAD (SPAD-502 Plus Konica Minolta Tokyo, Japan) and atLEAF chlorophyll meter (at-LEAF FT-GREEN-LLC Willington, DE, USA) instruments, then the same leaves were cut and chlorophyll estimation were done by destructive methods using two organic solvents ( 80% acetone and 100% ethanol). Results demonstrate significant differences between SPAD and atLEAF data for tomato and pepper plants where higher levels with atLEAF instrument comparing to SPAD chlorophyll meter. Higher chlorophyll levels were recorded in open field plants comparing to lath and plastic houses plants. Chlorophyll a content was related to carotenoid levels in both destruction methods. There was positive correlation between SPAD and atLEAF. Nondestructive methods could be used as an alternative method for destructive methods.
Received | July 12, 2020; Accepted | May 12, 2021; Published | October, 13, 2021
*Correspondence | Kawa A. Ali, Field Crop Department, College of Agricultural Engineering Sciences, Salahaddin University, Erbil, Iraq; Email: [email protected]
Citation | Ali, K.A., S.S. Noraldeen and A.A. Yaseen. 2021. An evaluation study for chlorophyll estimation techniques. Sarhad Journal of Agriculture, 37(4): 1458-1465.
DOI | https://dx.doi.org/10.17582/journal.sja/2021/37.4.1458.1465
Keywords | Chlorophyll, Carotenoids, Photooxidation, SPAD, atLeaf
Introduction
Photosynthesis is the sole carbohydrates producing process in plant cells. The main plant photosynthetic pigments are chlorophyll that control solar radiation absorption and converting it to chemical energy, in different words converting solar to chemical energy (Taiz et al., 2015). Leaves, chlorophyll content is considered as the best indicator for plant injury due to biotic or abiotic environmental factors such as pollution, plant diseases, competition, allelopathy etc. (Knudson et al., 1977). Chlorophyll is a pigment molecule with a central metal particle (Magnesium) that bound to porphyrin molecule which, is composed of carbon, hydrogen, oxygen, and nitrogen (Lack and Evans, 2005). Both Chlorophyll a (Chl a) and Chlorophyll b (Chl b) are the major chlorophyll types found in plants with the characteristics of absorbing blue and red light, with a clear blue hint as its absorbance red-shifted in chlorophyll b comparing to chlorophyll a (Davies, 2009). The ratio of chlorophyll a to b is varied between shade and sunny leaves in the same plant due to the fact that photosystem I and II (PSI and PSII) contain chlorophyll a, while the light harvesting complexes (LHCs) contain reasonable amounts of chlorophyll b, so this is the reason of higher amounts of (Chl-a/ Chl-b) ratio in sunny leaves compared to shade leaves (Lambers et al., 2008; Porra, 2002). The chlorophyll a is the main plant pigment and other plant pigments such as chlorophyll b, carotenoids and xanthophyll’s are accessory pigments in chloroplast which, help in light absorption (Tanan et al., 2017). Chlorophyll content in leaves is accurately estimated either by destructive methods, an extraction protocol with an organic solvent such as acetone or ethanol (Sumanta et al., 2014). The chlorophyll extraction procedure is based on the solvent polarity, purity, incubation time and temperature, and equations of chlorophyll estimation (Ritchie, 2008), but it’s also time consuming, expensive process and destruction of the leaf which, will not allow the researches to follow up chlorophyll content in the same leaf (Gitelson et al., 2006). Second chlorophyll estimation method is nondestructive method by using a simple portable instrument that estimate the level of leaves green color such as Japanese made SPAD or American made atLEAF instruments (Limantara et al., 2015). The soil plant analysis development (SPAD-502 Plus Konica Minolta Tokyo, Japan) is generally used for nondestructive chlorophyll concentration assessment, the chlorophyll meter emits light frequencies at three wavelengths 650nm, 660nm and 620nm respectively (in red color region of light), and 940nm (infrared), chlorophyll absorbs the red and not the infrared so the difference is called the optical density difference (ODD) (Nauš et al., 2010). The atLEAF chlorophyll meter (at-LEAF FT-GREEN-LLC Willington, DE, USA) uses the wavelength 653nm (in the red color region of light) and 931nm (infrared) (Novichonok et al., 2016). Zhu et al. (2012) documented that atLEAF instrument from USA as alternative to SPAD-502 from Japan for chlorophyll estimation due to its lower price and portable and easier use. The advantages of nondestructive methods can be summarized in that its rapid, not expensive, and the same leaf or crop can be followed up during the agricultural season, so today chlorophyll nondestructive instruments are commonly used in agriculture to indicate the crop growth requirements especially nitrogen due to the reality that the majority of leaf nitrogen exist in chlorophyll molecule (Netto et al., 2005). Richardson et al. (2002) reported that it is very important to indicate calibration equation for each plant species in the process of nondestructive chlorophyll estimation. Therefore, some limiting factors such as leaf size, leaf thickness, and non-equal chlorophyll distribution can be solved by species calibration curve for each plant (Limantara et al., 2015; Jiang et al., 2017). The units for both SPAD and atLEAF instruments is SPAD and atLEAF values so each instrument have its own values (Zhu et al., 2012). These chlorophyll estimation methods have a distinct position in studying plant biodiversity in different areas (Samsone et al., 2007). Since there were no studies in Iraqi Kurdistan Region to compare between different chlorophyll estimation techniques for this reason the goals of this study were comparing four techniques of chlorophyll estimation (two nondestructive techniques by using chlorophyll meter instruments and two destructive techniques by using two organic solvents) for two vegetable crops (roma tomatoes, and green pepper) in three different environments (open field, lath house, and plastic house). Implementing correlation and regression analysis to indicate the best applicable technique for chlorophyll estimation.
Materials and Methods
Study site
The experiment was conducted on the Agricultural engineering sciences college, Salahaddin university- Erbil fields in grdarasha county (N= 360 06’ 49’’ E= 440 00 ‘47’’ and Elevation 407m) during 2015 vegetable growing season at three places open filed, lath house, and plastic house. The soil texture was clay loam (CL) according to USDA Classification it goes under order Inceptisol and suborder Xerepts with pH 7.55, organic matter 1.10%, Electrical conductivity was 0.70 ds.m-1, nitrogen 0.06%, phosphorus 2.99 ppm and potassium 119.33 ppm (Yaseen et al., 2018).
Experimental design
The experiment consisted of chlorophyll estimation by two methods destructive methods using two organic solvents (100% ethanol and 80% acetone), and nondestructive methods using two instruments (SPAD and atLEAF). Chlorophyll from leaves of two plant species Tomato Solanum lycopersicum L. and bell pepper Capsicum annuum L. that were sown in three different environments (open field, lath house, and plastic house) in the same field were estimated.
Agronomical practices
Experimental plots were prepared separately in different places in the same field by dry plowings, leveling, after that tomato and green pepper seeds were sown in two plastic trays with 80 cells each and placed in a small plastic tunnel maintaining temperature 25℃. After germination (3 days after seeding) the trays were moved to the bigger plastic tunnel and waited up to distinct 3-4 true leaves. In the middle of April 2015, the seedlings with 3–4 true leaves or (around 35 days from seeding) were transplanted in the prepared plots. Twenty seedlings per plant species were subjected to each experimental location. Mature leaves from the third node of each plant were harvested while the first flowering bloomed (around 55 days after transplanting) on 21st of June 2015. Diammonium phosphate DAP 120 kg.ha-1.was added to soil prior to seedlings planting, nitrogen fertilizers were added by the rate 80 kg. ha-1 in four doses first after 20 days from transplanting and the second, third and fourth after 40, 60, and 80 day’s form transplanting (Wahead et al., 2010), Irrigation of the three locations conducted twice weekly.
Chlorophyll estimation
This process was conducted at first flowering bloom (around 55 days after transplanting) on 21st of June 2015. First by non-destructive method using both chlorophyll estimation instruments SPAD and atLEAF which estimated the chlorophyll content from mature leaves from the third node of each plant in the three locations. Second estimation method was done through destructive procedures where the previously mentioned leaves harvested and brought to the lab to indicate chlorophyll levels by using two organic solvents, 80% acetone and 100% ethanol.
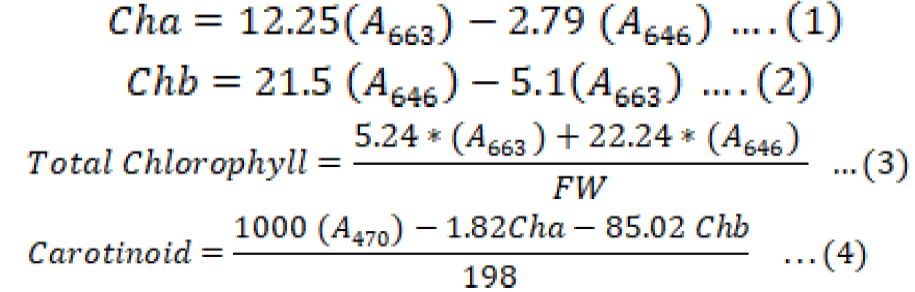
In 80% acetone solvent procedure, 0.25g of leaf sample was grounded in 2ml of 80%acetone in combination of sand 0.1% or 0.1 CaCO3 to avoid chorophllase activities, then samples were filtered through filter papers and the final volume was completed to 25ml and then taken to spectrophotometer to indicate absorbency (A663, A646 and A470) calculating were done according to Equations 1, 2, 3 and 4 (Lichtenthaler and Buschmann, 2001; Faraj, 2017; Brix, 2009).
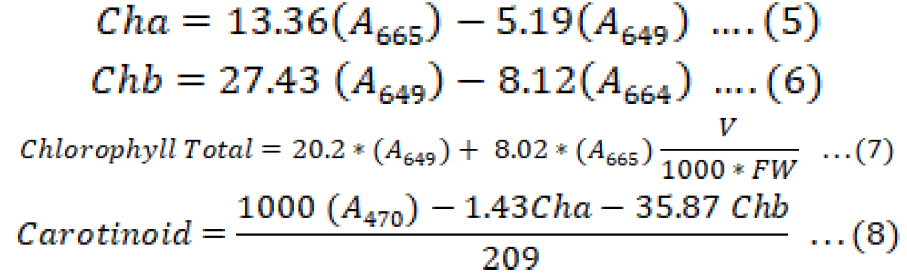
In procedure of 100% ethanol, 0.25g of leaf excised and rolled into 30ml containing dark bottles, then 25ml of 100% ethanol were added and left in a dark-place for 24 hours, after that the solution decanted into 150ml containing dark bottle, then the empty dark bottle containing the rolled leaf filled with another 25 ml of 100% ethanol then it was left for another 24 hours in a dark-place, next day it was added to the 150 ml dark bottle, the process of adding 25 ml of ethanol repeated for third time, finally the 75 ml was used for chlorophyll estimation. Absorbency was measured by spectrophotometer (A665, A649 and A470) Equations 5, 6, 7 and 8 (Knudson et al., 1977; Bhattacharjee and Sharma, 2012). The used spectrophotometer in this study was APEL PD-303 made in Japan.
Statistical analysis
All recorded data were based on fresh weight and subjected to SPSS computer analysis version 22 analysis (SPSS Inc., Chicago, USA) correlation, and regression analysis according to (Weinberg and Abramowitz, 2008) and (Landau, 2004).
Results and Discussion
Effect of plant species on chlorophyll content measurement tools
Results of this study indicated significant differences in SPAD and at-LEAF data of chlorophyll estimation as shown in Table 1 where there were highest levels of chlorophyll 51.07SPAD and 59.75 at-LEAF in pepper plants according to SPAD and at-LEAF nondestructive chlorophyll estimation methods, while lowest values were recorded in tomato leaves 43.71SPAD and 49.19 at-LEAF. No significant differences were observed between the studied species when chlorophyll content estimation was implemented by destructive methods using 80% acetone and 100% ethanol.
Although the destructive method is somehow considered as more accurate comparing to the nondestructive method in that all the chlorophyll content will be extracted by an organic solvent but in this study there were no significant differences between the two studied plant species which, may be related the genetic properties of each plant (Castelli et al., 1996).
Effect of place on chlorophyll content using different chlorophyll measurement techniques
There were significant differences between the plant species growing places (Table 2). Open field growing plants recorded higher chlorophyll content when assessment conducted by nondestructive methods. With SPAD instrument highest chlorophyll content (54.22 SPAD) was recorded in open field growing plants and the lowest chlorophyll content was (39.95 SPAD) in lath house growing plants. When at-LEAF instrument used open field, plants get the highest chlorophyll content (61.45 at-LEAF) and the lowest chlorophyll content was (45.93 at-LEAF) with lath house growing plants. Destructive methods did not show any significant differences between growing places only in carotenoid levels by 100% ethanol. The highest carotenoid content was (6.66 μg.gfm-1) in open field growing plants while the lowest value for carotenoids was (4.87 μg.gfm-1) in lath house growing plants. The reason of higher chlorophyll content when SPAD and at-LEAF instrument used may be related to the sensor signals of both instruments that respond to different wavelengths (Cerovic et al., 2012). The reason of carotenoid content may be due to that the destructive methods of chlorophyll content especially by 100% ethanol takes more than 72 hours which extract all the pigments form leaf samples or may be due to different wavelengths and equations that used for assessment which, means organic solvent and extraction duration (Sumanta et al., 2014).
Effect of the combination of plant species and growing place on chlorophyll content using different chlorophyll measurement techniques
There were significant differences in chlorophyll content between plant species that grows in different places as shown in (Table 3). When SPAD instrument
Table 1: Comparison between chlorophyll content in two plant species using different chlorophyll measurement techniques.
|
Plant |
SPAD |
atLEAF |
80% Acetone (μg.mg-1dry weight) |
100% Ethanol (μg.mg-1dry weight) |
|||||||||
|
Chl-a |
Chl-b |
Chla /Chlb |
Total Chl |
Carotein |
Chl-a |
Chl-b |
Chla/Chlb |
Total Chl |
Carotein |
||||
|
Tomato |
43.71 b |
49.19 b |
1.94 |
2.00 |
0.96 |
3.94 |
3.17 |
4.61 |
2.79 |
2.5 |
7.41 |
5.35 |
|
|
Pepper |
51.07 a |
59.75 a |
2.30 |
1.79 |
1.34 |
4.10 |
3.53 |
4.50 |
1.15 |
3.27 |
5.66 |
5.80 |
|
Note: Means with the same symbols in one column are not significantly different from each other at alpha = 0.05 based on multiple range test of Duncan
Table 2: The Effect of growing place on chlorophyll content using different chlorophyll measurement techniques.
|
Place |
SPAD |
atLEAF |
80% Acetone (μg.mg-1dry weight) |
100% Ethanol (μg.mg-1dry weight) |
||||||||
|
Chl-a |
Chl-b |
Chla/Chlb |
Total Chl |
Carotein |
Chl-a |
Chl-b |
Chla/Chlb |
Total Chl |
Carotein |
|||
|
Lath House |
39.95 c |
45.93 c |
2.10 |
2.00 |
1.07 |
1.07 |
3.33 |
3.89 |
1.52 |
2.80 |
2.80 |
4.87 b |
|
Open Field |
54.22 a |
61.45 a |
2.02 |
1.99 |
1.14 |
1.14 |
3.27 |
5.75 |
2.16 |
3.01 |
3.01 |
6.66 a |
|
Plastic House |
48.00 b |
56.03 b |
2.20 |
1.82 |
1.25 |
1.25 |
3.41 |
4.14 |
2.66 |
2.85 |
2.85 |
5.17 ab |
Note: Means with the same symbols in one column are not significantly different from each other at alpha = 0.05 based on multiple range test of Duncan.
Table 3: The effect of the combination of plant species and growing place on chlorophyll content using different chlorophyll measurement techniques.
|
Plant species |
Place |
SPAD |
atLEAF |
80% Acetone (μg.mg-1dry weight) |
100% Ethanol (μg.mg-1dry weight) |
||||||||
|
Chl-a |
Chlb |
Chla |
Total Chl |
Carotein |
Chl-a |
Chl-b |
Chla |
Total Chl |
Carotein |
||||
|
/ Chlb |
|
|
/ Chlb |
|
|||||||||
|
Tomato |
Lath House |
35.63 c |
40.58 d |
2.08 |
1.97 |
1.06 ab |
4.43 |
3.29 ab |
4.305 |
4.636 |
4.967 |
6.16 |
5.298 |
|
Open Field |
51.97 ab |
55.47 bc |
1.53 |
2.28 |
0.69 b |
4.15 |
2.83 b |
5.015 |
5.215 |
5.415 |
8.60 |
5.615 |
|
|
Plastic House |
43.53 bc |
51.52 c |
2.11 |
1.93 |
1.14 ab |
4.43 |
3.32 ab |
3.575 |
3.62 |
3.665 |
7.49 |
3.71 |
|
|
Pepper |
Lath House |
44.27 bc |
51.28 c |
2.11 |
2.03 |
1.07 ab |
4.33 |
3.37 ab |
4.345 |
4.858 |
5.371 |
3.66 |
5.884 |
|
Open Field |
56.47 a |
67.42 a |
2.52 |
1.71 |
1.60 a |
4.64 |
3.71 a |
5.56 |
6.075 |
6.59 |
7.21 |
7.105 |
|
|
Plastic House |
52.47 ab |
60.54 b |
2.29 |
1.7 |
1.36 ab |
4.37 |
3.50 ab |
5.465 |
6.073 |
6.681 |
6.11 |
7.289 |
|
Note: Means with the same symbols in one column are not significantly different from each other at alpha = 0.05 % based on multiple range test of Duncan.
Table 4: Correlation analysis for chlorophyll content measurement tools.
|
Correlation |
SPAD |
atLEAF |
80% Acetone |
100% Ethanol |
|||||||
|
Chla |
Chlb |
Chla/ chlb |
carote-noid |
Chla |
Chlb |
Chla/ chlb |
Carote-noid |
||||
|
SPAD |
1.00 |
|
|
|
|
|
|
|
|
|
|
|
atLEAF |
0.86** |
1.00 |
|
|
|
|
|
|
|
|
|
|
80% Acetone |
Chla |
0.05 |
0.30 |
1.00 |
|
|
|
|
|
|
|
|
Chlb |
-0.06 |
-0.19 |
0.01 |
1.00 |
|
|
|
|
|
|
|
|
Chla/chlb |
0.14 |
0.41 |
0.63** |
-0.71** |
1.00 |
|
|
|
|
|
|
|
carotenoid |
0.06 |
0.31 |
0.92** |
-0.29 |
.78** |
1.00 |
|
|
|
|
|
|
100% Ethanol |
Chla |
0.37 |
0.29 |
0.00 |
0.13 |
0.05 |
-0.02 |
1.00 |
|
|
|
|
Chlb |
-0.07 |
0.05 |
0.02 |
-0.26 |
0.23 |
0.05 |
0.03 |
1.00 |
|
|
|
|
Chla/chlb |
0.40 |
0.25 |
0.28 |
0.31 |
-0.04 |
0.22 |
0.31 |
-0.73** |
1.00 |
|
|
|
carotenoid |
0.39 |
0.32 |
0.07 |
0.05 |
0.16 |
0.06 |
0.95** |
-0.19 |
0.44 |
1.00 |
|
* Correlation is significant at the 0.05 level (2-tailed); ** Correlation is significant at the 0.01 level (2-tailed).
was used for chlorophyll content measurement the highest level was (56.47 SPAD) in pepper plants that grown in open field, whereas the lowest level was (35.63 SPAD) in tomato plants under lath house shades. Using atLEAF instrument indicated highest levels of chlorophyll content in open filed pepper plants (67.42 atLEAF) and the lowest level was recorded with tomato plants under the shade of lath house (40.58 atLEAF). The reason of this differences in nondestructive methods of chlorophyll estimation is related to their emitting light frequencies, and the reality of higher chlorophyll content in sun leaves comparing to shade leaves where Sun leaves contain more stroma with higher levels of Calvin-cycle enzymes, and higher chloroplast numbers comparing to shade leaves (Lambers et al., 2008). The ratio of Chlorophyll a to chlorophyll b when 80% acetone was used indicated significant differences between studied plants in the three places and the highest ratio was (1.60) in pepper plants grown under natural light (open field) and the lowest level (0.69) was recorded with open filed tomato plants. Carotenoid content differed significantly where, the highest level was (3.71 μg.gfm-1) in open filed pepper leaves and the lowest level was (2.83 μg.gfm-1) in tomato leaves grown in open field location. The main purpose of carotenoids high levels in sun leaves is to protect chloroplast from photooxidation, and their act as accessory pigments that absorbs energy light that chlorophyll a dose not absorb (Demmig-Adams and Adams III, 1996).
Correlation and regression analysis results
Significant positive correlation was observed between SPAD and atLEAF data for chlorophyll estimation and correlation coefficient was 0.92 (Table 4) that was measured in different locations for the two plant species. This result postulate the reality of using both instruments as alternative tools with preferring the economic issues that concern these instrument prices and the importance of monitoring field or horticulture crop plants (Clevers and Gitelson, 2013). Destructive methods with 80%acetone indicated positive correlation between chlorophyll a with the ratio of chlorophyll a to b and carotenoids level (0.83) and (0.90) respectively, while the negative correlation was observed between chlorophyll b levels and the ratio of chlorophyll a to b (-0.58), but the correlation between the ratio of chlorophyll a to b with carotenoid levels was also positive (0.88). the second studied destructive method was 100%ethanol which get positive correlation between chlorophyll a and chlorophyll b (0.57), chlorophyll a and carotenoids (0.95) meanwhile the negative correlation was recorded between chlorophyll b and the ratio of chlorophyll a to b (-0.56).
The regression equation between atLEAF and SPAD nondestructive methods indicated linear relationship with R2 equals to (0.74) (Figure 1A). The regression equation between Total chlorophyll that was estimated by destructive methods using 100%ethanol and SPAD nondestructive method indicated linear relation with R2 equal to (0.42) as shown in Figure 1B, while the regression equation between atLEAF and 100% ethanol extracted total chlorophyll had the R2 equal to (0.54) (Figure 1C), therefore both instruments can be used for chlorophyll estimation with different crop plants in various environmental conditions, but atLEAF can be used as an inexpensive and easier alternative to SPAD instrument in different light intensities (Padilla et al., 2018). It was obvious from regression study that 100% ethanol extract chlorophyll was best manipulated by our nondestructive chlorophyll estimation methods (Figure 1D).
Studied destructive methods by using 80% acetone and 100% ethanol indicated a linear relationship between chlorophyll a content and carotenoids levels with R2 equals to 0.85 and 0.90 respectively (Figure 2A and B). These results proposed the reality of the correlation between Chlorophyll a content and carotenoids levels in chloroplast may this relation refers to the ability of carotenoids to protect chlorophylls from photooxidation, by reducing the activity of both highly reactive singlet excited oxygen and the triplet excited chlorophyll, also its ability of absorbing blue light of the visible spectrum (Hopkins, 1999).
Conclusions and Recommendations
Results of this study clearly indicated the differences between chlorophyll content of the same plant tomato or green pepper in different environments, nondestructive methods could be used successfully as an alternative to destructive methods, atLEAF and SPAD instrument levels are strongly correlated under different light intensities, so they could be utilized for easy and fast estimation methods for agricultural areas. We recommend conducting more studies to establish calibration equation for estimation of other plant pigments such as chlorophyll b and carotenoids.
Novelty Statement
This study can be considered as one of pioneer researches that compare chlorophyll estimation techniques (two destructive and two nondestructive procedures).
Author’s Contribution
Kawa A. Ali: Designed and supervised the research, and wrote the manuscript.
Sazar S. Noraldeen and Arshad A. Yaseen: Performed all the experiments of the study.
Conflict of interest
The authors have declared no conflict of interest.
References
Bhattacharjee, S. and G.D. Sharma. 2012. Effect of dual inoculation of arbuscular mycorrhiza and rhizobium on the chlorophyll, nitrogen and phosphorus contents of pigeon pea (Cajanus cajan L.). Adv. Microbiol., 2: 561-564. https://doi.org/10.4236/aim.2012.24072
Brix, H. 2009. Chlorophylls and carotenoids in plant material. Protokol Plants Chlorophyll ab carotenoids ethanol. pp. 1-3.
Castelli, F., R. Contillo and F. Miceli. 1996. Non-destructive determination of leaf chlorophyll content in four crop species 1. J. Agron. Crop Sci., 177: 275-283. https://doi.org/10.1111/j.1439-037X.1996.tb00246.x
Cerovic, Z.G., G. Masdoumier, N.B. Ghozlen and G. Latouche. 2012. A new optical leaf-clip meter for simultaneous non-destructive assessment of leaf chlorophyll and epidermal flavonoids. Physiol. Plant., 146: 251-260. https://doi.org/10.1111/j.1399-3054.2012.01639.x
Clevers, J.G. and A.A. Gitelson. 2013. Remote estimation of crop and grass chlorophyll and nitrogen content using red-edge bands on Sentinel-2 and-3. Int. J. Appl. Earth Observ. Geoinf., 23: 344-351. https://doi.org/10.1016/j.jag.2012.10.008
Davies, K. 2009. Annual plant reviews, plant pigments and their manipulation, John Wiley and Sons.
Demmig-Adams, B. and W.W. Adams Iii. 1996. The role of xanthophyll cycle carotenoids in the protection of photosynthesis. Trends Plant Sci., 1: 21-26. https://doi.org/10.1016/S1360-1385(96)80019-7
Faraj, H.A., 2017. Biosorption of pharmaceuticals and noble metals nanoparticles by algal turf communities.
Gitelson, A.A., G.P. Keydan and M.N. Merzlyak. 2006. Three-band model for noninvasive estimation of chlorophyll, carotenoids, and anthocyanin contents in higher plant leaves. Geophys. Res. Lett., pp. 33. https://doi.org/10.1029/2006GL026457
Hopkins, W.G. 1999. Introduction to plant physiology, John Wiley and Sons.
Jiang, C., M. Johkan, M. Hohjo, S. Tsukagoshi and T. Maruo. 2017. A correlation analysis on chlorophyll content and SPAD value in tomato leaves. Hortic. Res., 71: 37-42.
Knudson, L.L., T.W. Tibbitts and G.E. Edwards. 1977. Measurement of ozone injury by determination of leaf chlorophyll concentration. Plant Physiol., 60: 606-608. https://doi.org/10.1104/pp.60.4.606
Lack, A.J. and D.E. Evans. 2005. Plant biology, Garland Science.
Lambers, H., F.S. Chapin Iii and T.L. Pons. 2008. Plant physiological ecology, Springer Science and Business Media. https://doi.org/10.1007/978-0-387-78341-3
Landau, S. 2004. A handbook of statistical analyses using SPSS, CRC. https://doi.org/10.1201/9780203009765
Lichtenthaler, H.K. and C. Buschmann. 2001. Extraction of phtosynthetic tissues: chlorophylls and carotenoids. Curr. Prot. Food Anal. Chem., 1: F4. 2.1-F4. 2.6. https://doi.org/10.1002/0471142913.faf0402s01
Limantara, L., M. Dettling, R. Indrawati and T.H.P. Brotosudarmo. 2015. Analysis on the chlorophyll content of commercial green leafy vegetables. Proc. Chem., 14: 225-231. https://doi.org/10.1016/j.proche.2015.03.032
Nauš, J., J. Prokopová, J. Řebíček and M. Špundová. 2010. SPAD chlorophyll meter reading can be pronouncedly affected by chloroplast movement. Photosynth. Res., 105: 265-271. https://doi.org/10.1007/s11120-010-9587-z
Netto, A.T., E. Campostrini, J.G. De Oliveira and R.E. Bressan-Smith. 2005. Photosynthetic pigments, nitrogen, chlorophyll a fluorescence and SPAD-502 readings in coffee leaves. Sci. Hortic., 104: 199-209. https://doi.org/10.1016/j.scienta.2004.08.013
Novichonok, E., A. Novichonok, J. Kurbatova and E. Markovskaya. 2016. Use of the atLEAF+ chlorophyll meter for a nondestructive estimate of chlorophyll content. Photosynthetica, 54: 130-137. https://doi.org/10.1007/s11099-015-0172-8
Padilla, F.M., R. De Souza, M.T. Peña-Fleitas, M. Gallardo, C. Gimenez and R.B. Thompson. 2018. Different responses of various chlorophyll meters to increasing nitrogen supply in sweet pepper. Front. Plant Sci., 9: 1752. https://doi.org/10.3389/fpls.2018.01752
Porra, R.J. 2002. The chequered history of the development and use of simultaneous equations for the accurate determination of chlorophylls a and b. Photosynth. Res., 73: 149-156.
Richardson, A.D., S.P. Duigan and G.P. Berlyn. 2002. An evaluation of noninvasive methods to estimate foliar chlorophyll content. New Phytol., 153: 185-194.
Ritchie, R. 2008. Universal chlorophyll equations for estimating chlorophylls a, b, c, and d and total chlorophylls in natural assemblages of photosynthetic organisms using acetone, methanol, or ethanol solvents. Photosynthetica, 46: 115-126. https://doi.org/10.1007/s11099-008-0019-7
Samsone, I., U. Andersone, M. Vikmane, B. Ieviņa, G. Pakarna and G. Ievinsh. 2007. Nondestructive methods in plant biology: an accurate measurement of chlorophyll content by a chlorophyll meter. Acta Univ. Latviensis, 723: 145-154.
Sumanta, N., C.I. Haque, J. Nishika and R. Suprakash. 2014. Spectrophotometric analysis of chlorophylls and carotenoids from commonly grown fern species by using various extracting solvents. Res. J. Chem. Sci., ISSN, 2231, 606X.
Taiz, L., E. Zeiger, I.M. Møller and A. Murphy. 2015. Plant physiology and development. Sinauer publishing. USA.
Tanan, T.T., M.N. Do Nascimento, R. Da Silva Leite and D.S. Guimarães. 2017. Spectrophotometric determinations of chloroplastidic pigments in Physalis angulata L. leaves using different methodologies. J. Agric. Sci., 9: 117. https://doi.org/10.5539/jas.v9n11p117
Wahead, A.I.K., H.S. Ibrahim, E.H. Al-Doghachi and H.A. Abdul. 2010. Field performance of eight Tomato hybrids grown in plastic tunnels at al-Basrah desert region. Basrah J. Agric. Sci., 23: 81-94. https://doi.org/10.33762/bagrs.2010.56626
Weinberg, S.L. and S.K. Abramowitz. 2008. Statistics using SPSS: An integrative approach, Cambridge University Press.
Yaseen, A.A., Y.A.M. Abd-Sabry and A.O. Esmaiel. 2018. Effect of applied phosphorus and potassium and their interactions on broccoli (Brassica oleracea var. italica) yield and some leaf characteristics, 8(30): 121-131. https://doi.org/10.25156/ptj.2018.8.3.241
Zhu, J., N. Tremblay and Y. Liang. 2012. Comparing SPAD and atLEAF values for chlorophyll assessment in crop species. Can. J. Soil Sci., 92: 645-648. https://doi.org/10.4141/cjss2011-100
To share on other social networks, click on any share button. What are these?


